

Abstract
Previous twin studies have shown strong heritability of electroencephalogram amplitude characteristics, such as power spectra. However, it has been suggested that these high heritabilities may reflect “trivial” twin resemblance in intervening tissues such as the skull. Here we demonstrate strong monozygotic twin correlation (0.79 < r < 0.88) of eyes‐closed resting‐state magnetoencephalogram power, which is insensitive to intervening tissues. These results confirm that brain activity itself is highly heritable. Hum Brain Mapp, 2009. © 2008 Wiley‐Liss, Inc.
Keywords: brain electrical activity, magnetoencephalography, correlation study, monozygotic twins
INTRODUCTION
Electroencephalogram (EEG) measurements in humans consistently indicated a significant genetic influence on individual differences in electrical brain activity [van Beijsterveldt and Boomsma, 1994; Vogel and Motulsky, 1997]. For example, large‐scale studies that compared similarities of EEG characteristics between genetically identical, monozygotic (MZ) twins and nonidentical dizygotic (DZ) twins estimated high heritabilities for power in the classical EEG frequency bands. For power in delta, theta, alpha, and beta bands heritabilities range from 55% to 90% in children [Van Baal et al., 1996] and 70% to 90% in adolescents [Smit et al., 2006; van Beijsterveldt et al., 1996; Zietsch et al., 2007] and adults [Smit et al., 2005]. These findings suggest that, besides brain anatomy [Toga and Thompson, 2005], resting‐state brain function is also under strong genetic control. However, EEG power is strongly influenced by electrical conductivity of tissue layers between the brain and scalp electrodes, in particular the skull [Babiloni et al., 1997; Leissner et al., 1970]. Heritability estimates of EEG power could be strongly inflated by greater MZ similarity for these intervening biological tissues which, as many other anatomical traits, are highly heritable themselves [Kohn, 1991]. In this study, we reevaluate twin resemblance in oscillatory brain activity using magnetoencephalogram (MEG) recordings. Compared to EEG which measures tangential as well as radially oriented currents, MEG is selectively sensitive to cortical sources with tangential orientation to the skull surface, i.e., the electromagnetic activity from cortical fissures [Hamalainen et al., 1993]. Nevertheless, given that both recording techniques detect synchronized neuronal currents, EEG and MEG signals can be regarded as functionally related which also has been confirmed empirically, e.g., [Kirsch et al., 2007; Nikulin et al., 2005]. In contrast to EEG however, MEG measures magnetic fields resulting from electrical brain activity which are virtually undistorted by tissue covering the brain [Okada et al., 1999; Wolters et al., 2006].
METHODS
Participants
Our sample consisted of 20 healthy right‐handed MZ twin pairs (10 male, 18.8 ± 0.6 yrs; 10 female, 18.8 ± 0.4 yrs). Zygosity was based on buccal cell DNA typing. All twins provided informed consent and the study was approved by the medical ethics committee of the Vrije Universiteit medical center.
MEG Recordings
Magnetic brain activity was recorded for 10 min during eyes‐closed rest, using a 151 sensor whole‐head scanner with axial gradiometers (VSM Medtech, Canada). Sampling rate was 625 Hz, with low‐pass filtering at 265 Hz. Before and after each measurement head position was determined and, to correct for the influence of head position on recorded amplitudes, MEG data for each individual were extrapolated onto new data sets with the same sensor locations corresponding to an average head position across twins [de Munck et al., 2001].
Data Processing
MEG signals were processed using Fieldtrip software (F.C. Donders Centre for Cognitive Neuroimaging; http://www.ru.nl/fcdonders/fieldtrip). The 10 min recording sessions were partitioned into 120 epochs of 5 s. Epochs containing artifacts including excessive amplitude offsets and muscle activity were excluded after visual inspection. Eye movement and eye blink signals were removed by means of independent component analysis available in fieldtrip. For each 5 s epoch, MEG power was determined by applying a Fast Fourier Transform on the signal from each sensor, after subtracting the mean MEG amplitude and convolving the data with a Hanning taper. Smoothed powers between 1.5 and 30 Hz, with 0.2 Hz resolution, were computed by averaging the power values over epochs. Finally, power values were summed separately for the four classical frequency bands, delta (1.6–3.6 Hz), theta (4.0–7.6 Hz), alpha (8.0–12.6 Hz), and beta (13.0–25.0 Hz) and transformed to a Gaussian distribution using log10(x) [Pivik et al., 1993]. Similarities of log transformed power values between MZ twins were quantified, for each recording sensor, using Pearson's linear correlation coefficient. There were no indications of sex differences, therefore correlations were determined across the entire sample of male and female twin pairs.
RESULTS
MZ twin correlations of log transformed mean powers for each sensor across the scalp in Figure 1 and across sensors grouped according to scalp subdivision in Table I clearly indicate that within‐pair MZ twin correlations for MEG power in all classical broad frequency bands were very high across the scalp and highly similar to those previously reported for EEG [Smit et al., 2005; Van Baal et al., 1996; van Beijsterveldt et al., 1996; Zietsch et al., 2007]. Also in agreement with EEG findings [Van Baal et al., 1996; van Beijsterveldt et al., 1996], correlations were relatively reduced for slower brain rhythms, especially for the delta band (Table I: 0.79 across sensors). This may be indicative of environmental influences on slow waves but, because reduced correlations were observed mainly at bilateral temporal and left frontal scalp locations, most likely reflects the lower signal‐to‐noise level at these anterior brain sites. In addition, there may be additional error variance introduced by residual biomagnetic activity from eye movement and/or eye blink signals.
Figure 1.
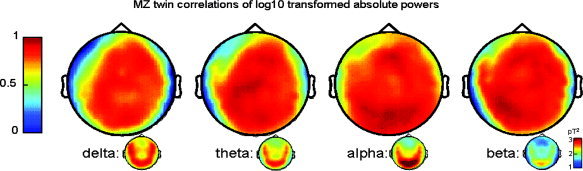
Scalp topographies of twin correlations for log10 transformed mean powers, across all 20 MZ twin pairs, for each MEG frequency band. Color coding ranges from darkblue (correlation: 0) to darkred (correlation: 1). As is immediately clear from the figure, twin resemblance in MEG power was high to very high across the scalp in the delta (1.6–3.6 Hz), theta (4.0–7.6 Hz), alpha (8.0–12.6 Hz), and beta (13.0–25.0 Hz) frequency bands. Small map inserts below each correlation map show distributions of absolute powers (darkblue: 0 to darkred 3.2 picoTesla2). Delta and theta bands exhibit a clear posterior/temporal power distribution. As classically observed during rest, highest power was observed in the alpha frequency range, peaking around 10 Hz, and with posterior scalp maximum. Scalp topography for the beta band was similar to alpha, except for lower power.
Table I.
MZ twin correlations per sensor group
| RO (10) | LO (9) | RP (9) | LP (9) | RC (15) | LC (15) | RT (21) | LT (21) | RF (16) | LF (15) | Z (9) | Sensor mean | |
|---|---|---|---|---|---|---|---|---|---|---|---|---|
| Delta | 0.82 (0.59–0.93) | 0.82 (0.59–0.93) | 0.82 (0.59–0.93) | 0.87 (0.70–0.95) | 0.86 (0.67–0.94) | 0.85 (0.65–0.94) | 0.69 (0.36–0.87) | 0.56 (0.16–0.80) | 0.84 (0.63–0.94) | 0.66 (0.31–0.85) | 0.87 (0.70–0.95) | 0.79 |
| Theta | 0.90 (0.76–0.96) | 0.89 (0.74–0.96) | 0.87 (0.70–0.95) | 0.92 (0.81–0.97) | 0.89 (0.74–0.96) | 0.91 (0.78–0.96) | 0.76 (0.48–0.90) | 0.73 (0.43–0.89) | 0.86 (0.67–0.94) | 0.69 (0.36–0.87) | 0.92 (0.81–0.97) | 0.85 |
| Alpha | 0.94 (0.85–0.98) | 0.94 (0.85–0.98) | 0.89 (0.74–0.96) | 0.90 (0.76–0.96) | 0.84 (0.63–0.94) | 0.84 (0.63–0.94) | 0.85 (0.65–0.94) | 0.85 (0.65–0.94) | 0.86 (0.67–0.94) | 0.77 (0.50–0.90) | 0.95 (0.88–0.98) | 0.88 |
| Beta | 0.89 (0.74–0.96) | 0.91 (0.78–0.96) | 0.88 (0.72–0.95) | 0.94 (0.85–0.98) | 0.90 (0.76–0.96) | 0.89 (0.74–0.96) | 0.78 (0.52–0.91) | 0.81 (0.57–0.92) | 0.90 (0.76–0.96) | 0.80 (0.55–0.92) | 0.94 (0.85–0.98) | 0.88 |
| Band mean | 0.89 | 0.89 | 0.87 | 0.91 | 0.87 | 0.87 | 0.77 | 0.74 | 0.87 | 0.73 | 0.92 |
Pearson's correlations (and 95% confidence intervals) between MZ twins of log10 transformed mean powers, averaged across sensors for 11 MEG sensorgroups defined according to scalp location: LO and RO: left and right occipital; LP and RP: parietal; LC and RC: central; LT and RT: temporal; LF and RF: frontal; Z: midline sensors. The number of individual sensors in each sensorgroup is indicated within brackets (one left occipital and one left frontal MEG sensor was excluded due to bad recording quality). All correlation coefficients were significant at p < 0.001, except for the delta band at sensorgroups LT and LF: p ≤ 0.01.
DISCUSSION
Our finding of high correlations of brain activity recorded with MEG between genetically identical MZ twins, in keeping with earlier EEG studies, falsifies the idea that MZ twin resemblance for brain activity is merely a byproduct of greater MZ similarity in intervening biological tissue. The current evidence from EEG studies in twins can therefore be safely interpreted to indicate a substantial influence of genetic factors on brain activity.
Acknowledgements
We thank Jeroen Verbunt for technical support.
REFERENCES
- Babiloni F,Babiloni C,Carducci F,Del Gaudio M,Onorati P,Urbano A ( 1997): A high resolution EEG method based on the correction of the surface Laplacian estimate for the subject's variable scalp thickness. Electroencephalogr Clin Neurophysiol 103: 486–492. [DOI] [PubMed] [Google Scholar]
- de Munck JC,Verbunt JP,van't Ent D,van Dijk BW ( 2001): The use of an MEG device as 3D digitizer and motion monitoring system. Phys Med Biol 46: 2041–2052. [DOI] [PubMed] [Google Scholar]
- Hamalainen M,Hari R,Ilmoniemi RJ,Knuutila J,Lounasmaa OV ( 1993): Magnetoencephalography––Theory, instrumentation, and applications to noninvasive studies of the working human brain. Rev Modern Phys 65: 413–497. [Google Scholar]
- Kirsch HE,Mantle M,Nagarajan SS ( 2007): Concordance between routine interictal magnetoencephalography and simultaneous scalp electroencephalography in a sample of patients with epilepsy. J Clin Neurophysiol 24: 215–231. [DOI] [PMC free article] [PubMed] [Google Scholar]
- Kohn LAP ( 1991): The role of genetics in craniofacial morphology and growth. Ann Rev Anthropol 20: 261–278. [Google Scholar]
- Leissner P,Lindholm LE,Petersen I ( 1970): Alpha amplitude dependence on skull thickness as measured by ultrasound technique. Electroencephalogr Clin Neurophysiol 29: 392–399. [DOI] [PubMed] [Google Scholar]
- Nikulin VV,Nikulina AV,Yamashita H,Rossi EM,Kahkonen S ( 2005): Effects of alcohol on spontaneous neuronal oscillations: A combined magnetoencephalography and electroencephalography study. Prog Neuropsychopharmacol Biol Psychiatry 29: 687–693. [DOI] [PubMed] [Google Scholar]
- Okada YC,Lahteenmaki A,Xu C ( 1999): Experimental analysis of distortion of magnetoencephalography signals by the skull. Clin Neurophysiol 110: 230–238. [DOI] [PubMed] [Google Scholar]
- Pivik RT,Broughton RJ,Coppola R,Davidson RJ,Fox N,Nuwer MR ( 1993): Guidelines for the recording and quantitative analysis of electroencephalographic activity in research contexts. Psychophysiology 30: 547–558. [DOI] [PubMed] [Google Scholar]
- Smit CM,Wright MJ,Hansell NK,Geffen GM,Martin NG ( 2006): Genetic variation of individual alpha frequency (IAF) and alpha power in a large adolescent twin sample. Int J Psychophysiol 61: 235–243. [DOI] [PubMed] [Google Scholar]
- Smit DJ,Posthuma D,Boomsma DI,Geus EJ ( 2005): Heritability of background EEG across the power spectrum. Psychophysiology 42: 691–697. [DOI] [PubMed] [Google Scholar]
- Toga AW,Thompson PM ( 2005): Genetics of brain structure and intelligence. Annu Rev Neurosci 28: 1–23. [DOI] [PubMed] [Google Scholar]
- Van Baal GC,De Geus EJ,Boomsma DI ( 1996): Genetic architecture of EEG power spectra in early life. Electroencephalogr Clin Neurophysiol 98: 502–514. [DOI] [PubMed] [Google Scholar]
- van Beijsterveldt CE,Boomsma DI ( 1994): Genetics of the human electroencephalogram (EEG) and event‐related brain potentials (ERPs): A review. Hum Genet 94: 319–330. [DOI] [PubMed] [Google Scholar]
- van Beijsterveldt CE,Molenaar PC,De Geus EJ,Boomsma DI ( 1996): Heritability of human brain functioning as assessed by electroencephalography. Am J Hum Genet 58: 562–573. [PMC free article] [PubMed] [Google Scholar]
- Vogel F,Motulsky AG ( 1997): Brain physiology: Genetics of the EEG In: Vogel F,Motulsky AG, editors. Human Genetics: Problems and Approaches, 3rd ed. Berlin: Springer‐Verlag; pp 674–677. [Google Scholar]
- Wolters CH,Anwander A,Tricoche X,Weinstein D,Koch MA,MacLeod RS ( 2006): Influence of tissue conductivity anisotropy on EEG/MEG field and return current computation in a realistic head model: A simulation and visualization study using high‐resolution finite element modeling. Neuroimage 30: 813–826. [DOI] [PubMed] [Google Scholar]
- Zietsch BP,Hansen JL,Hansell NK,Geffen GM,Martin NG,Wright MJ ( 2007): Common and specific genetic influences on EEG power bands delta, theta, alpha, and beta. Biol Psychol 75: 154–164. [DOI] [PubMed] [Google Scholar]