

Abstract
Independent component analysis (ICA) of functional magnetic resonance imaging (fMRI) time‐series reveals distinct coactivation patterns in the resting brain representing spatially coherent spontaneous fluctuations of the fMRI signal. Among these patterns, the so‐called default‐mode network (DMN) has been attributed to the ongoing mental activity of the brain during wakeful resting state. Studies suggest that many neuropsychiatric diseases disconnect brain areas belonging to the DMN. The potential use of the DMN as functional imaging marker for individuals at risk for these diseases, however, requires that the components of the DMN are reproducible over time in healthy individuals. In this study, we assessed the reproducibility of the DMN components within and between imaging sessions in 18 healthy young subjects (mean age, 27.5 years) who were scanned three times with two resting state scans during each session at 3.0T field strength. Statistical analysis of fMRI time‐series was done using ICA implemented with BrainVoyager QX. At all three sessions the essential components of the DMN could be identified in each individual. Spatial extent of DMN activity and size of overlap within and between sessions were most reproducible for the anterior and posterior cingulate gyrus. The degree of reproducibility of the DMN agrees with the degree of reproducibility found with motor paradigms. We conclude that DMN coactivation patterns are reproducible in healthy young subjects. Therefore, these data can serve as basis to further explore the effects of aging and neuropsychiatric diseases on the DMN of the brain. Hum Brain Mapp, 2010. © 2009 Wiley‐Liss, Inc.
Keywords: functional MRI, functional connectivity, reproducibility, resting state network
INTRODUCTION
Analysis of functional connectivity between distant areas in the resting brain is an important focus of neuroimaging research. Electroencephalography studies demonstrated specific brain regions with correlated patterns of spontaneous activity during rest [Goldman et al.,2002; Laufs et al.,2003; Tucker et al.,1986]. Group analysis of positron emission tomography (PET) data obtained from healthy subjects using 18FDG showed a temporally stable pattern of cortical and subcortical glucose uptake during resting state [Tyler et al.,1988]. Magnetic resonance (MR) imaging showed synchronized low‐frequency signal fluctuations in the resting brain. These signal changes are considered to represent changes in regional blood‐flow due to neural firing rates within distributed cortical networks [Biswal et al.,1995; Cordes et al.,2001]. Brain regions showing coherent fluctuations constitute a “resting‐state network.”
Independent component analysis (ICA) has shown to be a powerful tool for extracting functional connectivity patterns of synchronized neural activity from functional magnetic resonance imaging (fMRI) time series. In the application of ICA to fMRI data, MR signals are modeled as linear mixtures of unknown spatially independent processes (including BOLD fluctuations, head motion, noise, and cardiac related signal changes). Each of these influences contributes to the data set with unknown time profile. The time series are decomposed into spatial components which have a unique time course [McKeown et al.,1998; McKeown and Sejnowski,1998]. Using this purely data‐driven approach, several functionally connected networks of the brain have been identified from fMRI data in the absence of external stimuli or cognitive tasks. One of the first networks identified was the motor network [Biswal et al.,1995]. Synchronous fluctuations have additionally been identified in brain regions involved in visual, motor and sensory, language and auditory processing [Cordes et al.,2000; Damoiseaux et al.,2006; Mantini et al.,2007]. Also networks containing areas involved in attention and self‐referential mental activity have been identified [D'Argembeau et al.,2005; Mantini et al.,2007].
One network specific to the resting state of the brain is the so‐called default‐mode network (DMN). Raichle et al. [2001] established the concept of brain regions that are active during rest and deactivated when specific goal‐directed behavior is needed using positron‐emission tomography data. These regions could consistently be reproduced by ICA of fMRI data [Damoiseaux et al.,2006; Fox et al.,2005; Greicius et al.,2003]. The DMN is affected by aging [Damoiseaux et al.,2008] and disrupted in several neuropsychiatric disorders such as mild cognitive impairment [Sorg et al.,2007], Alzheimer's disease [Greicius et al.,2004], schizophrenia [Zhou et al.,2007], depression [Greicius et al.,2007], and autism [Kennedy et al.,2006].
Analysis of the DMN may offer the opportunity to differentiate between normal and pathologic conditions of the human brain, to identify subjects at risk for developing an intracortical disconnection syndrome such as Alzheimer's disease and to map effects of disease progression or treatment in longitudinal studies. These applications, however, require that the components of the DMN can accurately be reproduced within subjects across different time points. Time‐dependent changes in brain activations may arise from several causes: changes of subject's position in the B0 field and head coil, field inhomogeneities, shimming differences, image noise, stability of the magnetic field, data processing and analysis, random cognitive processes, level of arousal, and motion artifacts [Loubinoux et al.,2001]. Studies concerning reproducibility of fMRI activation are scarce. Existing studies deal mostly with reproducibility of motor functions in the context of preoperative planning.
In particular, the stability of the DMN has not yet been studied in detail. The aim of this study was to explore the reproducibility of the DMN derived from resting‐state fMRI data in healthy young subjects over different time points.
MATERIALS AND METHODS
The study was reviewed and approved by the local ethics committee. Signed informed consent was gathered from all subjects after fully explaining the design and experimental nature of the study.
Subjects
Eighteen healthy young subjects (mean age, 27.5 years; minimum, 23 years; maximum, 36 years; male‐to‐female ratio, 10:8) underwent fMRI. All subjects were right‐handed according to the Edinburgh Inventory of Handedness [Oldfield,1971] without history of neurological or psychiatric disorders, head trauma, and substance abuse. Contraindications for magnetic‐resonance imaging (e.g. pace‐maker, intracranial clips, and pregnancy) were carefully excluded prior to the experiment.
Study Design
Subjects were scanned at three imaging sessions with two experiments during each session: day one in the morning (7:00–10:00 a.m., session 1), day 1 in the evening (7:00–10:00 p.m., session 2), and after 7 days in the morning (7:00–10:00 a.m., session 3). To account for the influence of circadian rhythms, time of scanning was identical for each individual subject at sessions 1 and 3. Each session started with a resting‐state functional imaging sequence (rsEPI), followed by a high‐resolution anatomical sequence and ended with a second rsEPI sequence.
Functional MRI Experiments
All imaging was done using a clinical approved 3.0 Tesla magnetom (VERIO, Siemens, Erlangen, Germany) with a maximum gradient strength of 45 mT/m and a maximum slew rate of 200 T/m/s equipped with a 12‐element head coil. Functional imaging was done using an BOLD‐sensitive echo‐planar gradient‐echo (EPI) sequence with following imaging parameters: repetition time (TR), 3,000 ms; echo time (TE), 30 ms; flip angle (FA), 90°; spatial resolution, 3 × 3 × 4 mm3; imaging matrix, 64 × 64; field‐of‐view (FoV), 192 × 192 mm2; number of slices, 28, 120 volumes; acquisition time (TA), 6:06 min. Functional images were scanned in axial orientation and covered the whole brain. For anatomical reference, a high‐resolution magnetization‐prepared gradient‐echo sequence (MPRAGE) was performed with following specifications: FoV, 256 × 240 mm2; spatial resolution, 1 × 1 × 1 mm3; TR, 14 ms; TE, 7.61 ms; FA, 20°; number of slices, 160; TA, 4:50 min. Before starting functional imaging, field shimming was performed using automated shimming algorithms of the scanner. No manual shimming was done.
Subjects were instructed to keep their eyes closed and not to think of anything particular during the functional scans
Data Preprocessing
Imaging data were initially stored on the institution's picture archiving and communicating system and were subsequently transferred to a stand‐alone evaluation platform (WindowsXP, Microsoft, USA). Image postprocessing and statistical analysis was done using BrainVoyagerQX® 1.9 (BrainInnovations BV, Maastricht, The Netherlands).
The first five functional volumes were discarded to account for T1 saturation effects. Preprocessing included slice‐scan time correction using sinc interpolation such that all voxels in the volume represent the signal at the same time. To improve signal detection, temporal and spatial filtering was applied. To effectively remove signal drift, a rather conservative high‐pass temporal filter (5 cycles/run, 0.01389 Hz) was applied. High‐frequency fluctuations were removed by means of a 4s full‐width at half‐maximum Gaussian kernel. Spatial smoothing was done by a 4 mm full‐width at half‐maximum Gaussian filter. Because ICA detects motion, no motion‐correction algorithms were applied to minimize alterations to the data structure. To rule out excessive motion, all functional data sets were additionally processed by means of the motion correction algorithm implemented in BrainVoyagerQX® that calculates head translation (in milimetres) and rotation (in degree) for each volume in relation to the first volume in x, y, and z direction. Long‐ and short‐term motion (displacement within a run and displacement between subsequent time‐points) was calculated. Intra and intersession results were compared statistically by means of the nonparametric Friedman test.
After preprocessing, functional data were coregistered to the individual high‐resolution MPRAGE sequence using the implemented routines in BrainVoyagerQX®. In an initial alignment step, the functional and anatomical data sets were coregistered using spatial position files produced by the MR scanner for each scan. Afterwards, intensity‐driven fine adjustment was done. The results of the alignment process were inspected visually and corrected manually where necessary.
Talairach transformation of the anatomical data set was done in two steps: alignment of the sagittal data set with stereotactic axes (anterior and posterior commissure). Afterwards, the extreme points of the cerebrum were defined. Using this information, the individual three‐dimensional data set was transformed into the dimensions of the standard brain of Talairach and Tournoux [1988]. Using the transformation files produced by the latter steps, the functional data sets were also transferred to Talairach standard space.
ICA and Selection of the DMN Component
Single‐subject ICA was applied to the preprocessed functional data sets using the C++ extension of BrainVoyagerQX® [Goebel et al.,2006]. Before ICA decomposition, the initial dimension of each time‐series (i.e. 115 time points per experiment) was preliminary reduced to 30 using principal component analysis. Afterwards, 30 components were extracted by ICA for each subject. The ICA decompositions obtained from the dataset of each subject were submitted to the self‐organizing group ICA (sogICA) algorithm implemented in BrainVoyagerQX which enables automated grouping of components according to the spatial similarity of individual components [Esposito et al.,2005]. The individual component maps chosen by the sogICA algorithm were reviewed independently by two readers to verify the automated analyis. A respective component was confirmed as the DMN component when coactivations of the posterior cingulate cortex (PCC), the anterior cingulate cortex (ACC), and the inferior parietal lobule (IPL) bilaterally were found.
After choosing the respective DMN map of each rsEPI, an average DMN map was calculated for each subject and session (i.e., an average DMN map for each individual including DMN maps from rsEPI1 and rsEPI2 of each session) for calculating intersession reproducibility, as well as a group DMN map including all individuals DMN maps for each session (i.e., an average DMN map of a session including each individual's DMN map from rsEPI1 and rsEPI2) for anatomical labeling.
The average DMN maps of each session were reviewed at a threshold of z = 1.65 (P = 0.05) for anatomical labeling of coactivated areas in the Talairach coordinate system.
Approach to Reproducibility Testing
On the basis of the statistical maps, volumes‐of‐interest (VOI) encompassing coactivated brain areas constituting the DMN were generated for each subject at a conservative threshold of z = 2.33 (P = 0.001) using the VOI‐generation function implemented in BrainVoyagerQX®. Absolute number of voxels of a VOI, center‐of‐gravity (CoG) of a VOI and inter and intrasession's overlapping voxels of respective VOIs were calculated using the VOI‐functions of BrainVoyagerQX® (Fig. 1).
Figure 1.
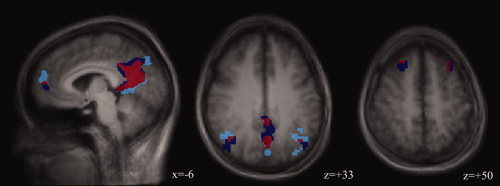
Calculation of R size and R overlap. The figure shows the extent of the DMN regions in two rsEPIs (rsEPI1, light blue; rsEPI2, dark blue). Overlapping voxels are marked in red.
Reproducibility was measured following the approach proposed by Rombouts et al. [1997, 1998]. The following calculations were done for a pair of rsEPIs and pair of sessions each (i.e., for intersession reproducibility, session 1 vs. session 2, session 1 vs. session 3, session 2 vs. session3, and for intrasession reproducibility, individual's rsEPI1 vs. rsEPI2 of each session, respectively).
The reproducibility of the size of an coactivation cluster (R size) was calculated using following formula:
where V smallest is the smallest of two clusters V1 and V2 which represent the cluster size (number of coactivated voxels) of the first scan or session and second scan or session, respectively.
Next, the size of the area coactivated consistently in two rsEPIS/sessions (V
overlap) was determined and the reproducibility of voxels coactivated in each rsEPI/session (R
overlap) was calculated:

The reproducibility ratios may vary between 1.0 (perfect reproducibility) and 0.0 (no reproducibility).
To test for spatial consistency of the DMN components within a subject (intrasubject) and within the imaging sessions (intersubject), the spatial shift between the CoG of the DMN regions of each individual map and the mean CoG of all subjects in a respective session was calculated. Spatial variability in the location of a DMN region was calculated by the coefficient of variation, defined as the ratio between standard deviation and mean.
For further evaluation of reproducibility, the number of voxels within a respective VOI (spatial extent of the coactivation) was compared between rsEPIs and between sessions.
Statistical analysis of the results was done using the nonparametric Friedman test (SPSS for Windows, Rel. 10.0, SPSS Inc., Chicago, USA).
Quantitative Data Evaluation
To exclude variations in MR signal between the different experiments, signal‐to‐noise calculations for each subject's functional volumes were done. Signal‐to‐noise ratios (SNR) were evaluated by means of a dual‐acquisition method [Dietrich et al.,2007]. Subsequently acquired MR volumes were used to generate mean and subtraction images. The SNR ratio was calculated using following formula: SNR =  , with SImean taken as signal intensity of a region‐of‐interest (ROI) over the mean image, and SD =
  taken as the standard deviation of the signal intensity of the identical ROI on the subtraction image. The factor
  results from noise propagation due to subtraction. Measurements were performed using an interactive postprocessing work station (SYNGO LEONARDO VD3A, Siemens, Erlangen, Germany). Within a volume, the circular ROIs were placed at different slice positions (fronto‐parietal, corresponding to a Talairach coordinate of approximately z = +45, 870 pixel, diameter 78 mm2, temporo‐parietal, approximately corresponding to z = +20, 1160 pixel, diameter 105 mm2 and at the height of the third ventricle, approximately z = 0, 930 pixel, diameter 84 mm2). Within a time‐series data set (i.e., a rsEPI scan, 120 volumes), the average and subtraction images were generated using the 25th and 26th volume, the 50th and 51st volume, the 75th and 76th volume, and the 100th and 101st volume, respectively. The copy and paste function of the work station was used to guarantee exact correspondence of the ROIs. Signal‐to‐noise ratio was calculated for each subject's data sets and subsequently compared (intra‐session SNRrsEPI1/rsEPI2 comparison) by t‐testing. Subsequently, mean SNR value of each session was calculated and SNR of the different session was compared also by means of t‐testing (intersession SNR comparison).
RESULTS
Subjects
At all three sessions, experiments were technically successful. However, one of the subjects missed the scanning session at day 2. Therefore, session 3 consisted of only 17 subjects. As expected, all subjects tolerated the MR scans well.
The functional data sets showed no major motion artifacts. Mean long‐term motion across all subjects and sessions was 0.13 mm (range, 0.00–0.47 mm; SD, 0.07 mm), 0.28 mm (range, 0.00–0.56 mm; SD, 0.13 mm), and 0.25 mm (range, 0.00–0.65 mm; SD, 0.15 mm) in x, y, and z direction, respectively. The mean rotation was 0.29° (range, 0.00°–0.86°; SD, 0.18°), 0.18° (range, 0.00°–0.61°; SD, 0.10°), and 0.15° (range, 0.00°–0.83°; SD, 0.11°), respectively. Mean short‐term motion was 0.07 mm (range, 0.00–0.22 mm; SD, 0.07 mm), 0.09 mm (range, 0.00–0.37 mm; SD, 0.09 mm), and 0.17 mm (range, 0.00–0.53 mm; SD, 0.18 mm), and mean rotation was 0.21° (range, 0.00°–0.71°; SD, 0.21°), 0.06° (range, 0.00°–0.41°; SD, 0.05°), and 0.11° (range, 0.00°–0.41°; SD, 0.10°) in x, y, and z direction, respectively. There were no statistically significant differences in long‐ and short‐term head motion between the sessions (0.18 < P < 0.91). There were also no significant differences in long‐ and short‐term motion between rsEPI1 and rsEPI2 (0.11 < P < 0.98). Also the anatomical sequence was without any constraints due to motion.
All functional and anatomical data sets were used for further evaluation.
Identification of Resting‐State Network Components
The entire set of brain areas that constitue the DMN was always located within a single extracted component. There was no evidence for distraction of the DMN network into two components by “overdecomposition” of the data. There was no disagreement between the two readers. Anatomically, the DMN consisted of coactivation of mid‐line brain areas including the PCC extending into the cuneus/precuneus, the ACC extending in the orbito‐frontal and medial frontal gyrus. Nearly symmetrical bilateral coactivations were found in the IPL and the superior frontal gyrus (SFG). The hippocampus (HC) was found to be inconsistently coactivated across individuals. On a group level, HC coactivation did not survive thresholding in either session at z = 1.65. coactivated clusters, cluster size, and Talairach coordinates for the center‐of‐gravity are given in Table I and Figure 2.
Table I.
Talairach coordinates of DMN components of session 1–3 (given in mm) and mean cluster size of the coactivated regions (number of voxels)
| Brain region | BA | Session 1 | Cluster size | Session 2 | Cluster size | Session 3 | Cluster size | ||||||
|---|---|---|---|---|---|---|---|---|---|---|---|---|---|
| x | y | z | x | y | z | x | y | z | |||||
| ACC | 10/32 | −2 | 49 | 15 | 5,532 | 0 | 48 | 13 | 5,305 | −2 | 49 | 14 | 6,275 |
| PCC | 31/7 | −2 | −55 | 23 | 10,559 | −3 | −56 | 24 | 11,907 | −2 | −53 | 24 | 11,111 |
| IPL right | 39/40 | 43 | −61 | 25 | 1,811 | 42 | −62 | 25 | 2,168 | 45 | −58 | 27 | 2,579 |
| IPL left | 39/40 | −39 | −67 | 26 | 2,673 | −43 | −66 | 26 | 2,655 | −41 | −65 | 26 | 3,670 |
| SFG right | 8 | 20 | 28 | 49 | 495 | 22 | 34 | 44 | 264 | 22 | 31 | 45 | 301 |
| SFG left | 8 | −20 | 29 | 49 | 398 | −23 | 31 | 46 | 305 | −24 | 29 | 46 | 232 |
Voxel interpolated from 3.0 mm × 3.0 mm × 4.0 mm to 1.0 mm × 1.0 mm × 1.0 mm; BA, Brodmann area; ACC, anterior cingulate cortex; PCC, posterior cingulate cortex; IPL, inferior parietal lobule; SFG, superior frontal gyrus.
Figure 2.
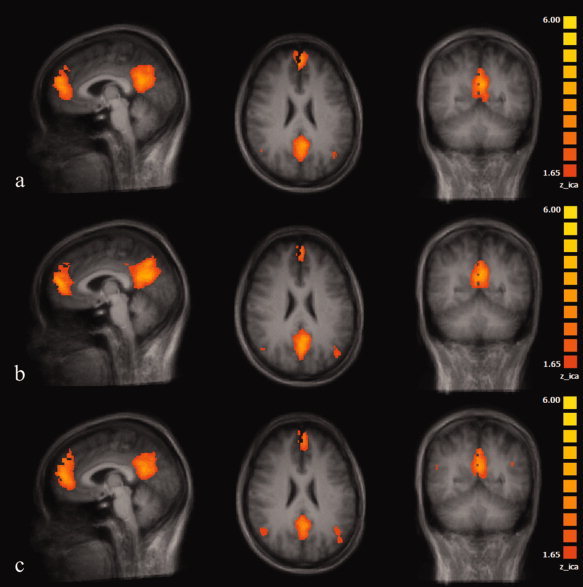
Coactivated areas contributing to the DMN of the brain averaged over subjects in session 1 (a), session 2 (b), and session 3 (c). (averaged anatomical data set, Talairach coordinates, x = −4, y = −53, z = 24).
Intersession Reproducibility
Throughout all sessions, the PCC showed the largest number of coactivated voxels followed by the ACC and IPC. There were no statistically significant differences between the areas concerning the number of voxels between the sessions (0.23 < P < 0.63). Reproducibility of size was comparable for the ACC, PCC, and IPL with R size between 0.60 and 0.77. The SFG coactivation cluster showed a lower reproducibility in size between 0.11 and 0.25. The mean reproducibility of overlapping voxels ranged from 0.08 to 0.76 between sessions. Nonparametric testing showed no significant differences in R size and R overlap between the sessions (0.16 < P < 0.93 and 0.13 < P < 0.93) (Table II, Fig. 3).
Table II.
Intersession reproducibility of coactivated DMN regions concerning size of a region (R size) and number of overlapping voxels (R overlap)
| Brain region | Intersession R size | Intersession R overlap | ||||
|---|---|---|---|---|---|---|
| 1 vs. 2 | 1 vs. 3 | 2 vs. 3 | 1 vs. 2 | 1 vs. 3 | 2 vs. 3 | |
| ACC | 0.77 | 0.75 | 0.68 | 0.52 | 0.76 | 0.48 |
| PCC | 0.74 | 0.76 | 0.67 | 0.49 | 0.59 | 0.43 |
| IPL right | 0.62 | 0.67 | 0.58 | 0.39 | 0.42 | 0.40 |
| IPL left | 0.52 | 0.60 | 0.60 | 0.29 | 0.35 | 0.46 |
| SFG right | 0.25 | 0.23 | 0.11 | 0.16 | 0.14 | 0.07 |
| SFG left | 0.17 | 0.21 | 0.13 | 0.12 | 0.08 | 0.08 |
ACC, anterior cingulate cortex; PCC, posterior cingulate cortex; IPL, inferior parietal lobule; SFG, superior frontal gyrus.
Figure 3.
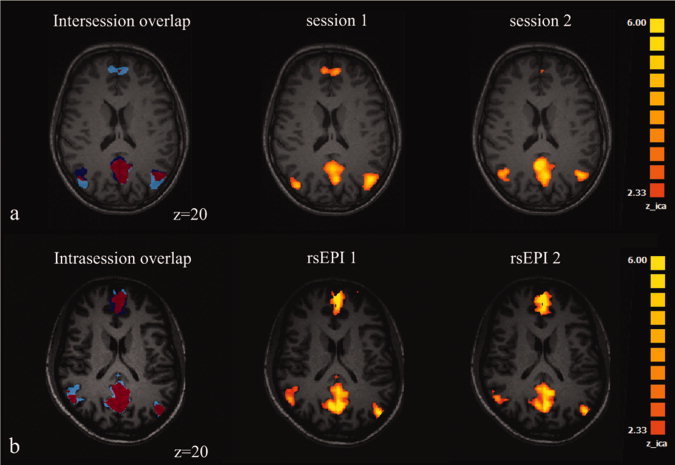
Examples for intersession (a) and intrasession (b) overlap in two subjects. In (a), the R size for the ACC and PCC were 0.94 and 0.96, respectively. The PCC showed a reasonable R overlap of 0.65, the ACC revealed a R overlap of only 0.09. In (b), the ACC and PCC show an R size of 0.79 and 0.92, respectively, and a R overlap of 0.71 and 0.82, respectively.
Intrasession Reproducibility
There were no significant differences between number of coactivated voxels comparing rsEPI1 and rsEPI 2 in each of the sessions (0.23 < P < 0.69). Mean reproducibility of size ranged from 0.40 to 0.86. Mean reproducibility concerning overlapping voxels ranged from 0.10 to 0.56 between rsEPIs. There were no statistically significant differences in intrasession reproducibility of size and overlapping voxels between the sessions (0.080 < P < 0.83) (Table III, Fig. 3).
Table III.
Intrasession reproducibility of R size and R overlap
| Brain region | Intrasession R size | Intrasession R overlap | ||||
|---|---|---|---|---|---|---|
| Sess. 1 | Sess. 2 | Sess. 3 | Sess. 1 | Sess. 2 | Sess. 3 | |
| ACC | 0.77 | 0.55 | 0.79 | 0.45 | 0.30 | 0.44 |
| PCC | 0.78 | 0.86 | 0.79 | 0.54 | 0.55 | 0.56 |
| IPL right | 0.54 | 0.61 | 0.54 | 0.33 | 0.27 | 0.34 |
| IPL left | 0.55 | 0.53 | 0.62 | 0.35 | 0.31 | 0.42 |
| SFG right | 0.42 | 0.44 | 0.44 | 0.24 | 0.10 | 0.30 |
| SFG left | 0.51 | 0.79 | 0.40 | 0.30 | 0.36 | 0.18 |
ACC, anterior cingulate cortex; PCC, posterior cingulate cortex; IPL, inferior parietal lobule; SFG, superior frontal gyrus.
Spatial Consistency of DMN Clusters
Table IV shows the mean shift of the CoG and coefficient of variance within the subjects and within the sessions. The shift was neither statistically significant different within subjects rsEPI 1 and rsEPI2 (0.27 < P < 0.61) nor between the sessions (0.22 < P < 0.91). The intersubject shifts were not bigger than the intrasubject ones.
Table IV.
Intrasubject and intersubject shift of the center‐of‐gravity of the coactivated areas
| Brain region | Intrasubject | Intersubject | ||||||||||
|---|---|---|---|---|---|---|---|---|---|---|---|---|
| Session 1 | Session 2 | Session 3 | Session 1 | Session 2 | Session 3 | |||||||
| Shift | CoV | Shift | CoV | Shift | CoV | Shift | CoV | Shift | CoV | Shift | CoV | |
| ACC | 6.21 | 0.55 | 7.92 | 0.66 | 8.52 | 0.38 | 4.74 | 0.63 | 5.97 | 0.38 | 6.13 | 0.75 |
| PCC | 7.90 | 0.69 | 7.31 | 0.41 | 7.01 | 0.43 | 6.96 | 0.48 | 4.73 | 0.43 | 7.38 | 0.41 |
| IPL right | 9.79 | 0.42 | 10.06 | 0.20 | 10.23 | 0.02 | 9.06 | 0.57 | 8.03 | 0.39 | 10.39 | 0.60 |
| IPL left | 9.45 | 0.52 | 10.95 | 0.47 | 9.22 | 0.63 | 8.81 | 0.49 | 5.65 | 0.45 | 9.31 | 0.64 |
| SFG right | 10.29 | 0.64 | 9.24 | 0.64 | 9.07 | 0.3 | 9.24 | 0.57 | 8.03 | 0.30 | 8.74 | 0.49 |
| SFG left | 9.75 | 0.89 | 7.36 | 0.52 | 8.47 | 0.54 | 8.84 | 0.51 | 6.49 | 0.54 | 8.29 | 0.36 |
Shift is given in mm. CoV, coefficient of variance; ACC, anterior cingulate cortex; PCC, posterior cingulate cortex; IPL, inferior parietal lobule; SFG, superior frontal gyrus.
Signal‐to‐Noise
Averaged over the four brain regions and four time points of measurement mean SNR of all subject's data sets was 185.6 (SD, 13.2) for session 1, 173.3 (SD, 14.9) for session 2, and 180.7 (SD, 12.6) for session 3, respectively. T‐testing revealed no significant differences of SNR between the sessions (0.32 < P < 0.58). Intrasession SNR did also not vary significantly (0.38 < P < 0.85).
DISCUSSION
The aim of this study was to asses the degree of reproducibility of coactivation patterns of the DMN in resting state fMRI.
Several hypotheses on the role of this network have been proposed. It was hypothesized that the DMN plays a critical role in attending to internally and externally generated stimuli [Raichle et al.,2001], reviewing the past and plan future action [Greicius et al.,2003]. Its role during stimulus independent thoughts (mind wandering) has been shown [Mason et al.,2007].
In our study, ICA revealed in all three imaging sessions the essential parts of the default mode network, namely the anterior and PCC, the IPL bilaterally, and the frontal gyrus in both brain hemispheres. These results resemble and further validate findings of imaging studies reported in literature [Damoiseaux et al.,2006; Greicius et al.,2003; Raichle et al.,2001].
The most reliably reproducible DMN network components concerning size and overlap within and between sessions were found to be the posterior and ACC. This finding agrees with the prominent role of these brain areas in the DMN. The PCC appears to be the most critical node in the DMN network. It is supposed to be involved in ongoing mental activity during rest and retrieval of past events [Greicius et al.,2003]. Raichle et al. [2001] describe the PCC as region of the brain which continuously gathers and processes external information. It is one of the earliest brain regions to show reduced metabolism in Alzheimer's disease [Greicius et al.,2004]. In agreement with our results, Damoiseaux et al. [2006] found the PCC to be coactivated with less variation compared to the anterior parts of the DMN particularly the ACC by comparing coactivation patterns of two sessions with an average intersession interval of 8.7 days on a 1.5T MR system. Different to our study, they did not control for potential circadian rhythms and did not assess within session variation.
The results of this study show a reasonable spatial consistency of the DMN areas within a session as well as between the sessions. Remarkably, the spatial consistency between the sessions was not different to that within a session. Using a sensorimotor task, Loubinoux et al. [2001] also found that the intersession spatial shift was not bigger than the intrasession one. Given the low resolution of the functional images, the spatial shift could be attributed partly to the manual alignment process to Talairach space. Using a cortical alignment approach, the spatial consistency likely could be improved further [Goebel et al.,2006].
Contribution of the IPL, SFG, and HC to the DMN coactivation pattern found in our study may represent memory related processes and ongoing cognitive operations. The HC and structures of the medial temporal lobe are known to be the essential structures involved in memory [Squire et al.,2004]. However, the HC was infrequently coactivated. Greicius et al. [2004] detected significant bilateral hippocampal/entorhinal cortex coactivation in a resting‐state MR study at 1.5T. In an preceding study at 3.0T field strength, the same group was not able to detect coactivation of these brain areas [Greicius et al.,2003]. The authors attribute this disconcordance to the properties of different field strength with 3.0T producing more artifacts in the respective regions, hereby loosing coactivations. In our study, coactivation of structures of the HC did not reach statistical significance in group analysis. However, considering coactivation pattern analysis on a first‐level basis, i.e., single subject analysis, we found these structures coactivated to different degrees within the subjects. This finding may reflect a behavioral component of the network depending on the ability of the individual to more or less decrease mental activation and cognitive processes within the respective experimental session.
The results of this study have further implications for using the method of resting‐state functional MR imaging for the distinction between healthy and demented subjects as proposed by Greicius et al. [2004]. This group determined the goodness‐of‐fit of a subject's DMN to a standard DMN template and could hereby differentiate between healthy elderly subjects and subjects with AD with high accuracy. The presence of DMN areas in all sessions in young healthy subjects supports the goodness‐of‐fit approach.
This finding is also of interest in the light of the possibility to use resting‐state EPI to monitor the efficiency of medical or behavioral therapy in various psychiatric disorders. This study deals with young healthy individuals. Caution has to be taken when data obtained from patients are analyzed. Especially before applying the technique to elderly subjects in studies concerning dementia, a sufficiently large cohort of nondemented healthy elderly subject has to be examined to produce a reliable template. The feasibility of a DMN brain region as a potential outcome measure in treatment studies needs to be tested subsequently by statistical power analyses [Alexander et al.,2002].
Processing of fMRI data before statistical analysis is commonly used to optimize signal and to improve matching of activated areas between subjects. However, in the context of ICA algorithms the applied processing steps merit discussion. ICA detects gradual and sudden displacements of the head without preliminary corrections for the subjects' head motion [McKeown et al.,1998]. To assess the degree of motion, we applied a motion correction algorithm to all of our data sets and found that maximum head movements were in the range of less than 1 mm in magnitude. Therefore, we decided to go on further without motion correction to minimize alterations of the data structure which could be highly different across subjects because of different motion. Because of examination of young and fully motivated volunteers, short scanning time and careful head fixation displacements were low. However, when investigating elderly or diseased subjects, application of motion correction algorithms may be inevitable. We applied a conservative high‐pass filter to the data to remove low‐frequency signal drifts that may result from instabilities of the magnetic field and gradients. Aggressive high‐pass filtering could decrease the power of detecting resting‐state networks. However, in the context of reproducibility, this may be of minor concern because all data sets were treated with the same filter. Next, we used a conservative 4 mm FWHM spatial filter to remove small artifacts and to increase signal‐to‐noise. Rombouts et al. [1998] showed that higher filter sizes can increase the number of overlapping voxels (i.e. R overlap) while leaving the reproducibility of cluster size (i.e. R size) constant. Therefore, overlap and spatial consistency in this study could likely be improved by increasing filter width. They also showed that best reproducibility could be found by adjusting the statistical threshold at which coactivations were identified as true positive individually, not too low to avoid artificial coactivations and not too high to miss coactivations [Rombouts et al.,1998]. Another approach could be the usage of nonthresholded images for analysis. This may lead to improvements in the reproducibility of individual data sets in a potential clinical setting, where changes in the pattern and extent of a single subjects' DMN are used for monitoring progression of diseases.
Further methodological investigation is needed to exactly clarify the impact of data processing steps prior to purely data‐driven statistical approaches.
It could be shown that short‐term variations (i.e. within a scanning session) and long‐term variations (i.e. between scanning sessions) did not vary substantially. These results suggest that potential physiological changes within a subject between the sessions do not contribute substantially to reproducibility. Also variations of the hardware could be shown to be of minor influence between sessions at least in terms of SNR.
The degree of reproducibility which is necessary and acceptable is subject to discussion. Rombouts et al. [1998] raise the question if a reproducibility of 50% is acceptable or if 95% need to be reached. They had shown good agreement of activations between sessions using visual stimulation with a reproducibility of size of more than 80% and a reproducibility of overlap of about 30 to about 70% [Rombouts et al.,1997, 1998). Havel et al. [2006] showed good reproducibility of activations in primary motor‐sensory areas with “hand” and “foot” movements with a reliability coefficient in the range of 0.62–0.78 and poor reproducibility for mouth movements. A study dealing with sensory‐motor and parietal resting‐state coactivation found a high consistency in spatial distribution and frequency contribution within a subject [van de Ven et al.,2004]. Concerning the ACC, PCC, and IPL, reproducibility values are in the range of the latter studies. This is of interest because one could argue that the DMN may be more easily modulated by the degree of ongoing cognitive activity, arousal, or vigilance state than the activation of a motor or visual area. The SFG showed a considerable lower reproducibility because it was not coactivated consistently throughout subjects and sessions.
In conclusion, we showed that the pattern of coactivated brain regions forming the DMN can be reproducibly depicted by resting‐state EPI experiments. The degree of reproducibility is in the range of that observed in studies with motor and visual tasks. The results of this study should be taken into account when using this promising method as diagnostic and follow‐up tool in neuropsychiatric disorders.
REFERENCES
- Alexander GE, Chen K, Pietrini P, Rapoport SI, Reiman EM ( 2002): Longitudinal PET evaluation of cerebral metabolic decline in dementia: A potential outcome measure in Alzheimer's disease treatment studies. Am J Psychiatry 159: 738–745. [DOI] [PubMed] [Google Scholar]
- Biswal B, Yetkin FZ, Haughton VM, Hyde JS ( 1995): Functional connectivity in the motor cortex of resting human brain using echo‐planar MRI. Magn Reson Med 34: 537–541. [DOI] [PubMed] [Google Scholar]
- Cordes D, Haughton VM, Arfanakis K, Wendt GJ, Turski PA, Moritz CH, Quigley MA, Meyerand ME ( 2000): Mapping functionally related regions of brain with functional connectivity MR imaging. Am J Neuroradiol 21: 1636–1644. [PMC free article] [PubMed] [Google Scholar]
- Cordes D, Haughton VM, Arfanakis K, Carew JD, Turski PA, Moritz CH, Quigley MA, Meyerand ME ( 2001): Frequencies contributing to functional connectivity in the cerebral cortex in “resting‐state” data. Am J Neuroradiol 22: 1326–1333. [PMC free article] [PubMed] [Google Scholar]
- D'Argembeau A, Collette F, Van der Linden M, Laureys S, Del Fiore G, Degueldre C, Luxen A, Salmon E ( 2005): Self‐referential reflective activity and its relationship with rest: A PET study. Neuroimage 25: 616–624. [DOI] [PubMed] [Google Scholar]
- Damoiseaux JS, Rombouts SA, Barkhof F, Scheltens P, Stam CJ, Smith SM, Beckmann CF ( 2006): Consistent resting‐state networks across healthy subjects. Proc Natl Acad Sci USA 103: 13848–13853. [DOI] [PMC free article] [PubMed] [Google Scholar]
- Damoiseaux JS, Beckmann CF, Arigita EJ, Barkhof F, Scheltens P, Stam CJ, Smith SM, Rombouts SA ( 2008): Reduced resting‐state brain activity in the “default network” in normal aging. Cereb Cortex 18: 1856–1864. [DOI] [PubMed] [Google Scholar]
- Dietrich O, Raya JG, Reeder SB, Reiser MF, Schoenberg SO ( 2007): Measurement of signal‐to‐noise ratios in MR images: Influence of multichannel coils, parallel imaging, and reconstruction filters. J Magn Reson Imaging 26: 375–385. [DOI] [PubMed] [Google Scholar]
- Esposito F, Scarabino T, Hyvarinen A, Himberg J, Formisano E, Comani S, Tedeschi G, Goebel R, Seifritz E, Di Salle F ( 2005): Independent component analysis of fMRI group studies by self‐organizing clustering. Neuroimage 25: 193–205. [DOI] [PubMed] [Google Scholar]
- Fox MD, Snyder AZ, Vincent JL, Corbetta M, Van Essen DC, Raichle ME ( 2005): The human brain is intrinsically organized into dynamic, anticorrelated functional networks. Proc Natl Acad Sci USA 102: 9673–9678. [DOI] [PMC free article] [PubMed] [Google Scholar]
- Goebel R, Esposito F, Formisano E ( 2006): Analysis of functional image analysis contest (FIAC) data with brainvoyager QX: From single‐subject to cortically aligned group general linear model analysis and self‐organizing group independent component analysis. Hum Brain Mapp 27: 392–401. [DOI] [PMC free article] [PubMed] [Google Scholar]
- Goldman RI, Stern JM, Engel J Jr, Cohen MS ( 2002): Simultaneous EEG and fMRI of the alpha rhythm. Neuroreport 13: 2487–2492. [DOI] [PMC free article] [PubMed] [Google Scholar]
- Greicius MD, Krasnow B, Reiss AL, Menon V ( 2003): Functional connectivity in the resting brain: A network analysis of the default mode hypothesis. Proc Natl Acad Sci USA 100: 253–258. [DOI] [PMC free article] [PubMed] [Google Scholar]
- Greicius MD, Srivastava G, Reiss AL, Menon V ( 2004): Default‐mode network activity distinguishes Alzheimer's disease from healthy aging: Evidence from functional MRI. Proc Natl Acad Sci USA 101: 4637–4442. [DOI] [PMC free article] [PubMed] [Google Scholar]
- Greicius MD, Flores BH, Menon V, Glover GH, Solvason HB, Kenna H, Reiss AL, Schatzberg AF ( 2007): Resting‐state functional connectivity in major depression: Abnormally increased contributions from subgenual cingulate cortex and thalamus. Biol Psychiatry 62: 429–437. [DOI] [PMC free article] [PubMed] [Google Scholar]
- Havel P, Braun B, Rau S, Tonn JC, Fesl G, Bruckmann H, Ilmberger J ( 2006): Reproducibility of activation in four motor paradigms: An fMRI study. J Neurol 253: 471–476. [DOI] [PubMed] [Google Scholar]
- Kennedy DP, Redcay E, Courchesne E ( 2006): Failing to deactivate: resting functional abnormalities in autism. Proc Natl Acad Sci USA 103: 8275–8280. [DOI] [PMC free article] [PubMed] [Google Scholar]
- Laufs H, Kleinschmidt A, Beyerle A, Eger E, Salek‐Haddadi A, Preibisch C, Krakow K ( 2003): EEG‐correlated fMRI of human alpha activity. Neuroimage 19: 1463–1476. [DOI] [PubMed] [Google Scholar]
- Loubinoux I, Carel C, Alary F, Boulanouar K, Viallard G, Manelfe C, Rascol O, Celsis P, Chollet F ( 2001): Within‐session and between‐session reproducibility of cerebral sensorimotor activation: A test‐‐retest effect evidenced with functional magnetic resonance imaging. J Cereb Blood Flow Metab 21: 592–607. [DOI] [PubMed] [Google Scholar]
- Mantini D, Perrucci MG, Del Gratta C, Romani GL, Corbetta M ( 2007): Electrophysiological signatures of resting state networks in the human brain. Proc Natl Acad Sci USA 104: 13170–13175. [DOI] [PMC free article] [PubMed] [Google Scholar]
- Mason MF, Norton MI, Van Horn JD, Wegner DM, Grafton ST, Macrae CN ( 2007): Wandering minds: The default network and stimulus‐independent thought. Science 315: 393–395. [DOI] [PMC free article] [PubMed] [Google Scholar]
- McKeown MJ, Sejnowski TJ ( 1998): Independent component analysis of fMRI data: Examining the assumptions. Hum Brain Mapp 6: 368–372. [DOI] [PMC free article] [PubMed] [Google Scholar]
- McKeown MJ, Makeig S, Brown GG, Jung TP, Kindermann SS, Bell AJ, Sejnowski TJ ( 1998): Analysis of fMRI data by blind separation into independent spatial components. Hum Brain Mapp 6: 160–188. [DOI] [PMC free article] [PubMed] [Google Scholar]
- Oldfield RC ( 1971): The assessment and analysis of handedness: The Edinburgh inventory. Neuropsychologia 9: 97–113. [DOI] [PubMed] [Google Scholar]
- Raichle ME, MacLeod AM, Snyder AZ, Powers WJ, Gusnard DA, Shulman GL ( 2001): A default mode of brain function. Proc Natl Acad Sci USA 98: 676–682. [DOI] [PMC free article] [PubMed] [Google Scholar]
- Rombouts SA, Barkhof F, Hoogenraad FG, Sprenger M, Valk J, Scheltens P ( 1997): Test‐retest analysis with functional MR of the activated area in the human visual cortex. Am J Neuroradiol 18: 1317–1322. [PMC free article] [PubMed] [Google Scholar]
- Rombouts SA, Barkhof F, Hoogenraad FG, Sprenger M, Scheltens P ( 1998): Within‐subject reproducibility of visual activation patterns with functional magnetic resonance imaging using multislice echo planar imaging. Magn Reson Imaging 16: 105–113. [DOI] [PubMed] [Google Scholar]
- Sorg C, Riedl V, Mühlau M, Calhoun VD, Eichele T, Läer L, Drzezga A, Förstl H, Kurz A, Zimmer C, Wohlschläger AM ( 2007): Selective changes of resting‐state networks in individuals at risk for Alzheimer's disease. Proc Natl Acad Sci U S A 104: 18760–18765. [DOI] [PMC free article] [PubMed] [Google Scholar]
- Squire LR, Stark CE, Clark RE ( 2004): The medial temporal lobe. Annu Rev Neurosci 27: 279–306. [DOI] [PubMed] [Google Scholar]
- Talairach J, Tournoux P ( 1988): Co‐Planar Stereotaxic Atlas of the Human Brain. New York: Thieme. [Google Scholar]
- Tucker DM, Roth DL, Bair TB ( 1986): Functional connections among cortical regions: Topography of EEG coherence. Electroencephalogr Clin Neurophysiol 63: 242–250. [DOI] [PubMed] [Google Scholar]
- Tyler JL, Strother SC, Zatorre RJ, Alivisatos B, Worsley KJ, Diksic M, Yamamoto YL ( 1988): Stability of regional cerebral glucose metabolism in the normal brain measured by positron emission tomography. J Nucl Med 29: 631–642. [PubMed] [Google Scholar]
- van de Ven VG, Formisano E, Prvulovic D, Roeder CH, Linden DE ( 2004): Functional connectivity as revealed by spatial independent component analysis of fMRI measurements during rest. Hum Brain Mapp 22: 165–178. [DOI] [PMC free article] [PubMed] [Google Scholar]
- Zhou Y, Liang M, Jiang T, Tian L, Liu Y, Liu Z, Liu H, Kuang F ( 2007): Functional dysconnectivity of the dorsolateral prefrontal cortex in first‐episode schizophrenia using resting‐state fMRI. Neurosci Lett 417: 297–302. [DOI] [PubMed] [Google Scholar]