

Abstract
Animal and functional imaging studies had identified cortical structures such as the parieto‐insular vestibular cortex, the retro‐insular cortex, or the anterior cingulate cortex belonging to a vestibular cortical network. Basic animal studies revealed that endorphins might be important transmitters involved in cerebral vestibular processing. The aim of the present study was therefore to analyse whether the opioid system is involved in vestibular neurotransmission of humans or not. Changes in opioid receptor availability during caloric air stimulation of the right ear were studied with [18F] Fluoroethyl‐diprenorphine ([18F]FEDPN) PET scans in 10 right‐handed healthy volunteers and compared to a control condition. Decrease in receptor availability to [18F]FEDPN during vestibular stimulation in comparison to the control condition was significant at the right posterior insular cortex and the postcentral region indicating more endogenous opioidergic binding in these regions during stimulation. These data give evidence that the opioidergic system plays a role in the right hemispheric dominance of the vestibular cortical system in right‐handers. Hum Brain Mapp, 2010. © 2009 Wiley‐Liss, Inc.
Keywords: diprenorphine PET, vestibular system, autonomic system, opioid system
INTRODUCTION
The mechanisms of neurotransmission in humans during vestibular processing in cortical areas such as for e.g., the insular cortex, the precentral gyrus, or the anterior cingulate [for review see Dieterich and Brandt, 2008] are still unknown. Thus, the question arises that which type of neurotransmission takes place in these cortical structures due to vestibular processing? During the past years a detailed account of the anatomical and physiological basis of the neurotransmission and modulations of the peripheral and central vestibular system has been explored in animals [Smith, 2000]. Based on experiments in rats it was shown that opioidergic neuronal activation is involved in the vestibulo‐ocular reflex (VOR) [Sulaiman et al., 1999]. Nociceptin injection into medial vestibular nucleus neurons caused a decrease in the gain of the VOR and resulted in a prolongation of postrotatory nystagmus. However, evidence that the opioidergic system plays a relevant role for transmission and modulation of vestibular processing in humans is still lacking. Thus, aim of the present study was to analyze whether changes of opioidergic neurotransmission can be induced by vestibular stimulation (i.e., caloric irrigation) by use of the nonselective opioid receptor ligand [18F] fluoroethyl‐diprenorphine ([18F]FEDPN).
METHODS
This study was carried out in accordance with the Helsinki Declaration and was approved by the local ethics committee and the German radiation protection authorities (BfS). Informed written consent was obtained from each subject.
Subjects
Ten right‐handed healthy male volunteers (mean age 26 years, SD 3.9 years) were included in this study and paid for participation. The laterality quotient for handedness according to the 10‐item inventory of the Edinburgh test was +100 in all 10 subjects, i.e., all subjects were strongly right‐handed [Oldfield, 1971; Salmaso and Longoni, 1985]. The subjects had neither current nor previous history of relevant vestibular disorders and were not regularly taking medication, in particular, not opioids. Before each test the acoustic meatus was examined using an otoscope to avoid an impairment of the vestibular caloric stimulation by cerumen.
Experimental Setup
Each subject underwent two PET sessions (control (sham) and stimulation session) in a randomized order on two different days. The overall duration of each session was 90 min. During both sessions the subjects rested with eyes closed in a supine slightly elevated position to achieve optimum stimulation of the horizontal semicircular canal. In the stimulation session vestibular stimulation was performed by caloric irrigating at the right ear with air via an air tube that was placed in the right acoustic meatus. To avoid habituation, warm (44°C) and cold irrigation (30°C) was alternated every 5 min (stimulation device Homoth®, Hamburg, Germany). During the control (sham) session the subjects lay in the same position as during the stimulation session and the air tube was fixed at the right ear such that the airflow passed beside the ear.
Each session, i.e., control and stimulation session, started with a prestimulation period of 30 min in which the tracer [18F]FEDPN was injected (Phase 1). This period included a transmission scan to correct radiation attenuation of tissues of different densities. After this prestimulation period the stimulation period respectively the sham period started (Phase 2). The net duration of stimulation period with the caloric irrigation respectively the control (sham) condition was 30 min. During this Phase 2 subjects were asked every 5 min to make judgments regarding a feeling of dizziness/vertigo on a verbal rating scale (VRS) (0 = no dizziness/vertigo to 10 maximum imaginable dizziness/vertigo). Follow‐up period was also 30 min (Phase 3). To control autonomic responses, which might be part of the bodily vertigo reaction, blood pressure (systolic and diastolic) and heart rate were continuously recorded every minute during Phase 2 (stimulation and sham period). The blood pressure and heart rate were recorded with a Finometer® and processed with a dedicated software package (Finapres Medical Systems, Amsterdam, Netherland).
Radiochemistry and Data Acquisition
[18F]FEDPN was synthesized by applying the secondary labeling precursor 2‐18F‐fluoroethyltosylate to 3‐O‐trityl‐6‐O‐desmethyl‐diprenorphine [Wester et al., 2000]. The 2‐18F‐fluoroethyltosylate was synthesized as described elsewhere [Schreckenberger et al., 2008; Wängler et al., 2004].
PET Scanning
Images were acquired on a whole‐body PET scanner in 3D‐mode (ECAT EXACT; Siemens). The camera had a field of view of 16.2 cm in 47 planes, with a plane spacing of 3.375 mm, an axial resolution of 6.0‐mm full width at half maximum, and an in‐plane resolution of 6.0 mm (resolution at center with scanner in three‐dimensional mode) [Wienhard et al., 1992]. Data acquisition comprised a series of 30 time frames. The frame duration increased progressively from 20 s to 10 min, resulting in a total scanning time of 90 min. A 15‐min transmission scan using a 68Ge source was performed before each study for subsequent attenuation correction. A mean of 150 MBq (±30 MBq) of [18F]FEDPN was injected intravenously as a bolus into a cubital vein over ∼30 s. The specific activity at the time of injection was greater than 0.5 GBq/mmol. Images were reconstructed with filtered backprojection using a ramp filter and a Hanning filter (filter width, 7.3 mm). Frame by‐frame motion correction was applied by matching cortical isointensity contour points. A mean occipital time‐activity curve was generated by drawing regions of interest (ROIs) on three subsequent transaxial slices. Binding potentials (BPs) of volumes of interest were calculated using the noninvasive Logan Plot [Logan et al., 1996] as described previously [Schreckenberger et al., 2008]. The occipital cortex was chosen as a reference region because it is generally considered of very low opioid receptor density [Sadzot et al., 1991].
Data Analysis
PET images were spatially normalized with a standard H2O PET template implemented in SPM5 (Wellcome Department of Cognitive Neurology, London, UK, http://www.fil.ion.ucl.ac.uk/spm). The normalized BP images were smoothed with a three‐dimensional gaussian filter using a 12‐mm full width at half maximum kernel (voxel size, 2 × 2 × 2 mm3).
Control and caloric air stimulation BP images of the two conditions (i.e., control vs. stimulation (Phase 2)) were compared using a paired t‐test on a voxel‐wise manner with SPM5. Contrasts of interests were control (i.e., sham) vs. stimulation condition. Statistical threshold below P < 0.001 (uncorrected) were considered significant. In addition, multiple comparison correction was performed using small volume correction for the significant clusters (P < 0.05 corrected).
In a subsequent analysis, the correlations between mean systolic, mean diastolic blood pressure, mean heart rate, and mean VRS judgments of dizziness/vertigo from Phase 2, and the individual BP images were calculated.
The stereotactic coordinates are according to the Montreal Neurological Institute (MNI) coordinates. MNI coordinates were assigned to cortical structures using an MNI‐space utility software tool (http://www.ihb.spb.ru/~pet_lab/MSU/MSUMain.html).
RESULTS
Judgment of Dizziness/Vertigo
VRS judgments of the 10 subjects during the vestibular stimulation session revealed a slight feeling of dizziness/vertigo (median feeling of dizziness/vertigo = 2, range 0–10) whereas no dizziness/vertigo at all was reported during the control session (Wilcoxon test P < 0.01).
Autonomic Parameters
Mean blood pressure of all subjects during Phase 2 of the control (sham) period was 114 mm Hg (SD ± 11.1 mm Hg) for systolic and 62 mm Hg (SD ± 9.2 mm Hg) for diastolic blood pressure; during the Phase 2 of the stimulation period mean systolic blood pressure was 118 mm Hg (SD ± 8.4 mm Hg) and mean diastolic blood pressure 65 mm Hg (SD ± 5.2 mm Hg). The mean heart rate of the Phase 2 during control period was 61 beats per minute (bpm) (SD ± 6 bpm) vs. 63 bpm (SD ± 9 bpm) during the vestibular stimulation. According to the mild feeling of vertigo, none of the autonomic parameters showed a significant difference between control and stimulation period (paired t‐test for systolic blood pressure P = 0.53; for diastolic blood pressure P = 0.48; for heart rate P = 0.76) and none of the autonomic parameters linearly correlated with the dizziness/vertigo rating (ns).
PET Data
Categorical comparison (paired t‐test)
A tendency to an increased [18F]FEDPN binding during stimulation compared to the control condition of the left middle frontal gyrus and the right medial frontal gyrus reaching into the anterior cingulate cortex was seen (Fig. 1A; Table I). The scans in Phase 2 showed a decreased [18F]FEDPN binding during stimulation at the right posterior insular cortex (posterior long insular gyrus; granular field) and the right precentral gyrus (Table I) compared to the control condition (Fig. 1B).
Figure 1.
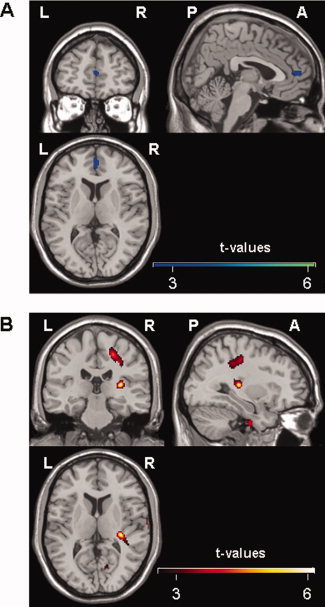
(A) Illustration of the voxel‐wise comparison between stimulation and control PET scans. Clusters of reduced [18F]FEDPN binding during control condition can be attributed to the right medial frontal gyrus reaching into the anterior cingulate cortex. Color bar shows t‐values (uncorrected P < 0.007). (B) Voxel‐wise comparison between control and stimulation PET scans. Clusters of a reduced [18F]FEDPN binding, i.e., high opiate receptor binding, during the stimulation period can be attributed to the right posterior insular cortex reaching to the retroinsular region and the right anterior precentral gyrus. Color bar shows t‐values (uncorrected P < 0.001) (L = left, R = right; A = anterior; P = posterior).
Table I.
Anatomic structures with significant changes in opiate binding potential (control vs. stimulation condition and vice versa)
| Contrast | Anatomic structure | Side | MNI coordinates | Cluster size (number of voxels) | z‐score | P‐value (uncorrected) | cluster‐level P‐value (corrected) | ||
|---|---|---|---|---|---|---|---|---|---|
| X | Y | Z | |||||||
| Control vs. stimulation | Right insular cortex | R | 32 | −26 | 10 | 27 | 3.69 | P ≤ 0.001* | P = 0.002* |
| Precentral gyrus | R | 22 | −20 | 48 | 64 | 3.42 | P ≤ 0.001* | P = 0.002* | |
| Stimulation vs. control | Middle frontal gyrus | L | −28 | 32 | −18 | 56 | 2.75 | P = 0.003 | |
| Medial frontal gyrus/ anterior cingulate cortex | R | 4 | 52 | 8 | 26 | 2.48 | P = 0.007 | ||
R = right; L = left; “*” significant.
Correlation Analysis
VRS judgments of dizziness/vertigo during the vestibular stimulation session and [18F]FEDPN binding showed a negative correlation at the left pons (x = −2, y = −18, z = −36; r = −0.948; P < 0.001) (Fig. 2A).
Figure 2.
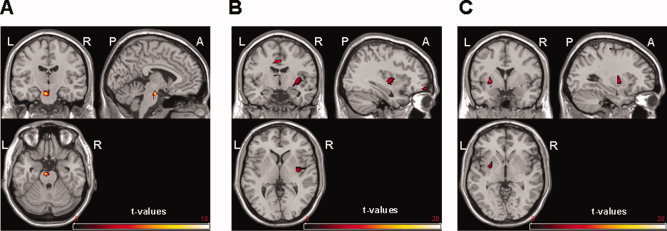
(A) Negative correlation between judgements of dizziness/vertigo and [18F]FEDPN binding at the pons (uncorrected P < 0.001). (L = left, R = right; A = anterior; P = posterior). (B) Negative correlation between systolic blood pressure and [18F]FEDPN binding at the right posterior insula and the left cingulate cortex (uncorrected P < 0.001). (C) Negative correlation between diastolic blood pressure and [18F]FEDPN at the left putamen and claustrum. Color bar shows t‐values (uncorrected P < 0.001).
A negative correlation between systolic blood pressure and [18F]FEDPN binding was seen for the right posterior insular cortex (x = 34, y = −10, z = 0; r = −0.94; P < 0.001) and the left anterior cingulate cortex (x = −7, y = 30, z = 22; r = −0.96; P < 0.001) (Fig. 2B). Even at lower threshold (P = 0.05; T = 4.03) no correlation was seen at the left posterior insular cortex indicating a lateralization effect. The correlation between diastolic blood pressure and [18F]FEDPN binding presented a negative correlation at the left putamen and claustrum (x = −28, y = 0, z = 0; r = −0.74; P < 0.001) (Fig. 2C). No significant correlation was found between heart rate and [18F]FEDPN binding.
DISCUSSION
This study provides evidence that in right‐handed healthy volunteers changes of opioid receptor availability are induced by vestibular stimulation with caloric irrigation of the right horizontal canal. Areas involved were the right posterior insula and the precentral gyrus. These areas belong to the multisensory vestibular cortical network [Bense et al., 2001, 2004; Bottini et al., 1994; Dieterich and Brandt, 2008; Dieterich et al., 2003; Suzuki et al., 2001] with the posterior insula as the core region PIVC [Grüsser et al., 1990a, b; Guldin and Gruesser, 1996]. Thus, it appears that opioid receptor‐mediated neurotransmission does play a role in the modulation of the vestibular cortical system in humans.
Interestingly, the areas with changes in the [18F]FEDPN binding were mainly located in the right hemisphere [Bense et al., 2004; Dieterich and Brandt, 2008; Dieterich et al., 2003]. This matches to the concept of a dominance of vestibular cortical areas within the right hemisphere in right‐handers [Dieterich et al., 2003; Janzen et al., 2008]. In particular, the PIVC in the right posterior insula holds very important multimodal vestibular functions in monkeys [Grüsser et al., 1990a, b]. Thus, the current data add further evidence to the hypothesis that the posterior insula in humans is the equivalent of the PIVC in monkeys and presents a relevant hub in vestibular processing.
First evidence that the opioid system plays a role in the central vestibular network came from animal studies in rats. Extracellular single‐cell and patch clamp recording in vitro showed that δ‐opioid receptors made a major contribution to medial vestibular nucleus function [Carpenter and Hori, 1992; Sulaiman and Dutia, 1998]. In humans, evidence for an involvement of opioidergic mechanisms in the central vestibular system was lacking. Indirect support that opioids might play a role in humans comes from a study that investigated the clinical effects and eye movements after intravenous opiate administration in normal subjects [Rottach et al., 2002]. It led to a temporary disturbance of ocular fixation causing downbeat nystagmus or square wave jerks. Since opioid receptors are located in the cerebellum [Schadrack et al., 1999] and lesions of the vestibulo‐cerebellum (i.e., flocculus) may cause downbeat nystagmus [Bense et al., 2006; Kalla et al., 2006], these clinical data point rather to disturbed mechanisms of the vestibulo‐cerebellum. Another study investigated muscle sympathetic activity, heart rate, and arterial blood pressure after otolith organ engagement caused by head‐down rotation before and after administration of naloxone or codeine [Ray and Monahan, 2004]. Neither the opioid‐receptor antagonist naloxone nor the opioid codein was able to modulate the reflex increase of muscle sympathetic activity [Ray and Monahan, 2004]. Therefore, the present data pointing toward a functional involvement of opioidergic mechanisms in the cortical vestibular network are of even more interest and innovation.
What does the modulation of the opioidergic neuronal activation in these regions mean? Despite the fact that the changes at the left middle frontal gyrus and the right medial frontal gyrus affecting the anterior cingulate cortex were not significant one might speculate that this increase of receptor availability might be due to mechanisms such as reduced endogenous opioid release or upregulation of a possible receptor reserve [Fan et al., 2003; Hammers et al., 2007]. A decrease in receptor availability during stimulation, i.e., an increase of endogenous opiate binding on opioidergic receptors, was observed at the posterior insular region and the precentral region. This decrease in receptor availability might be a result of short‐term receptor internalization or increased release of endorphins in response to the vestibular stimulation [Henriksen and Willoch, 2008]. Thus, there is an endogenous opiate receptor binding during the stimulation in these regions. This pattern of up‐ and downregulation of opioid signaling might fit into the hypothesis of cross‐modal sensory processes [Baier et al., 2006; Brandt and Dieterich, 1999; Laurienti et al., 2002; Maihöfner et al., 2006], and could imply an interaction between regions of different systems that are involved in vestibular control—such as the insular cortex.
In patients with acute vestibular dysfunction and in animal studies there is an clinically obvious activation of the autonomic nervous system by strong vestibular input, possibly via brainstem noradrenergic and serotonergic circuits [Manzoni et al., 1989; Pompeiano et al., 1991]. In the present study, vestibular activation was weak and thus sympathetic activation minor. Nevertheless, there was a negative correlation between autonomic parameters such as systolic blood pressure and [18F]FEDPN binding in regions such as the insular and cingulate cortex which are known to be relevant for both, the vestibular and the autonomic systems. These findings deserve further investigations employing different and stronger vestibular stimuli leading to more differentiated activations of the sympathetic nervous system.
The question of whether present changes in receptor availability were due to the caloric induced eye movements cannot be finally resolved. However, in this case one would expect changes in the cerebellum and brainstem, i.e., the typical region related to eye movement control [Dieterich et al., 2000; Leigh and Zee, 2006]. Another limitation of the study is that the tracer is not able to differentiate between increased endogenous opioid peptide occupation and receptor internalization. Furthermore, there is a lack of distinction between the mu (‐μ), kappa ‐(κ), and delta (‐δ) opioid receptors, since [18F]FEDPN is a nonselective antagonist. Thus, further studies are needed with selective agonist to analyze the role of the various receptors in more detail [Henriksen and Willoch, 2008].
In summary, there is convincing evidence that changes of opioidergic transmission in the right posterior insula of healthy right‐handers were induced by vestibular stimulation, a finding that complements previous imaging studies (Bense et al., 2004; Dieterich and Brandt, 2008; Dieterich et al., 2003). An association between the vestibular and the autonomic nervous system, possibly via the opioidergic mechanisms, may explain some clinical findings such as profuse sweating, blood pressure increase and tachycardia during clinical vestibular disorders.
Acknowledgements
The authors thank Mrs. Benson for critically reading the manuscript. This study was supported by the Stiftung Rheinland‐Pfalz für Innovation.
REFERENCES
- Baier B, Kleinschmidt A, Müller NG ( 2006): Cross‐modal processing in early visual and auditory cortices depends on expected statistical relationship of multisensory information. J Neurosci 22: 12260–12265. [DOI] [PMC free article] [PubMed] [Google Scholar]
- Bense S, Stephan T, Yousry TA, Brandt T, Dieterich M ( 2001): Multisensory cortical signal increases and decreases during vestibular galvanic stimulation (fMRI). J Neurophysiol 85: 886–899. [DOI] [PubMed] [Google Scholar]
- Bense S, Bartenstein P, Lochmann M, Schlindwein P, Brandt T, Dieterich M ( 2004): Metabolic changes in vestibular and visual cortices in acute vestibular neuritis. Ann Neurol 56: 624–630. [DOI] [PubMed] [Google Scholar]
- Bense S, Best C, Buchholz HG, Wiener V, Schreckenberger M, Bartenstein P, Dieterich M ( 2006): 18F‐fluorodeoxyglucose hypometabolism in cerebellar tonsil and flocculus in downbeat nystagmus. Neuroreport 17: 599–603. [DOI] [PubMed] [Google Scholar]
- Brandt T, Dieterich M ( 1999): The vestibular cortex. Its locations, functions, and disorders. Ann N Y Acad Sci 871: 293–312. [DOI] [PubMed] [Google Scholar]
- Bottini G, Sterzi R, Paulesu E, Vallar G, Cappa SF, Erminio F, Passingham RE, Frith CD, Frackowiak RS ( 1994): Identification of the central vestibular projections in man: A positron emission tomography activation study. Exp Brain Res 99: 164–169. [DOI] [PubMed] [Google Scholar]
- Carpenter DO, Hori N ( 1992): Neurotransmitter and peptide receptors on medial vestibular nucleus neurons. Ann N Y Acad Sci 22: 668–686. [DOI] [PubMed] [Google Scholar]
- Dieterich M, Brandt T ( 2008): Functional brain imaging of peripheral and central vestibular disorders. Brain 131: 2538–2552. [DOI] [PubMed] [Google Scholar]
- Dieterich M, Bucher SF, Seelos KC, Brandt T ( 2000): Cerebellar activation during optokinetic stimulation and saccades. Neurology 54: 148–155. [DOI] [PubMed] [Google Scholar]
- Dieterich M, Bense S, Lutz S, Drzezga A, Stephan T, Bartenstein P, Brandt T ( 2003): Dominance for vestibular cortical function in the non‐dominant hemisphere. Cereb Cortex 13: 994–1007. [DOI] [PubMed] [Google Scholar]
- Fan LW, Tien LT, Tanaka S, Ma T, Chudapongse N, Sinchaisuk S, Rockhold RW, Ho IK ( 2003): Changes in the brain kappa‐opioid receptor levels of rats in withdrawal from physical dependance upon butorphanol. Neuroscience 121: 1063–1074. [DOI] [PubMed] [Google Scholar]
- Grüsser OJ, Pause M, Schreiter U ( 1990a): Localization and responses of neurones in the parieto‐insular vestibular cortex of awake monkeys (Macaca fascicularis). J Physiol 430: 537–557. [DOI] [PMC free article] [PubMed] [Google Scholar]
- Grüsser OJ, Pause M, Schreiter U ( 1990b): Vestibular neurones in the parieto‐insular cortex of monkeys (Macaca fascicularis): Visual and neck receptor responses. J Physiol 430: 559–583. [DOI] [PMC free article] [PubMed] [Google Scholar]
- Guldin WO, Grüsser OJ ( 1996): The anatomy of the vestibular cortices of primates In: Collard M, Jeannerod M, Christen Y, editors. Le Cortex Vestibulaire. Editions IRVINN. Paris: Ipsen; pp 17–26. [Google Scholar]
- Hammers A, Asselin MC, Hinz R, Kitchen I, Brooks DJ, Duncan JS, Koepp MJ ( 2007): Upregulation of opioid receptor binding following spontaneous epileptic seizures. Brain 130: 1009–1016. [DOI] [PubMed] [Google Scholar]
- Henriksen G, Willoch F ( 2008): Imaging of opioid receptors in the central nervous system. Brain 131: 1171–1196. [DOI] [PMC free article] [PubMed] [Google Scholar]
- Janzen J, Schlindwein P, Bense S, Bauermann T, Vucurevic G, Stoeter P, Dieterich M ( 2008): Neural correlates of hemispheric dominance and ipsilaterality within the vestibular system. Neuroimage 42: 1508–1518. [DOI] [PubMed] [Google Scholar]
- Kalla R, Deutschländer A, Huefner K, Stephan T, Jahn K, Glasauer S, Brandt T, Strupp M ( 2006): Detection of floccular hypometabolism in downbeat nystagmus by fMRI. Neurology 66: 281–283. [DOI] [PubMed] [Google Scholar]
- Laurienti PJ, Burdette JH, Wallace MT, Yen YF, Field AS, Stein BE ( 2002): Deactivation of sensory‐specific cortex by cross‐modal stimuli. J Cogn Neurosci 14: 420–429. [DOI] [PubMed] [Google Scholar]
- Leigh RJ, Zee DS ( 2006): The neurology of eye movements, 4 th ed. New York: Oxford University Press. [Google Scholar]
- Logan J, Fowler JS, Volkow ND, Wang GJ, Ding YS, Alexoff DL ( 1996): Distribution volume ratios without blood sampling from graphical analysis of PET data. J Cereb Blood Flow Metab 16: 834–840. [DOI] [PubMed] [Google Scholar]
- Maihöfner C, Handwerker HO, Birklein F ( 2006): Functional imaging of allodynia in complex regional pain syndrome. Neurology 66: 711–717. [DOI] [PubMed] [Google Scholar]
- Manzoni D, Pompeiano O, Barnes CD, Stampacchia G, d'Ascanio P ( 1989): Convergence and interaction of neck and macular vestibular inputs on locus coeruleus and subcoeruleus neurons. Pflugers Arch 413: 580–598. [DOI] [PubMed] [Google Scholar]
- Oldfield RC ( 1971): The assessment and analysis of handedness: The Edinburgh inventory. Neuropsychologia 9: 97–113. [DOI] [PubMed] [Google Scholar]
- Pompeiano O, Manzoni D, Barnes CD ( 1991): Responses of locus coeruleus neurons to labyrinth and neck stimulation. Prog Brain Res 88: 411–434. [DOI] [PubMed] [Google Scholar]
- Ray CA, Monahan KD ( 2004): Aging, opioid‐receptor agonists and antagonists, and the vestibulosympathetic reflex in humans. J Appl Physiol 96: 1761–1766. [DOI] [PubMed] [Google Scholar]
- Rottach KG, Wohlgemuth WA, Dzaja AE, Eggert T, Straube A ( 2002): Effects of intravenous opioids on eye movements in humans: Possible mechanisms. J Neurol 249: 1200–1205. [DOI] [PubMed] [Google Scholar]
- Sadzot B, Price JC, Mayberg HS, Douglass KH, Dannals RF, Lever JR, Ravert HT, Wilson AA, Wagner HN Jr, Feldman MA ( 1991): Quantification of human opiate receptor concentration and affinity using high and low specific activity [11C]diprenorphine and positron emission tomography. J Cereb Blood Flow Metab 11: 204–219. [DOI] [PubMed] [Google Scholar]
- Salmaso D, Longoni AM ( 1985): Problems in the assessment of hand preference. Cortex 21: 533–549. [DOI] [PubMed] [Google Scholar]
- Schadrack J, Willoch F, Platzer S, Bartenstein P, Mahal B, Dworzak D, Wester HJ, Zieglgänsberger W, Tölle TR ( 1999): Opioid receptors in the human cerebellum: Evidence from [11C]diprenorphine PET, mRNA expression and autoradiography. Neuroreport 10: 619–624. [DOI] [PubMed] [Google Scholar]
- Schreckenberger M, Klega A, Gründer G, Buchholz HG, Scheurich A, Schirrmacher R, Schirrmacher E, Müller C, Henriksen G, Bartenstein P ( 2008): Opioid receptor PET reveals the psychobiologic correlates of reward processing. J Nucl Med 49: 1257–1261. [DOI] [PubMed] [Google Scholar]
- Smith PF ( 2000): Pharmacology of the vestibular system. Curr Opin Neurol 13: 31–37. [DOI] [PubMed] [Google Scholar]
- Sulaiman MR, Dutia MB ( 1998): Opioid inhibition of rat medial vestibular nucleus neurones in vitro and its dependence on age. Exp Brain Res 122: 196–202. [DOI] [PubMed] [Google Scholar]
- Sulaiman MR, Niklasson M, Tham R, Dutia MB ( 1999): Modulation of vestibular function by nociceptin/orphanin FQ: An in vivo and in vitro study. Brain Res 828: 74–82. [DOI] [PubMed] [Google Scholar]
- Suzuki M, Kitano H, Ito R, Kitanishi T, Yazawa Y, Ogawa T, Shiino A, Kitajima K ( 2001): Cortical and subcortical vestibular response to caloric stimulation detected by functional magnetic resonance imaging. Brain Res Cogn Brain Res 12: 441–449. [DOI] [PubMed] [Google Scholar]
- Wängler B, Schneider S, Thews O, Schirrmacher E, Comagic S, Feilen P, Schwanstecher C, Schwanstecher M, Shiue CY, Alavi A, Höhnemann S, Piel M, Rösch F, Schirrmacher R ( 2004): Synthesis and evaluation of (S)‐2‐(2‐[18F]fluoroethoxy)‐4‐([3‐methyl‐1‐(2‐piperidin‐1‐yl‐phenyl)‐butyl‐carbamoyl]‐methyl)‐benzoic acid ([18F]‐repaglinide): A promising radioligand for quantification of pancreatic b‐cell mass with positron emission tomography (PET). Nucl Med Biol 31: 639–647. [DOI] [PubMed] [Google Scholar]
- Wester HJ, Willoch F, Tölle TR, Munz F, Herz M, Oye I, Schadrack J, Schwaiger M, Bartenstein P ( 2000): 6‐O‐(2‐[18F]fluoroethyl)‐6‐O‐desmethyldiprenorphine ([18F]DPN): Synthesis, biologic evaluation, and comparison with [11C]DPN in humans. J Nucl Med 41: 1279–1286. [PubMed] [Google Scholar]
- Wienhard K, Eriksson L, Grootoonk S, Casey M, Pietrzyk U, Heiss WD ( 1992): Performance evaluation of the positron scanner ECAT EXACT. J Comput Assist Tomogr 16: 804–813. [DOI] [PubMed] [Google Scholar]