

Abstract
Resting state brain activity in Parkinson's disease (PD) can give clues to the pathophysiology of the disorder, and might be helpful in diagnosis, but it has never been explored using functional MRI (fMRI). In the current study, we used a regional homogeneity (ReHo) method to investigate PD‐related modulations of neural activity in the resting state. FMRIs were acquired in 22 patients with PD at both before and after levodopa administration, as well as in 22 age‐ and sex‐matched normal controls. In the PD group compared with the healthy controls, we found ReHo decreased in extensive brain regions, including the putamen, thalamus, and supplementary motor area; and increased in some other areas, including the cerebellum, primary sensorimotor cortex, and premotor area. The ReHo off medication was negatively correlated with the Unified Parkinson's Disease Rating Scale (UPDRS) in the putamen and some other regions, and was positively correlated with the UPDRS in the cerebellum. Administration of levodopa relatively normalized ReHo. Our findings demonstrate that neural activity in the resting state is changed in patients with PD. This change is secondary to dopamine deficiency, and related to the severity of the disease. The different neuronal activity at the baseline state should be considered in explaining fMRI findings obtained during tasks. Hum Brain Mapp 2009. © 2008 Wiley‐Liss, Inc.
Keywords: Parkinson's disease, regional homogeneity, resting state, striatal‐thalamo‐cortical loops, brain activity
INTRODUCTION
Parkinson's disease (PD) is a progressive neurological disorder characterized by tremor, rigidity, and slowness of movements, and is associated with progressive neuronal loss of the substantia nigra and other brain structures. Although the pathophysiology has been investigated for several decades, much remains unclear. In recent years, functional magnetic resonance imaging (fMRI) has been extensively used on PD research. To date, these investigations have generally focused on task‐related neural activity, and are helpful on our understanding of pathophysiological changes in PD. For example, the supplementary motor area (SMA) is commonly found hypoactivated, and some other cortical motor regions, like the cerebellum, premotor area (PMA), and parietal cortex are hyperactivated in patients with PD compared to normal subjects during performing motor tasks [Buhmann et al., 2003; Haslinger et al., 2001; Sabatini et al., 2000; Wu and Hallett, 2005]. However, the brain activity during movement performance shown in fMRI studies is defined as the comparison between the “task” and “baseline resting” condition. The different activity observed between the patients with PD and normal subjects maybe due to PD‐related modulations of neuronal activity either at the “task” state or at the “resting” state. Therefore, differences of neuronal activity in the resting state between the two groups can have important implications for across‐population comparisons. However, by now, whether the activation in fMRI is changed in patients with PD in the resting state has never been investigated. All previous studies simply attributed differences between PD and controls during performing tasks as an abnormality of the resting state. Using positron emission tomography (PET), or single‐photon emission computed tomography (SPECT), it has been revealed that regional metabolism in the resting state is abnormal in PD. The patients have hypermetabolism in some regions, like the globus pallidus, thalamus, pontine, and cerebellum; and hypometabolism in some other areas, like prefrontal cortex, PMA, SMA, and parietal cortex [Eckert et al., 2005; Eidelberg et al., 1995; Fukuda et al., 2001]. Thus, it is likely that fMRI activity in the resting state is also different in PD and normal subjects, and these differences may contribute to the observed higher or lower activity in patients with PD detected by fMRI during task performance.
Recently, a new method, regional homogeneity (ReHo), has been developed to analyze the blood‐oxygen‐level dependent (BOLD) signal of the brain [Zang et al., 2004]. ReHo assumes that within a functional cluster, the hemodynamic characteristics of every voxel would be similar, or synchronous with that of each other; and such similarity could be changed or modulated by different conditions [Zang et al., 2004]. ReHo does not require the onset time of stimulus and therefore is useful for resting‐state fMRI data analysis. This method has been successfully used to investigate the functional modulations in the resting state in the patients with Alzheimer's disease (AD) [He et al., 2007], patients with schizophrenia [Liu et al., 2006], and normal aging subjects [Wu et al., 2007]. In the current study, we used this method to investigate PD‐related brain neural activity in the resting state.
MATERIALS AND METHODS
Subjects
We studied 22 patients with PD (16 males, 6 females; mean age 59.5), and 22 age‐ and sex‐balanced healthy subjects (mean age 59.7). The subjects were all right‐handed as measured by the Edinburgh Inventory [Oldfield, 1971]. The diagnosis of PD was based on medical history, physical and neurological examinations, response to levodopa or dopaminergic drugs, and laboratory tests and MRI scans to exclude other diseases. Patients were assessed with the UPDRS (Unified Parkinson's Disease Rating Scale) [Lang and Fahn, 1989], and the Hoehn and Yahr disability scale [Hoehn and Yahr, 1967] while off their medications. All subjects reported no history of heart disease, hypertension, or diabetes. The Mini‐Mental State Exam (MMSE) was 30 in all subjects. To avoid disturbance of the fMRI signal, all patients with PD were chosen to have at most a mild tremor. The clinical data of patients with PD are shown in Table I. The experiments were performed according to the Declaration of Helsinki and were approved by the Institutional Review Board. All subjects gave their written informed consent for the study.
Table I.
Clinical details of patients with Parkinson's disease (mean ± SD)
| Age (years) | 59.5 ± 8.1 |
| Sex | 6 F, 16 M |
| Disease duration (years) | 4.1 ± 1.8 |
| UPDRS (off medication) | 25.6 ± 8.1 |
| H&Y (off medication) | 1.7 ± 0.5 |
| l‐dopa dose (mg/day) | 409.0 ± 177.0 |
UPDRS, Unified Parkinson's disease rating scale; H&Y, Hoehn and Yahr staging; F, female; M, male.
Data Acquisitions
Imaging was performed on a 1.5 T Siemens Sonata scanner. A standard head coil was used with foam padding to restrict head motion. High resolution axial T1‐ and T2‐weighted images were obtained in every subject to detect clinically silent lesions. During resting state fMRI, subjects were instructed to keep their eyes closed, to remain motionless, and to not to think of anything in particular. We used a gradient‐echo echo‐planar sequence sensitive to BOLD contrast to acquire functional images (TR = 2,000 ms, TE = 60 ms, flip angle = 90o, field of view (FOV) = 24 × 24 cm2, matrix = 64 × 64). Twenty axial slices were collected with 5 mm thickness, and a 2 mm gap. Resolution was 3.75 × 3.75 mm2 in‐plane. Each fMRI scan lasted 6 min.
Normal subjects were scanned one time, whereas patients with PD were scanned twice when in the clinical off and on states. Patients were first scanned after their medication had been withdrawn for at least 12 h (off state). After the first scan, levodopa was administered orally as 250 mg Madopar (200 mg levodopa/50 mg benserazide, Roche company, Shanghai), in all patients. The second scan was performed 60 min after oral levodopa had been given, when all patients achieved clinical on state.
Data Analyses
Data of each fMRI scan contained 180 time points. The first five time points of fMRI data were discarded because of the instability of the initial MRI signal and the adaptation of the subjects to the circumstances. The remaining 175 images were preprocessed using AFNI software. They were slice‐time‐corrected, and aligned to the first image of each session for motion correction, spatially normalized to Talairach and Tournoux space [Talairach and Tournoux, 1988] and were smoothed with a Gaussian filter of 6 mm full width at half‐maximum (FWHM) to reduce noise and residual differences in gyral anatomy. Linear drift was removed. Each subject's movement parameters were examined. Datasets with more than 1 mm maximum translation in x, y, or z, or 1 degree of maximum rotation about three axes were discarded. As all subjects' head movements were less than 0.5 mm and 1 degree, no subject was excluded. A temporal filter (0.01 Hz < f < 0.08 Hz) was applied to remove low‐frequency drifts and physiological high‐frequency noise [Biswal et al., 1995].
We used Kendall's coefficient of concordance (KCC) [Kendall and Gibbons, 1990] to measure regional homogeneity or similarity of the ranked time series of a given voxel with its nearest 26 neighbor voxels in a voxel‐wise way:
| (1) |
where W is the KCC among given voxels, ranging from 0 to 1; Ri is the sum rank of the ith time point;  = ((n + 1)K)/2 is the mean of the Ris; K is the number of time series within a measured cluster (27, one given voxel plus the number of its neighbors); n is the number of ranks (here, n = 175 time points). The KCC value was calculated to this voxel, and an individual KCC map was obtained for each subject. This procedure was implemented by an in‐house software ReHofMRI11.0 (by Dr. Yong He, http://www.bic.mni.mcgill.ca/users/yonghe). The intracranial voxels were extracted to make a mask [Smith, 2002]. For standardization purposes, each individual ReHo map was divided by its own mean ReHo within the mask. A second‐level random‐effect one‐sample t test (P < 0.05, with multiple comparison correction) was performed to show the ReHo results for each group, including the normal subjects, patients with PD in the off state, and patients with PD in the on state, respectively. Then, second‐level random‐effect two‐sample t tests were applied to compare the ReHo results: (1) between the patients with PD in the off state and normal subjects (two sample t test; P < 0.05, corrected); (2) between the patients with PD in the on state and normal subjects (two sample t test; P < 0.05, corrected); and (3) between the patients with PD in the off state and in the on state (paired t test; P < 0.05, corrected). Threshold correction was done by using the AlphaSim program in AFNI, which applies Monte Carlo simulation to calculate the probability of false positive detection by taking into consideration both the individual voxel probability thresholding and cluster size.
Finally, to explore whether the ReHo correlates with the disease progression in the patients with PD, a correlation analysis of ReHo versus the UPDRS score was performed in the patients with PD at off state at each voxel of the whole brain.
RESULTS
ReHo results within the normal subjects, patients with PD at off state, and patients with PD at on state are shown in Figure 1 (one‐sample t test; P < 0.05, with multiple comparison correction). The default mode network including the posterior cingulate cortex (PCC)/precuneus, medial prefrontal cortex (MPFC), and bilateral inferior parietal lobe (IPL) exhibited significant higher ReHo than other brain areas (Fig. 1A–C). Compared with the healthy controls, the patients with PD at off state showed significant ReHo decreases in the bilateral putamen, bilateral medial frontal gyrus, left thalamus, SMA, bilateral parahippocampal gyrus, right posterior cingulate, left inferior parietal lobule, left superior frontal gyrus, and right precuneus, and increases in the bilateral cerebellum, left SM1, bilateral PMA, right medial frontal gyrus, right lingual gyrus, right cuneus, left middle temporal gyrus, and right insula (two sample t test, P < 0.05, corrected; Fig. 2 and Table II). In patients with PD at on state, decreased or increased ReHo was detected compared with normal subjects essentially in the same locations as at off state (data is not shown here).
Figure 1.
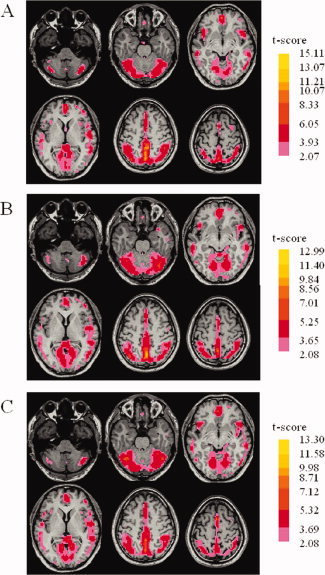
Results of regional homogeneity (ReHo) shown as a Kendall's coefficient of concordance (KCC) map across all healthy control subjects (A), patients with Parkinson's disease (PD) in the off state (B), and patients with PD in the on state (C), in the resting state (one‐sample t test; <0.05, with multiple correction).
Figure 2.

PD‐related changes of ReHo shown as a comparison of KCC maps between patients with PD in the off state and controls (two‐sample t test; P < 0.05, corrected) in the resting state. T‐score bars are shown on the right. Hot and cold colors indicate PD‐related ReHo increases and decreases, respectively.
Table II.
Differences of regional homogeneity (ReHo) between patients with PD in the off state (without administration of levodopa) and normal controls
| Brain region | Coordinates | t value | Vol (mm3) | ||
|---|---|---|---|---|---|
| x | y | z | |||
| L putamen | −15 | 10 | −10 | −4.07 | 2,173 |
| L medial frontal gyrus | −20 | 10 | 44 | −4.06 | 2,943 |
| L parahippocampal gyrus | −40 | −30 | −12 | −4.05 | 1,674 |
| R parahippocampal gyrus/amygdala | 26 | −4 | −13 | −3.99 | 837 |
| R putamen | 24 | 2 | 8 | −3.94 | 856 |
| R medial frontal gyrus | 20 | 38 | 24 | −3.87 | 5,724 |
| L thalamus | −20 | −19 | 5 | −3.84 | 913 |
| R SMA | 1 | 6 | 53 | −3.83 | 412 |
| R posterior cingulate | 4 | −50 | 24 | −3.78 | 2,673 |
| L inferior parietal lobule | −38 | −38 | 40 | −3.67 | 972 |
| L medial frontal gyrus | −22 | 34 | 18 | −3.49 | 3,753 |
| L superior frontal gyrus | −22 | 16 | 48 | −3.24 | 1,026 |
| R precuneus | 14 | −62 | 48 | −3.10 | 1,134 |
| R cerebellum | 20 | −50 | −18 | 4.73 | 17,820 |
| L cerebellum | −13 | −40 | −16 | 4.65 | 8,892 |
| L primary sensorimotor cortex | −26 | −30 | 54 | 4.51 | 1,313 |
| R superior parietal lobule | 32 | −45 | 61 | 4.28 | 1,026 |
| R medial frontal gyrus | 10 | 50 | −16 | 4.24 | 1,215 |
| R lingual gyrus | 20 | −70 | 2 | 4.07 | 3,186 |
| L premotor area | −30 | −16 | 58 | 3.87 | 456 |
| R cuneus | 10 | −68 | 30 | 3.46 | 972 |
| R premotor area | 24 | −6 | 61 | 3.28 | 798 |
| L middle temporal gyrus | −40 | −70 | 12 | 3.10 | 1,431 |
| R insula | 40 | 10 | 9 | 2.99 | 999 |
The coordinates are given as stereotaxic coordinates referring to the atlas of Talairach and Tournoux.
t value, statistical value of peak voxel showing ReHo differences between the groups (negative t value means decreased ReHo in PD group compared to normal controls; positive t value means increased ReHo in PD group compared to normal controls); L, left; R, right; Vol, cluster volume; SMA, supplementary motor area.
Administration of levodopa increased ReHo in the bilateral putamen, cingulate, SMA, left superior temporal gyrus, and middle frontal gyrus, and decreased ReHo in the bilateral cerebellum, right superior temporal gyrus, right superior parietal lobule, precuneus, left SM1, right frontal gyrus, right temporal lobe, and right parietal cortex compared to patients with PD at off condition (paired t test, P < 0.05, corrected; Fig. 3 and Table III).
Figure 3.

The effect of administration levodopa on PD‐related changes of ReHo. The results are shown as a comparison of KCC maps between patients with PD in the off state and in the on state (paired t test; P < 0.05, corrected), in the resting state. T‐score bars are shown on the right. Hot and cold colors indicate ReHo increases and decreases in the on state compared to that in the off state, respectively.
Table III.
Differences of ReHo between patients with PD in the on (with administration of levodopa) and off state
| Brain region | Coordinates | t value | Vol (mm3) | ||
|---|---|---|---|---|---|
| x | y | z | |||
| R cingulated | 8 | −4 | 42 | 4.45 | 1,798 |
| L putamen | −25 | −10 | 5 | 4.38 | 865 |
| R SMA | 2 | 6 | 55 | 4.09 | 414 |
| L superior temporal gyrus | −42 | −25 | 6 | 3.17 | 982 |
| R putamen | 24 | 3 | 7 | 3.02 | 236 |
| L middle frontal gyrus | −29 | −2 | 53 | 2.86 | 338 |
| R cerebellum | 27 | −79 | −22 | −3.75 | 2,122 |
| R superior temporal gyrus | 56 | −39 | 9 | −3.44 | 1,896 |
| R superior parietal lobule | 42 | −61 | 50 | −3.39 | 912 |
| L precuneus | −4 | −64 | 45 | −3.31 | 2,483 |
| L primary sensorimotor cortex | −34 | −31 | 55 | −3.18 | 266 |
| L cerebellum | −19 | −79 | −38 | −3.09 | 372 |
| R superior frontal gyrus | 22 | 26 | 48 | −3.01 | 247 |
| R temporal lobe | 48 | −17 | −8 | −2.98 | 394 |
| R parietal cortex | 24 | −35 | 57 | −2.96 | 265 |
The coordinates are given as stereotaxic coordinates referring to the atlas of Talairach and Tournoux.
t value, statistical value of peak voxel showing ReHo differences between the on and off state in patients with PD (positive t value means increased ReHo in patients with PD in the on state compared to patients with PD in the off state; negative t value means decreased ReHo in patients with PD in the on state to patients with PD in the off state).
Correlations Between ReHo and UPDRS in Patients with PD
Correlation analysis of ReHo at each voxel in the whole brain against the UPDRS in the patients with PD at off state revealed significantly negative correlation in the bilateral putamen, right precuneus, right middle temporal gyrus, and left middle occipital gyrus; and significantly positive correlations in the bilateral cerebellum, and left lingual gyrus (P < 0.05, corrected; Fig. 4, and Table IV). We further chose the point of peak voxel of bilateral putamen that had negative correlation between the ReHo and UPDRS, and performed a correlation coefficient analysis. The result from the right putamen (x = 22, y = 1, z = 2) is shown in Figure 5 (r = −0.67). r was −0.62 at the left putamen (x = −26, y = 4, z = −1).
Figure 4.

Results of correlation analysis between the UPDRS (Unified Parkinson's Disease Rating Scale) and ReHo in the patients with PD in the off state (P < 0.05, corrected). T‐score bars are shown on the right. Hot and cold colors indicate positive and negative correlations between ReHo and UPDRS, respectively.
Table IV.
Brain regions showing significant correlations (P < 0.05, corrected) between the UPDRS and ReHo in patients with PD in the off state
| Brain region | Coordinates | t value | Vol (mm3) | ||
|---|---|---|---|---|---|
| x | y | z | |||
| R putamen | 24 | 8 | −2 | −4.38 | 865 |
| L putamen | −27 | −3 | −5 | −4.09 | 414 |
| R precuneus | 8 | −66 | 28 | −3.17 | 982 |
| R middle temporal gyrus | 46 | −63 | 2 | −3.02 | 236 |
| L middle occipital gyrus | −23 | −90 | 4 | −2.86 | 338 |
| R insula | 42 | −2 | −1 | 3.75 | 2122 |
| R cerebellum | 19 | −36 | −23 | 3.44 | 1896 |
| L cerebellum | −14 | −38 | −18 | 3.39 | 912 |
| L lingual gyrus | −20 | −78 | −4 | 3.31 | 2483 |
The coordinates are given as stereotaxic coordinates referring to the atlas of Talairach and Tournoux.
t value, statistical value of peak voxel showing significant correlation between the UPDRS and ReHo in PD group in the off state (negative t value means negative correlation, positive t value means positive correlation between the UPDRS and ReHo, respectively).
Figure 5.

The result of correlation analysis between the UPDRS (x‐axis) and ReHo (y‐axis) in the right putamen (x = 22, y = 1, z = 2, the voxel showing the most significant negative correlation between the UPDRS and ReHo) in patients with PD in the off state (P < 0.05, corrected).
DISCUSSION
The present study shows that the ReHo method can detect patterns of homogeneity changes in PD in the resting state. In patients with PD, ReHo was decreased in some areas and increased in others. The ReHo in the putamen and cerebellum correlated with the progress of the disease. In addition, administration of levodopa relatively normalized ReHo in many regions.
ReHo supposes that voxels within a functional brain area are more temporally homogeneous when this area is involved in a specific condition [Zang et al., 2004]. Higher ReHo was found at the PCC, precuneus, and MPFC in the resting state than in the movement condition [Zang et al., 2004]. PCC/PCu and MPFC have been found to be highly active during awake but resting state and compose a default mode network [Raichle et al., 2001]. In the current study, we also observed that the default mode network, including the PCC and MPFC, has high regional homogeneity (see Fig. 1). This pattern is similar in the two groups and is consistent with previous studies [Greicius et al., 2003; Raichle et al., 2001; Zang et al., 2004]. Abnormal ReHo has been observed in the resting state in attention‐deficit hyperactivity disorder [Cao et al., 2006; Zhu et al., 2005], schizophrenia [Liu et al., 2006], Alzheimer's disease [He et al., 2007], and normal aged subjects [Wu et al., 2007]. The low frequency fluctuation (LFF) BOLD signal has been suggested to reflect spontaneous neuronal activity [Logothetis et al., 2001; Lu et al., 2007; Pelled and Goelman, 2004]. ReHo measures the similarity or coherence of LFF within a given area on the basis of hemodynamics. It might reflect the coherence of spontaneous neuronal activity. Therefore, abnormal ReHo is possibly relevant to the changes of temporal aspects of the spontaneous neural activity in the regional brain. Decreased or increased ReHo in PD suggests that neural function in certain regions is less or more synchronized compared to normal controls. However, whether ReHo simply indicates changes of dopamine‐induced blood flow is unclear, and needs further investigation.
One factor must be considered is whether the two groups differ in their vascular modulation, which may influence BOLD signal [D'Esposito et al., 2003]. In the current study, we carefully selected our subjects: they were age‐ and sex‐ matched, and any participants with potential vascular pathology, like heart disease, hypertension, or diabetes were excluded. In addition, high resolution T1‐ and T2‐weight MRIs were obtained, and any participants with clinically silent lesions were also excluded. Therefore, presumably that vascular fluctuations that are not neuronally regulated are either negligible, or have a comparable effect on control and PD groups, and thus have minimal impact on the group comparison. We can safely argue that our findings reflect differences in neuronal activity.
Most brain regions that showed ReHo changes in patients with PD are involved in the striatal‐thalamo‐cortical loops (see Fig. 2). The striatal‐thalamo‐cortical loops include several parallel circuits, like the sensorimotor, associative, and limbic circuits [Alexander et al., 1990]. The sensorimotor circuit projects somatotopically from the SM1, PMA, and SMA to the putamen [Alexander et al., 1986, 1990; Flaherty and Graybiel, 1993]; then throughout the thalamus projects back to these cortical motor areas. The dysfunction of the sensorimotor circuit has been recognized as a crucial reason for motor difficulties in PD, like akinesia and bradykinesia [Grafton, 2004]. Voluntary movements appear to be initiated at the motor cortical level, with simultaneous output to multiple subcortical regions, including the putamen and thalamus. In PD, it has been shown that the dopamine uptake is reduced in the striatum, and the most severely affected region is the putamen [Brooks et al., 1990]. The putamen is hypoactivated in patients with PD during performing various movements compared to normal subjects [Playford et al., 1992; Rowe et al., 2002]. Our finding of less functional synchronization of the putamen in PD is consistent with a previous study on PD rat model, in which Pelled et al. [2005] used a method to measure the temporal and the spatial variances of fMRI signal (functional homogeneity) and found reduced activity in the striatum.
Among the cortical regions involved in the sensorimotor circuits, ReHo was decreased in the SMA. The SMA is suggested to be critical in planning and initiation of movements, particularly for those internally generated [Jenkins et al., 2000; Tanji and Hoshi, 2001], self‐paced movement sequences [Kermadi et al., 1997]. In patients with PD, the hypoactivation in the SMA during tasks requiring motor selection and initiation has been extensively reported [Buhmann et al., 2003; Haslinger et al., 2001; Jahanshahi et al., 1995; Playford et al., 1992; Rascol et al., 1997]. This hypoactivation could be relatively normalized after the administration of levodopa [Buhmann et al., 2003; Haslinger et al., 2001], or deep brain stimulation of the subthalamic nucleus [Grafton et al., 2006]. It has been suggested that the dysfunction of the SMA due to the deficit of nigrostriatal dopamine system is an important reason contributing to the akinesia in PD [Grafton, 2004].
We found increased ReHo in some other cortical motor areas, like the PMA and SM1. The PMA is important in the temporal organization of sequential movements [Halsband and Freund, 1990; Halsband et al., 1993], selection of movements [Deiber et al., 1991], and in the generation of motor sequences from memory that fit into a precise plan [Grafton et al., 1992; Shibasaki et al., 1993]. The PMA is overactivated in PD while performing motor tasks [Samuel et al., 1997; Wu and Hallett, 2005], and dopaminergic therapy could normalize this overactive pattern in the setting of constant motor performance [Haslinger et al., 2001]. The overactivation in the PMA might represent compensation for dysfunction of basal ganglia in motor control [Grafton, 2004; Haslinger et al., 2001; Wu and Hallett, 2005]. This interpretation assumes that in PD, the striatal‐thalamo‐cortical projection to the PMA is recruited normally. Alternatively, the overall selection pattern could be abnormal because of a general disruption of thalamocortical circuitry. In the normal case, the striatal‐thalamo‐cortical circuit is modeled like a center‐surround filter for choosing among competing motor programs [Mink, 1996]. In PD, there might be cross‐talk between competing programs, leading to appropriate facilitation of the PMA, rather than the SMA [Grafton, 2004].
The increased ReHo in the SM1 is consistent with Pelled et al.'s [2005] finding that the functional homogeneity is increased in the sensorimotor cortex in PD rat model. Several imaging studies on PD have reported increased activity of the SM1 during motor performance [Haslinger et al., 2001; Sabatini et al., 2000; Thobois et al., 2004]. In contrast, an fMRI study on drug naive patients with PD observed hypoactivity in the SM1 [Buhmann et al., 2003], and the activation increased after levodopa intake. The hypoactivity in the SM1 is in line with the classical models of the basal ganglia cortex loop [DeLong, 1990]. It is possible that a functional reorganization of the SM1 may occur after prolonged dopamine treatment [Buhmann et al., 2003]. Thus, the hyperactivity in the SM1 in PD may also reflect compensatory cortical reorganization [Haslinger et al., 2001].
The associative circuit in the striatal‐thalamo‐cortical loops projects from associative cortical areas, like the prefrontal cortex, and temporal regions, to the caudate nucleus and the putamen [Selemon and Goldman‐Radic, 1985; Yeterian and Pandya, 1998], whereas the limbic circuit projects from the limbic cortices, the amygdala and the hippocampus to the ventral striatum [Graybiel et al., 1994]. Deep brain stimulation of the subthalamic nucleus could partly restore physiologic glucose consumption in limbic and associative projection territories of the basal ganglia [Hilker et al., 2004]. We also detected ReHo changes in these circuits (Fig. 2, Table II). Compared to sensorimotor circuits, how the changes in the associative and limbic circuits correlate to clinical manifestations in PD has been much less investigated. However, it has been revealed that some nonmotor signs in PD, like cognitive decline, could be linked to the reduced 18F‐fluorodopa uptake in the associative circuit [Rinne et al., 2000], as well as in the limbic circuit [Ito et al., 2002].
Besides the changes in the striatal‐thalamo‐cortical loops, we further observed increased ReHo in the bilateral cerebellum in PD (see Fig. 2). The cerebellum and basal ganglia have distinct loops connecting with largely overlapping cortical areas [Middleton and Strick, 2000], and the cerebellum is known to influence motor and cognitive operations via the cerebello‐thalamo‐cortical circuits [Middleton and Strick, 2001]. Recently, animal studies revealed that the cerebellum communicates with basal ganglia via a disynaptic pathway [Hoshi et al., 2005; Ichinohe et al., 2000]. Hyperactivation of the cerebellum has been observed [Catalan et al., 1999; Rascol et al., 1997; Wu and Hallett, 2005; Yu et al., 2007], and deep brain stimulation of the subthalamic nucleus could suppress cerebellar hypermetabolism of glucose [Hilker et al., 2004]. It has been proposed that the hyperactivation in the cerebellum in PD is a functional compensation for the defective basal ganglia [Catalan et al., 1999; Lewis et al., 2007; Rascol et al., 1997; Wu and Hallett, 2005].
In the current study, we used levodopa to examine whether the observed ReHo changes in PD are due to impaired dopamine system [Buhman et al., 2003; Haslinger et al., 2001]. Levodopa increased ReHo in several regions including the basal ganglia and SMA, and decreased ReHo in some other areas, like the cerebellum and SM1 (Fig. 3 and Table III). These findings suggest that changes in ReHo in these regions is secondary to dopamine deficiency in PD. Administration of levodopa relatively restores normal pattern of neuronal activity in the striatal‐cortical loops, and, as a consequence, the compensatory effect of other regions, such as the cerebellum, is not necessary.
Additionally, we found that ReHo was negatively correlated with UPDRS in the basal ganglia, and positively correlated with UPDRS in the cerebellum (Fig. 4 and Table IV). These observations suggest that as the disorder progresses, neuronal activity in the basal ganglia in the resting state becomes more abnormal; at the mean time, the compensatory effect in the cerebellum is more significant. Progression of the disease is characterized by dopamine loss; so, this finding is in keeping with the effect of dopaminergic therapy. Whether the method of ReHo can be used to detect early neuronal changes, or monitor disease progression is worth further investigations.
We did not find significant difference of cardiac or respiratory rates between patients and normal subjects, and oral intake of 250 mg Madopar did not have obvious influence on cardiac and respiratory rates. However, difference of cardiac and respiratory rates might still exist between patients and controls during fMRI scanning. At a TR of 2,000 ms, the cardiac and respiratory fluctuation effects might be aliased into the low frequency BOLD MR signal fluctuations [Dagli et al., 1999; Lowe et al., 1998]. The low‐pass filtering could not remove the effects of these physiological noises completely. These aliasing effects may reduce the specificity of our findings, or even might further confound the detected differences between the two groups. In the future, by simultaneously recording the respiratory and cardiac cycle during the acquisition of whole‐brain imaging data, or by using shorter TR (e.g., 400 ms) and focusing on some specific regions, these physiological effects may be excluded.
In conclusion, we demonstrate that the pattern of neuronal activity in the resting state is changed in patients with PD. This change is due to dopamine deficiency, and becomes more significant as the disorder progresses. The different neuronal activity at the baseline state should be considered in explaining findings in the task‐performing state in PD. The simplicity and noninvasiveness of this method make it as a potential tool to measure the severity and monitor the progression of PD.
Acknowledgements
This work was supported by the National Science Foundation of China, Grant No. 30570530.
REFERENCES
- Alexander GE,DeLong MR,Strick PL ( 1986): Parallel organization of functionally segregated circuits linking basal ganglia and cortex. Annu Rev Neurosci 9: 357–381. [DOI] [PubMed] [Google Scholar]
- Alexander GE,Crutcher MD,DeLong MR ( 1990): Basal ganglia‐thalamocortical circuits: Parallel substrates for motor, oculomotor, “prefrontal” and “limbic” functions. Prog Brain Res 85: 119–146. [PubMed] [Google Scholar]
- Biswal B,Yetkin FZ,Haughton VM,Hyde JS ( 1995): Functional connectivity in the motor cortex of resting human brain using echo‐planar MRI. Magn Reson Med 34: 537–541. [DOI] [PubMed] [Google Scholar]
- Brooks DJ,Ibanez V,Sawle GV,Quinn N,Lees AJ,Mathias CJ,Bannister R,Marsden CD,Frackowiak RS ( 1990): Differing patterns of striatal 18F‐dopa uptake in Parkinson's disease, multiple system atrophy, and progressive supranuclear palsy. Ann Neurol 28: 547–555. [DOI] [PubMed] [Google Scholar]
- Buhmann C,Glauche V,Sturenburg HJ,Oechsner M,Weiller C,Büchel C ( 2003): Pharmacologically modulated fMRI—Cortical responsiveness to levodopa in drug‐nave hemiparkinsonian patients. Brain 126: 451–461. [DOI] [PubMed] [Google Scholar]
- Cao Q,Zang Y,Sun L,Sui M,Long X,Zou Q,Wang Y ( 2006): Abnormal neural activity in children with attention deficit hyperactivity disorder: A resting‐state functional magnetic resonance imaging study. Neuroreport 17: 1033–1036. [DOI] [PubMed] [Google Scholar]
- Catalan MJ,Ishii K,Honda M,Samii A,Hallett M ( 1999): A PET study of sequential finger movements of varying length in patients with Parkinson's disease. Brain 122: 483–495. [DOI] [PubMed] [Google Scholar]
- Dagli MS,Ingeholm JE,Haxby JV ( 1999): Localization of cardiac‐induced signal change in fMRI. NeuroImage 9: 407–415. [DOI] [PubMed] [Google Scholar]
- Deiber MP,Passingham RE,Colebatch JG,Friston KJ,Nixon PD,Frackowiak RS ( 1991): Cortical areas and the selection of movement: A study with positron emission tomography. Exp Brain Res 84: 393–402. [DOI] [PubMed] [Google Scholar]
- DeLong MR ( 1990): Primate model of movement disorders of the basal ganglia origin. Trends Neurosci 13: 281–285. [DOI] [PubMed] [Google Scholar]
- D'Esposito M,Deouell LY,Gazzaley A ( 2003): Alterations in the BOLD fMRI signal with ageing and disease: A challenge for neuroimaging. Nat Rev Neurosci 4: 863–872. [DOI] [PubMed] [Google Scholar]
- Eckert T,Barnes A,Dhawan V,Frucht S,Gordon MF,Feigin AS,Eidelberg D ( 2005): FDG PET in the differential diagnosis of parkinsonian disorders. NeuroImage 26: 912–921. [DOI] [PubMed] [Google Scholar]
- Eidelberg D,Moeller JR,Ishikawa T,Dhawan V,Spetsieris P,Chaly T,Robeson W,Dahl JR,Margouleff D ( 1995): Assessment of disease severity in parkinsonism with fluorine‐18‐fluorodeoxyglucose and PET. J Nucl Med 36: 378–383. [PubMed] [Google Scholar]
- Flaherty AW and Graybiel AM ( 1993): Two input systems for body representations in the primate striatal matrix: Experimental evidence in the squirrel monkey. J Neurosci 13: 1120–1137. [DOI] [PMC free article] [PubMed] [Google Scholar]
- Fukuda M,Edwards C,Eidelberg D ( 2001): Functional brain networks in Parkinson's disease. Parkinsonism Relat Disord 8: 91–94. [DOI] [PubMed] [Google Scholar]
- Grafton ST ( 2004): Contributions of functional imaging to understanding parkinsonian symptoms. Curr Opin Neurobiol 14: 715–719. [DOI] [PubMed] [Google Scholar]
- Grafton ST,Mazziotta JC,Presty S,Friston KJ,Frackowiak RS,Phelps ME ( 1992): Functional anatomy of human procedural learning determined with regional cerebral blood flow and PET. J Neurosci 12: 2542–2548. [DOI] [PMC free article] [PubMed] [Google Scholar]
- Grafton ST,Turner RS,Desmurget M,Bakay R,Delong M,Vitek J,Crutcher M ( 2006): Normalizing motor‐related brain activity: Subthalamic nucleus stimulation in Parkinson disease. Neurology 66: 1192–1199. [DOI] [PubMed] [Google Scholar]
- Graybiel AM,Aosaki T,Flaherty AW,Kimura M ( 1994): The basal ganglia and adaptive motor control. Science 265: 1826–1831. [DOI] [PubMed] [Google Scholar]
- Greicius MD,Krasnow B,Reiss AL,Menon V ( 2003): Functional connectivity in the resting brain: a network analysis of the default mode hypothesis. Proc Natl Acad Sci U S A 100: 253–258. [DOI] [PMC free article] [PubMed] [Google Scholar]
- Halsband U,Freund HJ ( 1990): Premotor cortex and conditional motor learning in man. Brain 113: 207–222. [DOI] [PubMed] [Google Scholar]
- Halsband U,Ito N,Tanji J,Freund HJ ( 1993): The role of premotor cortex and the supplementary motor area in the temporal control of movement in man. Brain 116: 243–266. [DOI] [PubMed] [Google Scholar]
- Haslinger B,Erhard P,Kampfe N,Boecker H,Rummeny E,Schwaiger M,Conrad B,Ceballos‐Baumann AO ( 2001): Event‐related functional magnetic resonance imaging in Parkinson's disease before and after levodopa. Brain 124: 558–570. [DOI] [PubMed] [Google Scholar]
- He Y,Wang L,Zang YF,Tian LX,Zhang XQ,Li KC,Jiang TZ ( 2007): Regional coherence changes in the early stages of Alzheimer's disease: A combined structural and resting‐state functional MRI study. NeuroImage 35: 488–500. [DOI] [PubMed] [Google Scholar]
- Hilker R,Voges J,Weisenbach S,Kalbe E,Burghaus L,Ghaemi M,Lehrke R,Koulousakis A,Herholz K,Sturm V,Heiss WD ( 2004): Subthalamic nucleus stimulation restores glucose metabolism in associative and limbic cortices and in cerebellum: Evidence from a FDG‐PET study in advanced Parkinson's disease. J Cereb Blood Flow Metab 24: 7–16. [DOI] [PubMed] [Google Scholar]
- Hoehn MM and Yahr MD ( 1967): Parkinsonism: Onset, progression and mortality. Neurology 17: 427–442. [DOI] [PubMed] [Google Scholar]
- Hoshi E,Tremblay L,Feger J,Carras PL,Strick PL ( 2005): The cerebellum communicates with the basal ganglia. Nat Neurosci 8: 1491–1493. [DOI] [PubMed] [Google Scholar]
- Ichinohe N,Mori F,Shoumura K ( 2000): A di‐synaptic projection from the lateral cerebellar nucleus to the laterodorsal part of the striatum via the central lateral nucleus of the thalamus in the rat. Brain Res 880: 191–197. [DOI] [PubMed] [Google Scholar]
- Ito K,Nagano‐Saito A,Kato T,Arahata Y,Nakamura A,Kawasumi Y,Hatano K,Abe Y,Yamada T,Kachi T,Brooks DJ ( 2002): Striatal and extrastriatal dysfunction in Parkinson's disease with dementia: A 6‐[(18)]fluoro‐l‐dopa PET study. Brain 125: 1358–1365. [DOI] [PubMed] [Google Scholar]
- Jahanshahi M,Jenkins IH,Brown RG,Marsden CD,Passingham RE,Brooks DJ ( 1995): Self‐initiated versus externally triggered movements. I. An investigation using measurement of regional cerebral blood flow with PET and movement‐related potentials in normal and Parkinson's disease subjects. Brain 118: 913–933. [DOI] [PubMed] [Google Scholar]
- Jenkins IH,Jahanshahi M,Jueptner M,Passingham RE,Brooks DJ ( 2000): Self‐initiated versus externally triggered movements. II. The effect of movement predictability on regional cerebral blood flow Brain 123: 1216–1228. [DOI] [PubMed] [Google Scholar]
- Kendall M,Gibbons JD ( 1990). Rank Correlation Methods. Oxford: Oxford University Press. [Google Scholar]
- Kermadi I,Liu Y,Tempini A,Rouiller EM ( 1997): Effects of reversible inactivation of the supplementary motor area (SMA) on unimanual grasp and bimanual pull and grasp performance in monkeys. Somatosens Mot Res 14: 268–280. [DOI] [PubMed] [Google Scholar]
- Lang AE and Fahn S ( 1989). Assessment of Parkinson's disease In: Munsat TL,editor. Quantification of Neurological Deficit. Boston: Butterworths; pp 285–309. [Google Scholar]
- Lewis MM,Slagle CG,Smith AB,Truong Y,Bai P,McKeown MJ,Mailman RB,Belger A,Huang X ( 2007): Task specific influences of Parkinson's disease on the striato‐thalamo‐cortical and cerebello‐thalamo‐cortical motor circuitries. Neuroscience 147: 224–235. [DOI] [PMC free article] [PubMed] [Google Scholar]
- Liu H,Liu Z,Liang M,Hao Y,Tan L,Kuang F,Yi Y,Xu L,Jiang TZ ( 2006): Decreased regional homogeneity in schizophrenia: A resting state functional magnetic resonance imageing study. Neuroreport 17: 19–22. [DOI] [PubMed] [Google Scholar]
- Logothetis NK,Pauls J,Augath M,Trinath T,Oeltermann A ( 2001): Neurophysiological investigation of the basis of the fMRI signal. Nature 412: 150–157. [DOI] [PubMed] [Google Scholar]
- Lowe MJ,Mock BJ,Sorenson JA ( 1998): Functional connectivity in single and multislice echoplanar imaging using resting‐state fluctuations. NeuroImage 7: 119–132. [DOI] [PubMed] [Google Scholar]
- Lu H,Zuo Y,Gu H,Waltz JA,Zhan W,Scholl CA,Rea W,Yang Y,Stein EA ( 2007): Synchronized delta oscillations correlate with the resting‐state functional MRI signal. Proc Natl Acad Sci USA 104: 18265–18269. [DOI] [PMC free article] [PubMed] [Google Scholar]
- Middleton FA,Strick PL ( 2000): Basal ganglia and cerebellar loops: Motor and cognitive circuits. Brain Res Brain Res Rev 31: 236–250. [DOI] [PubMed] [Google Scholar]
- Middleton FA,Strick PL ( 2001): Cerebellar projections to the prefrontal cortex of the primate. J Neurosci 21: 700–712. [DOI] [PMC free article] [PubMed] [Google Scholar]
- Mink JW ( 1996): The basal ganglia: Focused selection and inhibition of competing motor programs. Prog Neurobiol 50: 381–425. [DOI] [PubMed] [Google Scholar]
- Oldfield RC ( 1971): The assessment and analysis of handedness: The Edinburgh inventory. Neuropsychologia 9: 97–113. [DOI] [PubMed] [Google Scholar]
- Pelled G,Goelman G ( 2004): Different physiological MRI noise between cortical layers. Magn Reson Med 52: 913–916. [DOI] [PubMed] [Google Scholar]
- Pelled G,Bergman H,Ben‐Hur T,Goelman G ( 2005): Reduced basal activity and increased functional homogeneity in sensorimotor and striatum of a Parkinson's disease rat model: a functional MRI study. Eur J Neurosci 21: 2227–2232. [DOI] [PubMed] [Google Scholar]
- Playford ED,Jenkins IH,Passingham RE,Nutt J,Frackowiak RS,Brooks DJ ( 1992): Impaired mesial frontal and putamen activation in Parkinson's disease: A positron emission tomography study. Ann Neurol 32: 151–161. [DOI] [PubMed] [Google Scholar]
- Raichle ME,MacLeod AM,Snyder AZ,Powers WJ,Gusnard DA,Shulman GL ( 2001): A default mode of brain function. Proc Natl Acad Sci USA 98: 676–682. [DOI] [PMC free article] [PubMed] [Google Scholar]
- Rascol O,Sabatini U,Fabre N,Brefel C,Loubinoux I,Celsis P,Senard JM,Montastruc JL,Chollet F ( 1997): The ipsilateral cerebellar hemisphere is overactive during hand movements in akinetic parkinsonian patients. Brain 120: 103–110. [DOI] [PubMed] [Google Scholar]
- Rinne JO,Portin R,Ruottinen H,Nurmi E,Bergman J,Haaparanta M,Solin O ( 2000): Cognitive impairment and the brain dopaminergic system in Parkinson's disease. [18F]fluorodopa positron emission tomographic study. Arch Neurol 57: 470–475. [DOI] [PubMed] [Google Scholar]
- Rowe J,Stephan KE,Friston K,Frackowiak R,Lees A,Passingham R ( 2002): Attention to action in Parkinson's disease: Impaired effective connectivity among frontal cortical regions. Brain 125: 276–289. [DOI] [PubMed] [Google Scholar]
- Sabatini U,Boulanouar K,Fabre N,Martin F,Carel C,Colonnese C,Bozzao L,Berry I,Montastruc JL,Chollet F,Rascol O ( 2000): Cortical motor reorganization in akinetic patients with Parkinson's disease: A functional MRI study. Brain 123: 394–403. [DOI] [PubMed] [Google Scholar]
- Samuel M,Ceballos‐Baumann AO,Blin J,Uema T,Boecker H,Passingham RE,Brooks DJ ( 1997): Evidence for lateral premotor and parietal overactivity in Parkinson's disease during sequential and bimanual movements. A PET study. Brain 120: 963–976. [DOI] [PubMed] [Google Scholar]
- Selemon LD and Goldman‐Radic PS ( 1985): Longitudinal topography and interdigitation of cortico‐striatal projects in the rhesus monkey. J Neurosci 5: 776–794. [DOI] [PMC free article] [PubMed] [Google Scholar]
- Shibasaki H,Sadato N,Lyshkow H,Yonekura Y,Honda M,Nagamine T,Suwazono S,Magata Y,Ikeda A,Miyazaki M ( 1993): Both primary motor cortex and supplementary motor area play an important role in complex finger movement. Brain 116: 1387–1398. [DOI] [PubMed] [Google Scholar]
- Smith SM ( 2002): Fast robust automated brain extraction. Hum Brain Mapp 17: 143–155. [DOI] [PMC free article] [PubMed] [Google Scholar]
- Talairach J and Tournoux P ( 1988). Co‐Planar Stereotaxic Atlas of the Human Brain. Stuttgart,Germany: Thieme. [Google Scholar]
- Tanji J and Hoshi E ( 2001): Behavioral planning in the prefrontal cortex. Curr Opin Neurobiol 11: 164–170. [DOI] [PubMed] [Google Scholar]
- Thobois S,Jahanshahi M,Pinto S,Frackowiak R,Limousin‐Dowsey P ( 2004): PET and SPECT functional imaging studies in Parkinsonian syndromes: From the lesion to its consequences. Neuroimage 23: 1–16. [DOI] [PubMed] [Google Scholar]
- Wu T,Hallett M ( 2005): A functional MRI study of automatic movements in patients with Parkinson's disease. Brain 128: 2250–2259. [DOI] [PubMed] [Google Scholar]
- Wu T,Zang Y,Wang L,Long X,Li K,Chan P ( 2007): Normal aging decreases regional homogeneity of the motor areas in the resting state. Neurosci Lett 423: 189–193. [DOI] [PubMed] [Google Scholar]
- Yeterian EH and Pandya DN ( 1998): Corticostriatal connections of the superior temporal region in rhesus monkeys. J Comp Neurol 399: 384–402. [PubMed] [Google Scholar]
- Yu H,Sternad D,Corcos DM,Vaillancourt DE ( 2007): Role of hyperactive cerebellum and motor cortex in Parkinson's disease. Neuroimage 35: 222–233. [DOI] [PMC free article] [PubMed] [Google Scholar]
- Zang YF,Jiang TZ,Lu YL,He Y,Tian LX ( 2004): Regional homogeneity approach to fMRI data analysis. NeuroImage 22: 394–400. [DOI] [PubMed] [Google Scholar]
- Zhu CZ,Zang YF,Liang M,Tian LX,He Y,Sui MQ,Jiang TZ ( 2005). Discriminative analysis of brain function at resting‐state for attention deficit/hyperactivity disorder In: Ducan J,Gerig G, editors. MICCAI 2005, LNCS 3750. Berlin: Springer‐Verlag; pp 468–475. [DOI] [PubMed] [Google Scholar]