

Abstract
Evidence suggests that obsessive compulsive disorder (OCD) is associated with an overactive error control system. A key role in error detection and control has been ascribed to the fronto‐cingulate system. However, the exact functional interplay between the single components of this network in OCD is largely unknown. Therefore, the present study combined a univariate data analysis and effective connectivity analysis using dynamic causal modeling (DCM) to examine error control in 21 patients with OCD and 21 matched healthy controls. All subjects performed an adapted version of the Stroop color‐word task while undergoing fMRI scans. Enhanced activation in the fronto‐cingulate system could be detected in OCD patients during the incongruent task condition. Additionally, task‐related modulation of effective connectivity from the dorsal ACC to left DLPFC was significantly stronger in OCD patients. These findings are consistent with an overactive error control system in OCD subserving suppression of prepotent responses during decision‐making. Hum Brain Mapp, 2010. © 2010 Wiley‐Liss, Inc.
Keywords: obsessive compulsive disorder, error control, fMRI, Stroop task, functional connectivity, dynamic causal modeling
INTRODUCTION
Several lines of evidence are suggesting that altered cognitive control is associated with obsessive compulsive disorder (OCD). This alteration includes error monitoring, decision making, as well as preparation of adequate responses and is probably related to the clinical appearance of obsessions and compulsions. It has been proposed that in particular increased error sensitivity and a hyperactive error and conflict monitoring system are a central characteristic of OCD [Fitzgerald et al., 2005; Ursu et al., 2003]. The error control system monitors events and generates error signals if the events conflict with an individual's internal standards or goals. Electrophysiological studies have demonstrated error‐related negativity as a component of the event‐related brain potential (ERP) to be associated with monitoring action and detecting errors [Hajcak and Simons, 2002]. Dipole modeling suggested that the locus of the enhancement corresponded to medial frontal regions, possibly the anterior cingulate cortex (ACC) [Gehring et al., 2000]. Moreover, the fronto‐cingulate system as a whole has been shown to play a central role in cognitive control, error detection, and response inhibition.
Functional imaging studies have provided evidence for hyperactivity in fronto‐cingulate circuits subserving action‐monitoring processes in patients with OCD [Maltby et al., 2005]. Functional MRI studies demonstrated hyperactivity both in the dorsal [Ursu et al., 2003] and the rostral [Fitzgerald et al., 2005] part of the ACC in patients with OCD. However, the exact functional role of the individual components of this fronto‐cingulate network is still unresolved and under intensive examination [Ullsperger and von Cramon, 2004].
The Stroop Color Word Test (SCWT) imposes particular demands on error monitoring, response selection and suppression of inadequate responses [Banich et al., 2001; Cohen et al., 1990]. The task, therefore, lends itself to functional imaging studies targeting altered levels of cognitive control. Studies in healthy subjects employing the Stroop task demonstrated close fronto‐cingulate interactions [Gehring and Knight, 2000; Leung et al., 2000; Mead et al., 2002]. In patients with OCD performing the emotional version of the Stroop‐conflict task, Van den Heuvel et al. [ 2005] demonstrated increased dorsal ACC activation.
Although abundant literature exists with regard to functional segregation of different brain areas involved in cognitive control processes, information about interactions between defined areas has been acquired only indirectly. Therefore, to further examine concerted network operations, the analysis of cerebral activity has more recently moved to the search for connectivity within dynamic networks [Deco et al., 2008] and dynamic causal modeling (DCM) has been introduced for addressing effective connectivity [Friston et al., 2003; Penny et al., 2004b].
The present study aimed to explicitly model effective connectivity within the network subserving the Stroop task in patients with OCD and healthy controls. The analysis was performed using DCM and the selected model aimed to describe propagated information processing via primary sensory visual input to higher prefrontal and midfrontal regions. This dynamic causal modeling strategy represents an advantage as compared to other linear modeling approaches based on instantaneous relationships, such as psychophysiological interactions (PPI) or structural equation modeling (SEM). DCM is particularly suitable to model event‐related paradigms, such as the Stroop task, where a clear driving sensory input can be defined [Schlösser et al., 2006, 2007, 2008].
Our hypotheses were guided by the assumption that OCD is related to an overactive control network with enhanced functional activity and effective connectivity of the underlying fronto‐cingulate networks. Previous functional imaging studies in OCD patients suggested hyperactivity of the dorsal ACC during conflict processing in task such as the continuous performance task [Ursu et al., 2003] or a speeded reaction time task [Maltby et al., 2005]. Thus, we expected stronger BOLD signal in patients with OCD in the dorsal ACC and lateral prefrontal areas, predominantly during the incongruent condition. We also hypothesized that dorsal ACC activity interferes with the Stroop task performance in OCD patients. Concerning the DCM analysis we expected to find altered connectivity between the dorsal ACC and lateral PFC in patients with OCD consistent with an enhanced level of cognitive control exerted by the dorsal ACC. We further expected this interaction to be related to psychopathology severity ratings in terms of higher obsessive‐compulsive symptoms being related to higher connectivity.
METHODS
Patients and Controls
A total of 21 patients meeting the DSM‐IV criteria for OCD according to the structured clinical interview (SCID) for DSM‐IV Axis I disorders were recruited from the inpatient service of a psychiatric university hospital. Patients with current comorbid Axis I disorder (according to SCID) or with past or current neurological disorders were excluded from this study. Only subjects who had no history of prior or current disturbances of color vision were included. There were a total of 16 female and 5 male subjects in the sample of OCD patients as well as in the sample of control subjects, respectively.
Nine OCD patients were drug‐naive and 10 patients were free of medication for an average of 5.3 days (SD = 3.4, range = 2–12). Two patients were medicated with fluoxetine or sertraline at the time of the fMRI scans. Twenty‐one healthy control subjects, matched for age and education, were recruited by local newspaper advertisement and screened for psychiatric or neurological diseases. Subjects with past or current neurological or psychiatric diseases and/or first‐degree relatives with axis I psychiatric disorders were excluded from the study.
To assess the general psychopathology, all healthy controls performed self ratings and evaluation using the symptom checklist‐90‐R [Franke, 1995]. The OCD patients had a mean age of 31.3 (SD = 10.2), healthy controls were 28.8 (SD = 8.3) years old, on average. Mean duration of school education was 11.1 (SD = 1.0) for OCD patients and 11.6 (SD = 0.8) years for healthy controls. The mean Yale‐Brown Obsessive Compulsive Scale (Y‐BOCS) sum score was 20.7 (SD = 6.5) and all patients were experiencing significant illness at the time of the study. The mean Y‐BOCS obsession score was 10.2 (SD = 4.0) and the mean Y‐BOCS compulsion score was 10.5 (SD = 3.6). The depression severity as assessed with Hamilton Rating Scale of Depression (HRSD) was 7.9 (SD = 3.2) indicating no clinically relevant depressive symptoms. Mean duration of illness was 8.6 years (SD = 7.8). Patients had an average logical IQ of 105.2 (SD = 9.4).
All participants were right‐handed, according to the modified version of Annets handedness inventory [Annett, 1967] and provided written informed consent prior to participating in the study. The study protocol was in compliance with the Declaration of Helsinki and approved by the Ethics Committee of the University of Jena.
Neuropsychological Paradigms
The Stroop task was presented in an event‐related design and consisted of two conditions: a congruent and an incongruent condition. In the congruent condition, color words were presented in the color denoted by the corresponding word (e.g., the word “red” shown in red); in the incongruent condition, color words were displayed in one of three colors not denoted by the word (e.g., the word “green” shown in red). The target stimulus was presented in the center of the display screen. Two possible answers (color words in black type) were presented below it (in the lower visual field) to minimize contextual memory demand. The subjects had to indicate the type of color by pressing one of two buttons (with index or middle finger), which corresponded spatially to both possible answers. Correct answers were counterbalanced on the right and left sides of the display.
Stimuli were presented in 36 congruent and 36 incongruent combinations of four color words “red,” “green,” “yellow,” and “blue” written in the German language and corresponding colors were presented in a pseudorandom sequence in two sessions. No colors were repeated consecutively to avoid positive priming effects and no color words in the prior stimulus presentation were repeated as type color in the following stimulus to avoid negative priming effects. Stimulus presentation time was 1,500 ms with an interstimulus interval of 10.5 s to allow the hemodynamic response to return to baseline. Additionally, we introduced a temporal jitter to enhance the temporal resolution [Miezin et al., 2000]. The presentation of the stimuli was varied relative to the onset of a scan in 12 steps for 182 ms. This jitter was shifted over the repetition time three times per condition.
For the present study we adopted the Stroop task, which uses button press response instead of vocalization. This particular paradigm design enabled a better control of performance in comparison to a vocal answer and minimized movement‐related artifacts associated with speaking from the inside of a scanner.
The Stroop task was implemented using Presentation software (http://nbs.neuro-bs.com/) running on a PC which was connected to a video projector. The visual stimuli were projected on to a transparent screen inside of the scanner tunnel which could be viewed by the subject through a mirror system mounted on top of the MRI head coil. The subjects' responses were registered by an MRI‐compatible fiber optic response device (Lightwave Medical Industries, Canada) with two buttons on a keypad for the right hand. On the day of the fMRI measurement all subjects practiced the Stroop task outside of the scanner. The participating subjects were given a standardized oral instruction before pretraining and the actual fMRI scanning session. This instruction was supported by the presentation of color printouts of visual stimulus material used as examples for the task trials. None of the subjects exhibited difficulties performing the task in the pretraining phase and no performance deficits suggestive of existing color vision disturbances were observable.
FMRI Procedure
The functional data were collected on a 1.5 T whole‐body system (Magnetom Vision plus, Siemens Healthcare, Erlangen, Germany) equipped with a CP transmit/receive head coil. Head immobilization was established by foam pads within the head coil. A series of 440 T2*‐weighted images were obtained using a gradient‐echo, echo planar (EPI) sequence (TR = 2,000 ms, TE = 60 ms, flip angle = 90°) with 19 contiguous transverse slices of 5 mm thickness in two sessions (220 scans in each session). To optimize the nature of the fMRI data for dynamic causal modeling a continuous acquisition sequence was used. Matrix size was 64 × 64 pixels with in‐plane resolution of 3.75 × 3.75 mm2 and field of view of 240 mm. Additionally, high‐resolution anatomical T1‐weighted volume scans were obtained in sagittal orientation (TR = 15 ms, TE = 5 ms, flip angle = 30° and field of view of 256 mm) with isotropic resolution of 1 mm3.
Univariate Statistical Analysis
For image processing and statistical analyses we used the SPM5 software (http://www.fil.ion.ucl.ac.uk/spm). The first four images per session were discarded to obtain steady‐state tissue magnetization. The remaining 216 images of each session were corrected for differences in time acquisition by sinc interpolation, realigned at the first image of each session and normalized to the Montreal Neurological Institute (MNI, Montreal, Canada) reference brain. The data were smoothed with a Gaussian kernel (10 mm, full‐width at half‐maximum) and were subsequently analyzed voxel‐wise within the GLM to calculate statistical parametric maps of t‐statistics for condition‐specific effects. Prior to this analysis the data were high‐pass filtered with a cut‐off period of 128 s and corrected for serial correlations by means of a first order auto‐regression term. A fixed effect model at a single‐subject level was performed to create contrast images of parameter estimates, which were then entered into a second‐level analysis. In the second level statistic we set up an ANOVA design with a between‐subjects factor group (patients vs. controls) and a within‐subjects factor task (congruent vs. incongruent condition). We performed an additional analysis in which we used a covariate for modeling the linear increase or decrease of activation over time in the dorsal ACC and the DLPFC to clarify whether establishing control might alter activation during the course of the scan.
We further correlated the Stroop interference score with the individual contrast images of the incongruent condition to reveal brain areas related to the Stroop conflict. Response times in the Stroop task were analyzed with SPSS 17.0 (http://www.spss.com) using a mixed effects two‐way analysis of variance (ANOVA) with one between‐subject factor group (OCD patients vs. healthy controls) and one within‐subject factor condition (congruent vs. incongruent). The response accuracy was analyzed nonparametrically employing Mann‐Whitney U Test for testing differences in both Stroop conditions between groups and with Wilcoxon‐Test for testing differences between conditions.
Dynamic Causal Modeling
For the connectivity analysis, dynamic causal modeling [Friston et al., 2003; Mechelli et al., 2003], as implemented in the SPM8 software package, was employed. The aim of dynamic causal modeling (DCM) is to estimate, and make inferences about the influence that one neural system exerts over another and how this is affected by the experimental context. For a combined hemodynamic and neuronal model, different priors are implemented to enable Bayesian parameter estimation. Given the posterior parameter estimates and the known input functions, the neuronal state equations can be used to compute a bilinear approximation to the hidden neuronal dynamics [Friston et al., 2003].
Model Definition
The nodes for the model were identified according to the following rationale: Previous studies and the present univariate findings demonstrated the central role of the dorsal ACC to DLPFC interaction for the cognitive control network [Cohen et al., 2000; Erickson et al., 2004; Kerns et al., 2004; MacDonald et al., 2000]. It could be demonstrated that this functional network is related to decision making under conflict. Functional connectivity of the dorsal ACC to DLPFC pathway was correlated with the Stroop interference effect. According to our primary hypothesis of an overactive error control system in OCD we included the nodes of this essential network bilaterally in our model.
In addition, following previous results of the DCM analysis in healthy controls and patients with major depression [Schlösser et al., 2008] we included both dorsal ACC and rostral ACC as nodes of the target network. This would allow us to examine interactions between these two subcomponents of the ACC and relate the previous results to the present findings for OCD. In addition, according to previous evidence suggesting interhemispheric connectivity [Mallet et al., 1998] bidirectional connections between the left and right DLPFC were included into the model. The left and right primary visual cortices (BA 17/18) were modeled as the driving input.
In addition to these a priori neuroanatomical and neurofunctional hypotheses with regard to the involvement of the specific regions, ROI placement was informed by the results of the univariate SPM analysis in that the choice of coordinates was guided by overall group maxima.
The final areas and mean coordinates of local maxima resulting from this ROI definition strategy as outlined above are: The left (BA 17/18, x = −28, y = −84, z = −11) and the right primary visual cortex (BA 17/18, x = 27, y = −86, z = −8) according to WFU‐Pickatlas (http://www.fmri.wfubmc.edu/), rostral ACC (BA 32, x = 5, y = 53, z = 0), dorsal ACC (BA 24′, x = −3, y = 5, z = 39), left (BA 9, x = −49, y = 14, z = 26) and right DLPFC (BA 9, x = 43, y = 34, z = 32).
ROIs were drawn around these coordinates including all voxels within a 6‐mm radius. Regional data P were then extracted from all voxels within these ROIs and the first eigenvariate was calculated via singular value decomposition (SVD) and used for further data processing. This denoising technique is equivalent to using the first principal component time‐series of the ROIs. All time‐series were adjusted for confounds (e.g., global mean, low‐frequency components). Details of this approach have been described earlier [Buchel and Friston, 1997; Fletcher et al., 1999; Schlösser et al., 2003].
Intrinsic Connectivity Pattern
The intrinsic connectivity pattern was modeled according to the following considerations:
The stimulation of the primary visual cortex (V1) was regarded as the driving input C for the model. The stimulus function U, i.e., the visual presentation of color‐word stimuli entered the dynamic causal model through the sensory area, i.e. primary visual cortex (V1). The data matrix A was then modeling the propagation of the signal through the remaining network by means of linear differential equations between the nodes. Assuming that the PFC receives visual stimulus material from the posterior sensory areas, we modeled unidirectional input from V1 to the DLPFC. This was analogous to the approach chosen in Etkin et al. [ 2006] where the authors include the driving input directly to prefrontal cortical regions without mediation by V1. Strong evidence points toward close functional interplay between dorsal ACC and the PFC [Cohen et al., 2000; Erickson et al., 2004; Kerns et al., 2004; MacDonald et al., 2000]. Both DLPFC and VLPFC are integral parts of the fronto‐cingulate network subserving the Stroop task. Previous studies suggest that both the DLPFC and the VLPFC are involved in cognitive control [Blasi et al., 2006; Kondo et al., 2004] and cognitive interference [Yoon et al., 2007]. However, to maintain a low complexity level of the model network, we restricted the included PFC areas to the DLPFC. DCM can be embedded in the framework of state space modeling [Schlösser et al., 2007]. Thus we intended to provide a clear “driving” input for the dynamic system of linear differential equations constituting this state space. Whereas V1 served as input, DLPFC was regarded as the “executive” control area.
The ACC was modeled as a higher cognitive control unit responsible for error detection and conflict resolution. Consequently, we did not include direct interactions between V1 and dorsal or rostral ACC since we did not assume direct input from V1 to the ACC in the context of this concept. This model follows previous conceptualizations of selective attention where stimulus material is received by units processing information about task demands (PFC) and cognitive control is exerted by nodes responsible for conflict monitoring (ACC) [Cohen et al., 2000]. Since the prefrontal heteromodal association areas are densely interconnected with the dorsal ACC reciprocal connections were modeled between all these nodes in the network. Given the defined neuroanatomical connection between dorsal and rostral ACC via the cingulate bundle, bidirectional interactions between the dorsal and the rostral portion of the ACC were included.
Model Comparison
Bayesian model selection (BMS) was performed as part of a systematic model comparison process in which alternative models were evaluated [Penny et al., 2004a]. BMS was based upon a random effects model that accounts for between‐subject heterogeneity in terms of which model best explained the measured data. This random effects approach has been suggested as the method of choice for clinical studies [Stephan et al., 2009a, b].
In the framework of variational Bayes, parameters of the Dirichlet distribution are estimated, and the ensuing probabilities define a multinomial distribution. Model selection was carried out for both groups separately. Dirichlet parameter estimates α, the conditional expectations of model probabilities 〈rk〉, and the exceedance probabilities φk were presented to rank models at the group level.
Alternative Intrinsic Models
With regard to the general pattern of intrinsic connections, we were interested within which areas of the network the existing connectivity had its major focus. To systematically investigate this aspect we compared different models with a different architecture of intrinsic connections. Based on the univariate findings, these models included: Model 01 intrinsic connections only between left DLPFC and dorsal ACC; Model 02 intrinsic connections only between right DLPFC and dorsal ACC; Model 03 connections between dorsal ACC and both left and right DLPFC; Model 04 including in addition to Model 03 connections between dorsal ACC and rostral ACC; Model 05 including in addition to Model 04 direct interhemispheric connections between left and right DLPFC (Fig. 1).
Figure 1.
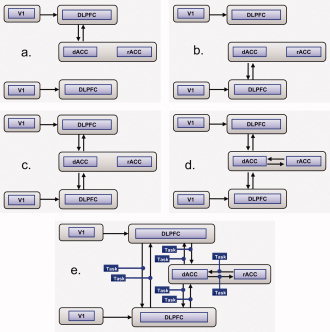
Alternative models for connections considered during model selection: (a) Model 01 with intrinsic connections between left DLPFC and dorsal ACC; (b) Model 02 with intrinsic connections between right DLPFC and dorsal ACC; (c) Model 03 with intrinsic connections between dorsal ACC and both left and right DLPFC; (d) Model 04 with, in addition to Model 03, intrinsic connections between dorsal ACC and rostral ACC; (e) Model 05 with, in addition to Model 04, direct interhemispheric intrinsic connections between left and right DLPFC. Displayed are in (e) also the bilinear interaction terms as the result of a second model selection process which was performed analogous to the intrinsic model selection procedure (corresponding to Model 05.5).
Alternative Bilinear Interaction Models
Additional connectivity parameters (i.e., bilinear terms) were specified to assess the influence of conflict (congruent vs. incongruent conditions) on the defined connections within the modeled network. Bilinear terms are the products of the experimentally controlled inputs with neuronal states. For the DCM analysis, we modeled incongruent and congruent conditions separately.
Based on Model 05 with the most likely intrinsic connectivity structure determined by the previous model selection step (see results section for details) we examined the influence of bilinear interaction terms on these connections. Analogous to the systematic model comparison strategy employed for the intrinsic connectivity parameters the bilinear models were investigated with bilinear interaction terms with regard to the following connections: Model 05.1 between left DLPFC and dorsal ACC; Model 05.2 between right DLPFC and dorsal ACC; Model 05.3 between dorsal ACC and both left and right DLPFC; Model 05.4 in addition to Model 05.3 connections between dorsal ACC and rostral ACC; Model 05.5 in addition to Model 05.4 direct interhemispheric connections between left and right DLPFC (Fig. 1).
Group Comparisons and Correlations
After estimating parameters of data matrix A (intrinsic connections) and B (modulatory influence of condition) on an individual subject level, second level statistics was performed by ANOVA. This analysis included main effects of group, task, and task × group interactions.
Correlations between connectivity parameter estimates and interference scores (difference in reaction time of congruent and incongruent condition) as well as psychopathology scores were calculated using Pearson correlation coefficients.
A nonparametric test was used for the correlation between connectivity parameter estimates and response accuracies since the response accuracies were not normally distributed as confirmed by Kolmogorov‐Smirnov test.
RESULTS
Behavioral Data
Reaction time
The two‐way ANOVA revealed a significant main effect of condition (F(1, 40) = 151.2; P < 0.001) indicating a slower overall performance level for the incongruent condition in both groups. The averaged Stroop interference time, defined as difference between incongruent and congruent condition, was 327.5 ms (SD = 169.7) in patients and 237.3 ms (SD = 124.5) for controls. There was a significant main effect of group (F(1, 40) = 8.0; P < 0.01) indicating slower overall reaction time in patients. There was also a significant group by condition interaction (F(1, 40) = 3.85, P = 0.05). Post‐hoc comparisons demonstrated a highly significant difference, particularly for the incongruent condition (P < 0.01) but less pronounced also for the congruent condition (P < 0.05).
Errors
In both conditions, high overall levels of accuracy were obtained in both patients and healthy controls. The nonparametric Wilcoxon‐Test revealed a significant accuracy difference between congruent and incongruent condition in patients (Z = −2.8, P = 0.005) and in controls (Z = −3.0, P = 0.003) indicating fewer incorrect responses in the congruent condition. There were no significant differences in performance accuracy between groups both for the congruent and the incongruent condition according to the Mann–Whitney U Test. The OCD patients showed 0.8% (SD = 1.6) errors in the congruent and 4.4% (SD = 4.7) errors in the incongruent condition. The control subjects showed 1.1% (SD = 1.9) erroneous responses in the congruent and 5.2% (SD = 5.8) erroneous responses in the incongruent condition.
fMRI—Univariate Analysis
Main effect of task
In the second level random effects ANOVA a significant overall main effect of task, i.e., incongruent > congruent condition for both groups together could be detected in the dorsal ACC (BA 32), middle superior frontal gyrus (BA 6), left middle frontal gyrus (BA 9/46), as well as left and right inferior frontal gyrus (BA 47). An overall main effect of task was also observed in the inferior parietal lobule (BA 40) and left middle temporal gyrus (BA 37) (Table I; Fig. 2a). We did not detect any significant activation in the opposite contrast, i.e., congruent > incongruent condition. According to an additional analysis, during the course of the entire task, both OCD patients and healthy controls demonstrated a significant gradual decrease of activation in the dorsal ACC and the left DLPFC.
Table I.
Talairach coordinates of activation maxima (SPM{T} value) for the main effect of task (P < 0.05 FWE corrected) and main effect of group as well as the planned comparison OCD > HC (P < 0.001, uncorrected)
| Region of activation | L/R/M | BA | Talairach coordinates | k | T value | ||
|---|---|---|---|---|---|---|---|
| x | y | z | |||||
| Main effect of task (Incongruent > congruent) | |||||||
| Superior frontal gyrus | M | 6 | −6 | 12 | 58 | 409 | 7.5 |
| dACC | M | 32 | 8 | 26 | 36 | 5.4 | |
| Middle frontal gyrus | L | 9/46 | −44 | 20 | 18 | 2252 | 7.6 |
| Inferior frontal gyrus | L | 47 | −34 | 24 | −10 | 6.8 | |
| Inferior frontal gyrus | R | 47 | 34 | 20 | −24 | 407 | 6.9 |
| Inferior parietal lobule | L | 40 | −32 | −52 | 42 | 166 | 5.7 |
| Middle temoral gyrus | L | 37 | −54 | −48 | −6 | 27 | 5.2 |
| Main effect of group (OCD > HC) | |||||||
| Superior frontal gyrus | R | 6 | 26 | 8 | 62 | 57 | 3.98 |
| Superior frontal gyrus | L | 6 | −14 | 6 | 70 | 79 | 3.86 |
| Middle frontal gyrus | R | 46 | 54 | 26 | 32 | 14 | 3.51 |
| Middle frontal gyrus | R | 9 | 38 | 34 | 34 | 12 | 3.35 |
| dACC | M | 24 | −2 | 2 | 34 | 105 | 4.02 |
| Precentral gyrus | L | 4 | −24 | −24 | 70 | 519 | 4.24 |
| Precentral gyrus | R | 6 | 50 | −12 | 32 | 35 | 3.75 |
| Superior parietal lobule | R | 7 | 16 | −46 | 68 | 243 | 4.07 |
| Inferior parietal lobule | R | 40 | 40 | −46 | 46 | 74 | 3.96 |
| Task by group interaction | |||||||
| OCD > HC; Incongruent > congruent | |||||||
| DLPFC | R | 9/46 | 40 | 34 | 36 | 23 | 3.5 |
| L | 9 | −56 | 10 | 26 | 23 | 3.5 | |
| HC > OCD; Incongruent > congruent | |||||||
| Occipital lobe | L | 19 | −34 | −64 | 14 | 47 | 3.5 |
| OCD > HC, incongruent condition only | |||||||
| Middle frontal gyrus | R | 9/46 | 40 | 34 | 36 | 199 | 4.2 |
| dACC | M | 24 | −2 | 2 | 34 | 171 | 4.1 |
| Precentral gyrus | L | 4 | −24 | −24 | 70 | 108 | 3.7 |
| Superior parietal lobule | R | 7 | 6 | −42 | 66 | 167 | 3.8 |
| Inferior parietal lobule | R | 40 | 42 | −48 | 46 | 69 | 3.9 |
| Superior frontal gyrus | R | 6 | 24 | 8 | 62 | 58 | 4.1 |
| Superior frontal gyrus | L | 6 | −22 | 4 | 66 | 29 | 3.6 |
Figure 2.
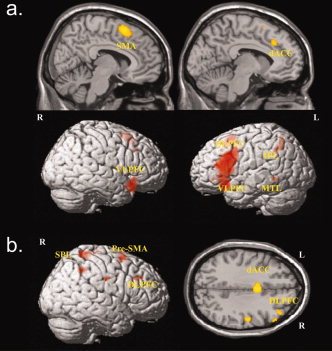
Significant areas for (a) main effects of task (incongruent > congruent condition; P < 0.05, FWE corrected) and (b) main effect of group (OCD patients > healthy controls, P < 0.001, k = 12 voxels).
Main effect of group
For the main effect of group (congruent and incongruent conditions together) OCD patients demonstrated higher activation relative to healthy controls in a number of regions. These comprised the left and right superior frontal gyrus (BA 6), right middle frontal gyrus (BA 9/46), dorsal ACC (BA 24), left and right precentral gyrus (BA 4, BA 6), right superior parietal lobule (BA 7), and right inferior parietal lobule (BA 40) (Table I; Fig. 2b). We did not detect any significant activation in the opposite contrast, i.e., controls > patients.
Task by group interaction
A significant task by group interaction effect could be identified for the right DLPFC and left DLPFC. Activation was higher in patients with OCD during the incongruent versus congruent condition relative to healthy controls. Using the opposite contrast for the examination of interaction effects activation in the left occipital lobe was significantly higher in healthy controls as compared to patients with OCD (Table I; Fig. 3a). To examine the precise activation differences underlying this observed task by group interaction effects and corresponding to our primary hypothesis, we performed planned comparisons between OCD patients and healthy controls for the incongruent condition only. This comparison revealed significantly higher activation in patients relative to controls in the right middle frontal gyrus (9/46), right and left superior frontal gyrus (BA 6), dorsal ACC (BA 24), left precentral gyrus (BA 4), right superior parietal lobule (BA 7), right inferior parietal lobule (BA 40) (Table I; Fig. 3b).
Figure 3.
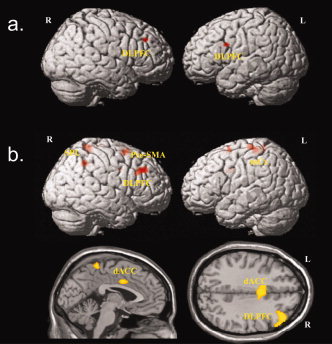
Significant areas for (a) task by group interaction effects (OCD patients > healthy controls for incongruent versus congruent condition) (P < 0.001, k = 12 voxels) and (b) increased activation in OCD patients compared to controls for the incongruent condition only (P < 0.001, k = 12 voxels).
Correlations
In patients with OCD a positive correlation between Stroop interference score and BOLD activation data for the incongruent task condition could be detected. Brain areas of significant positive correlation with the Stroop interference score were identified in the right inferior frontal gyrus (BA 47), left middle frontal gyrus (BA 9), left putamen, in the posterior and anterior portion of the midcingulate gyrus corresponding to the dorsal ACC extending into the SMA (BA 32′/24′) (Table II; Fig. 4a).
Table II.
Talairach coordinates of activation maxima (SPM{T} value) for the correlation of interference score with incongruent > baseline contrast (P < 0.001, uncorrected)
| Region of activation | L/R/M | BA | Talairach coordinates | k | T value | ||
|---|---|---|---|---|---|---|---|
| x | y | z | |||||
| OCD | |||||||
| Inferior frontal gyrus | R | 47 | 34 | 26 | −10 | 377 | 7.02 |
| Middle frontal gyrus | L | 9 | −52 | 14 | 22 | 18 | 3.93 |
| dACC | M | 32′/24′ | 8 | 26 | 42 | 28 | 4.26 |
| dACC | M | 32′/24′ | 6 | −12 | 48 | 88 | 5.61 |
| Putamen | L | −34 | 14 | −2 | 266 | 6.16 | |
| Precentral gyrus | R | 6 | 48 | −12 | 60 | 24 | 4.34 |
| Cerebellum | R | 4 | −54 | −8 | 34 | 4.68 | |
| Controls | |||||||
| Amygdala | R | 24 | 4 | −16 | 52 | 4.63 | |
| R | 22 | −8 | −4 | 20 | 4.04 | ||
| Occipital lobe | L | 19 | −46 | −58 | −4 | 25 | 4.66 |
| Posterior cingulate cortex | R | 30 | 28 | −66 | 4 | 26 | 4.08 |
Figure 4.
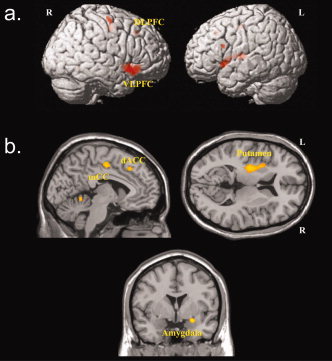
Areas of significant correlations between Stroop interference scores and activation during the incongruent task condition for (a) OCD patients and (b) healthy controls (P < 0.001, k = 12 voxels).
Additional correlations were found in right precentral gyrus (BA 6), and right cerebellum. No significant negative correlations could be detected for OCD patients. Conversely, healthy controls demonstrated a significant positive correlation of the Stroop interference score with the BOLD activation in the right amygdala, left occipital lobe, and right posterior cingulate cortex (Table II; Fig. 4b). No significant negative correlations could be detected for healthy controls.
DCM ANALYSIS
Model Selection
Intrinsic connections
Random effects Bayesian model selection with regard to the intrinsic connectivity patterns revealed the best model fit for Model 05 in both OCD patients and healthy controls. A comparison of Dirichlet parameter estimates α, conditional expectations of the probabilities of the different models 〈rk〉, and the exceedance probability φk consistently pointed toward superiority of the most complex model (Table III).
Table III.
Model comparison of intrinsic and modulatory connectivity within the fronto‐cingulate circuitry for brain regions involved in executive cognitive control, error processing, and response inhibition
| Model | M01 | M02 | M03 | M04 | M05 |
|---|---|---|---|---|---|
| (a) Intrinsic connections | |||||
| OCD patients | |||||
| α | 1.0042 | 1.0019 | 1.4371 | 1.5213 | 21.0355 |
| φk | 0.0386 | 0.0385 | 0.0553 | 0.0585 | 0.8091 |
| 〈rk〉 | 0 | 0 | 0 | 0 | 1 |
| Healthy controls | |||||
| α | 1 | 1 | 1.6339 | 1.6706 | 20.6955 |
| φk | 0.0385 | 0.0385 | 0.0628 | 0.0643 | 0.796 |
| 〈rk〉 | 0 | 0 | 0 | 0 | 1 |
| Model | M05a | M05b | M05c | M05d | M05e |
| (b) Bilinear terms | |||||
| OCD patients | |||||
| α | 3.4214 | 1.9718 | 4.4464 | 4.722 | 11.4383 |
| φk | 0.1316 | 0.0758 | 0.171 | 0.1816 | 0.4399 |
| 〈rk〉 | 0.0107 | 0.0016 | 0.0285 | 0.0364 | 0.9228 |
| Healthy controls | |||||
| α | 3.9602 | 2.347 | 5.4489 | 5.5756 | 8.6682 |
| φk | 0.1523 | 0.0903 | 0.2096 | 0.2144 | 0.3334 |
| 〈rk〉 | 0.045 | 0.0075 | 0.1371 | 0.1493 | 0.6611 |
Depicted are Dirichlet parameter estimates α, conditional expectations of the probabilities of the different models 〈rk〉, and the exceedance probability φk. Results are based on a stepwise model comparison process involving intrinsic connections and bilinear modulatory terms both for OCD patients and healthy controls.
Bilinear interactions
With regard to the bilinear interaction terms, the random effects BMS provided evidence for the most complex Model 05, i.e., with task‐related modulation of all functional interactions as the most suitable model both in OCD patients and healthy controls (Table III).
Intrinsic Connectivity
Intrinsic connections describe the interaction between functional nodes without interaction effects by defined tasks or task subcomponents.
Individual group results
Intrinsic connections for all modeled directions in Model 05 except the reciprocal connection between rostral and dorsal ACC were significantly greater than zero in both groups (P < 0.05). Among these significant interactions, all survived Bonferroni correction except the connection from dorsal ACC to left DLPFC in controls. These findings demonstrate a coherent pattern of functional interactions for all nodes within the left hemispheric network chosen for analysis (Table IV).
Table IV.
Intrinsic connectivity parameters for patients with OCD and healthy controls
| Path | OCD | Controls | P | ||
|---|---|---|---|---|---|
| Mean | S.E.M. | Mean | S.E.M. | ||
| L V1 →L DLFPC | 0.3844* | 0.0231 | 0.3243* | 0.0198 | n.s |
| R DLPFC → L DLPFC | 0.0466* | 0.0119 | 0.0307* | 0.0072 | n.s. |
| dACC → L DLPFC | 0.0195* | 0.0067 | 0.0081+ | 0.0033 | n.s. |
| R V1 → R DLPFC | 0.1806* | 0.0205 | 0.1773* | 0.0160 | n.s. |
| L DLPFC → R DLPFC | 0.1108* | 0.0141 | 0.0948* | 0.0131 | n.s. |
| dACC → R DLPFC | 0.0341* | 0.0060 | 0.0206* | 0.0060 | n.s. |
| L DLPFC → dACC | 0.2402* | 0.0285 | 0.1670* | 0.0241 | n.s. |
| R DLPFC → dACC | 0.1000* | 0.0164 | 0.0724* | 0.0136 | n.s. |
| rACC → dACC | −0.0004 | 0.0008 | −0.0003 | 0.0004 | n.s. |
| dACC → rACC | −0.0138 | 0.0096 | −0.0068 | 0.0088 | n.s. |
Depicted are means, standard error of mean, and group effects (P < 0.05). Group mean values with significant difference from zero are marked with * if result is sustaining Bonferroni correction and with + if significance is only reached without correction. R = right; L = left; DLPFC = dorsolateral prefrontal cortex; dACC = dorsal anterior cingulate cortex; rACC = rostral anterior cingulate cortex; V1 = primary visual cortex
Group differences
None of the intrinsic connections showed significant group differences (P < 0 0.05).
Bilinear Interactions
Individual group results
With regard to the bilinear interaction terms both groups demonstrated significant task‐related modulation of connection strengths between different nodes of the network. For the congruent condition these connectivity parameters included the projection from the left DLPFC to dorsal ACC and right DLPFC to dorsal ACC. For the incongruent condition these pathways comprised the interaction from the right to the left DLPFC, dorsal ACC to left DLPFC, left DLPFC to right DLPFC as well as left DLPFC to dorsal ACC and right DLPFC to dorsal ACC. These connectivity parameters were significantly different from zero even after Bonferroni correction (P < 0.05). A detailed list of functional interactions is presented in Table V.
Table V.
Bilinear interaction terms indicating both groups demonstrated significant task‐related modulation of connection strengths for patients with OCD and healthy controls
| Path | OCD | Controls | P | ||
|---|---|---|---|---|---|
| Mean | S.E.M. | Mean | S.E.M. | ||
| Congruent condition | |||||
| R DLPFC → L DLPFC | 0.0024 | 0.0024 | 0.0049+ | 0.0022 | n.s. |
| dACC → L DLPFC | 0.0005 | 0.0014 | 0.0012 | 0.0011 | n.s. |
| L DLPFC → R DLPFC | 0.0035 | 0.0029 | 0.0088 | 0.0045 | n.s. |
| dACC → R DLPFC | 0.0004 | 0.0009 | 0.0017 | 0.0011 | n.s. |
| L DLPFC → dACC | 0.0372* | 0.0066 | 0.0388* | 0.0048 | n.s. |
| R DLPFC → dACC | 0.0143* | 0.0032 | 0.0181* | 0.0030 | n.s. |
| rACC → dACC | 0.0001 | 0.0001 | −0.0001 | 0.0001 | n.s. |
| dACC → rACC | −0.002 | 0.0017 | −0.0015 | 0.0012 | n.s. |
| Incongruent condition | |||||
| R DLPFC → L DLPFC | 0.02372* | 0.0046 | 0.0131* | 0.0020 | P < 0.05+ |
| dACC → L DLPFC | 0.01213* | 0.0023 | 0.0044* | 0.0012 | P < 0.05+ |
| L DLPFC → R DLPFC | 0.0196* | 0.0048 | 0.0114* | 0.0028 | n.s. |
| dACC → R DLPFC | 0.0050+ | 0.0019 | 0.0018+ | 0.0006 | n.s. |
| L DLPFC → dACC | 0.0573* | 0.0066 | 0.0456* | 0.0047 | n.s. |
| R DLPFC → dACC | 0.0243* | 0.0041 | 0.0203* | 0.0022 | n.s. |
| rACC → dACC | −0.0002 | 0.0001 | −0.0001 | 0.0001 | n.s. |
| dACC → rACC | −0.0016 | 0.0016 | 0.0003 | 0.0009 | n.s. |
Depicted are means, standard error of means, and group effects (P < 0.05). Significant individual group mean values are marked with * if they are sustaining Bonferroni correction and with + if significance is only reached without correction. R = right; L = left; DLPFC = dorsolateral prefrontal cortex; dACC = dorsal anterior cingulate cortex; rACC = rostral anterior cingulate cortex.
Repeated measures ANOVA
All bilinear connections were included in a repeated measures ANOVA to further examine potential group, task, and group by task interactions (Fig. 5).
Figure 5.
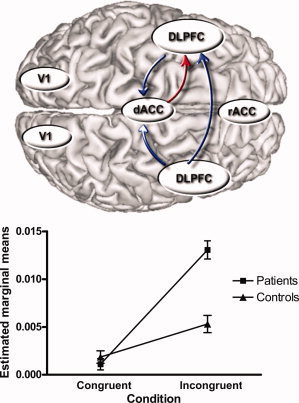
(a) Overview of pathways showing a significant task effect with higher connectivity parameters in the incongruent as compared to the congruent condition (P < 0.05, corrected, in blue) and a significant group, task and task by group interaction effect (P < 0.05, in red) where connectivity parameters were significantly higher for the incongruent condition in OCD patients relative to healthy controls. (b) Marginal means for the dorsal ACC to left DLPFC connectivity (patients versus controls, incongruent versus congruent condition) showing predominant and significant difference in connectivity parameters for the incongruent condition with OCD patients > controls (P < 0.01).
Right DLPFC to Left DLPFC
For the right DLPFC to left DLPFC a main effect of task could be identified with higher connectivity parameters in the incongruent condition (P < 0.05, corrected). There was no significant effect in the opposite direction.
Left DLPFC to Right DLPFC
No significant effects were observed.
Dorsal ACC to Left DLPFC
A significant main effect of task (P < 0.05, corrected), group (P < 0.05, corrected), and task by group interaction (P < 0.05) could be identified. Higher bilinear interaction terms were observed for the incongruent versus the congruent condition in both groups. As evident from the interaction graph the observed statistically significant group by condition interaction was due to a higher between‐group difference with regard to interaction terms for the incongruent condition (P < 0.01). Separate analysis revealed significant differences between both groups for the incongruent condition (P < 0.05, corrected) with higher bilinear interaction terms for patients (mean = 0.012; SD = 0.011) as compared to controls (mean = 0.004; SD = 0.005). This finding points to enhanced dorsal ACC to left DLPFC input in patients with OCD during the higher demanding incongruent Stroop task condition.
Left DLPFC to Dorsal ACC
A significant main effect of task (P < 0.05, corrected) could be detected with higher connectivity parameters in the incongruent condition.
Right DLPFC to Dorsal ACC
A significant main effect of task was found (P < 0.05) with higher connectivity parameters in the incongruent condition.
Dorsal ACC to Right DLPFC
No significant effects were observed.
Rostral ACC to Dorsal ACC
A significant task by group interaction (P < 0.05) could be identified. However, there was no significant main effect of task or main effect of group. In addition, separate analyses for congruent or incongruent task conditions did not reveal significant group differences with regard to the bilinear interaction terms.
Dorsal ACC to Rostral ACC
No significant effects could be detected.
CORRELATIONS
Stroop Interference Score
In patients with OCD we detected a positive correlation between the Stroop interference score and the intrinsic connectivity in the right to left DLPFC interaction (P < 0.05, corrected). In the healthy controls none of the intrinsic or bilinear interactions showed a correlation with the Stroop interference score.
Psychopathology Scores
In the OCD patients group there was a negative correlation between the rater‐based Y‐BOCS obsession score and the incongruent bilinear interaction terms for the connectivity from the left DLPFC to the dorsal ACC (r = −0.48; P < 0.05). For the self‐rating Y‐BOCS compulsion score a significant negative correlation could be found with the incongruent condition bilinear interaction terms for the left DLPFC to dorsal ACC (r = −0.55; P < 0.05) connectivity. In addition, for the self‐rating Y‐BOCS sum score a significant negative correlation could be found both with the incongruent condition bilinear interaction terms for the dorsal ACC to the left DLPFC (r = −45, P = 0.046) and for the left DLPFC to the dorsal ACC (r = −0.56, P = 0.01) connectivity.
DISCUSSION
In the present study, we examined cognitive brain activation patterns associated with cognitive conflict and decision‐making in patients with OCD and healthy controls using fMRI and a Stroop paradigm.
Fronto‐Cingulate Hyperactivation in OCD
Consistent with previous studies the processing of conflicting information during the incongruent condition revealed activation in an extended fronto‐cingulate network including the dorsal ACC, left VLPFC, and left DLPFC.
In the main effect of group, OCD patients revealed higher activation relative to controls in a predominantly fronto‐cingulate network including the dorsal ACC and right DLPFC. Moreover, a significant task by group interaction effect could be detected for the DLPFC bilaterally. The examination of marginal means pointed toward differences between both groups existing in particular for the incongruent condition. This was confirmed by subsequent planned comparisons showing significantly higher activations in OCD patients relative to controls in dorsal ACC, right DLPFC, parietal cortex, and precentral gyrus in the incongruent condition.
Thus, as a major finding and confirmation of our initial hypothesis we found evidence for higher activations in OCD patients in an extended network of brain areas underlying cognitive interference and decision making under conflict. A potential interpretation of this result relates to a higher activation of the error control and performance monitoring system in OCD patients in particularly during the higher demanding incongruent task condition. On the behavioral level this goes along with significantly prolonged response times in patients with OCD in the presence of normal error rates.
In patients with OCD a positive correlation between Stroop interference score and BOLD activation data during the incongruent task condition could be detected. The areas showing this correlation comprised predominantly the dorsal ACC extending into the SMA. In addition, this positive correlation could be detected in portions of an extended cortical‐subcortical‐cerebellar network. In contrast, healthy controls showed positive correlations with the Stroop interference score only in the right amygdala, left occipital lobe, and posterior cingulate cortex. These findings with regard to the correlations of BOLD activation data and Stroop interference score are consistent with the notion of an enhanced cognitive control circuitry in OCD patients and provide further support for the assumption that prolonged response times in OCD patients are directly related to a hyperactive conflict and error monitoring system reflected by a significantly increased activation in a fronto‐cingulate network.
Bayesian Model Selection
For a detailed analysis of the potential differences in the underlying regional interactions we combined both univariate statistical analysis and the study of effective connectivity. The model was specified within the framework of dynamic causal modeling (DCM).
During the systematic random effects Bayesian model comparison the most complex of the models considered here provided the best explanation both for effects relating to intrinsic connectivity and modulatory influences in both healthy controls and OCD patients. Please note that this result is not trivial or expected: Bayesian model selection is not about finding the model with the best fit, but identifying the model with the best balance between fit and complexity. Thus, while increasing model complexity will improve model fit, overly complex (overfitting) models are prevented by Bayesian model selection.
Thus, it can be concluded that the entire fronto‐cingulate system is involved in the ongoing error control and decision process during the Stroop task performance. The identified network is consistent with previous studies investigating the neural correlates of the Stroop task in healthy subjects [Mead et al., 2002; Zysset et al., 2001].
With regard to the bilinear interaction terms both groups demonstrated significant task‐related modulation of connection strengths between different nodes of the network. For the incongruent condition these interactions comprise the left as well as right DLPFC in connection to the dorsal ACC. For the incongruent condition bilinear interactions in a more extended fronto‐cingulate network bilaterally were significantly different from zero.
The systematic model comparison process revealed that healthy controls and OCD patients were not different with regard to the selected model but a number of group differences in the intrinsic and bilinear connectivity parameters were observed. This could be interpreted as an indication that the basic neurofunctional network subserving Stroop task performance is comparable in healthy controls and OCD patients. However, considerable differences exist with regard to the intensity of functional connectivity parameters.
Altered Fronto‐Cingulate Connectivity
The analysis of group, task, and group by task interactions with regard to the connectivity parameters provided detailed information about potential group differences: Most notably, significant main effects of task and group as well as a task by group interaction could be identified for the connectivity from the dorsal ACC to left DLPFC. As evident from the interaction graph for the marginal means this finding was due to higher between‐group differences with regard to the incongruent condition. This finding points to enhanced dorsal ACC to left DLPFC input in patients with OCD predominantly during the higher demanding incongruent Stroop task condition.
With regard to the other bilinear interaction terms, the right to left DLPFC, left DLPFC to dorsal ACC, and right DLPFC to dorsal ACC connectivity showed a significant main effect of task but no task by group interaction. It can be concluded that specifically the projection from the dorsal ACC to left DLPFC is enhanced in OCD patients who might be related to the more demanding incongruent Stroop task condition.
Role of the Dorsal ACC
The observed pattern of interactions between dorsal ACC and left DLPFC in the present study is in accordance with previous investigations assigning the dorsal ACC a central role for preparation and execution of correct motor response [Leung et al., 2000] as well as to the allocation of attention resources for resolving the Stroop interference effect [Peterson et al., 1999]. The present findings are furthermore in agreement with previous studies demonstrating excessive activation during high‐conflict trials in patients with OCD in a fronto‐cingulate network [Maltby et al., 2005]. The central role of the ACC during interference and response competition has been directly demonstrated by single cell studies in humans [Davis et al., 2005]. Here, it could be shown that dorsal ACC neurons may be acting as salience detectors when faced with conflict and difficult or emotional stimuli, consistent with neuroimaging results of ACC responses to abrupt sensory, novel, task‐relevant, or painful stimuli. A population of ACC neurons could be identified that responded differentially or in a graded manner to cognitively demanding high‐ and low‐conflict Stroop tasks. These results are consistent with the observed relative hyperactivation of the dorsal ACC in OCD patients interpreted as an overactive error control system. Egner and Hirsch [ 2005] demonstrated that in response to high conflict, cognitive control mechanisms can enhance performance by transiently amplifying cortical responses to task‐relevant information rather than by inhibiting responses to task‐irrelevant information. These results imply attentional target‐feature amplification as the primary mechanism for conflict resolution through cognitive control. Summerfield et al. [ 2006] demonstrated top‐down effects exerted by the ACC on amygdala and primary sensory areas using DCM in an affective picture viewing task. In the present study, the chosen Stroop task included color‐word conflict material requiring a clear suppression of the prepotent motor response. Therefore, we included primary sensory areas as the driving input and did not model reciprocal top‐down influences of higher cortical regions on primary sensory areas, in particular the V1.
Disease Specificity
Previous studies have shown that alterations of ACC functions might not be disease‐specific. Impaired conflict monitoring by the ACC might play an important role also for cognitive control deficits in patients with schizophrenia [Kerns et al., 2005] or attention‐deficit/hyperactivity disorder [Doder et al., 1999]. These findings suggest that functional abnormalities involving the ACC might be related to a more general psychopathological feature affecting the capacity for error processing, response preparation, and decision making.
However, the present findings with regard to the particular parts of the ACC and the fronto‐cingulate system in OCD are suggesting a distinct role of alterations in the interrelationship between the dorsal ACC and the DLPFC. This aspect separates, for example, the findings for OCD from major depression. In our previous study we found an inability of depressed patients to suppress the activity in rostral ACC in relation to healthy controls and additionally an enhanced modulatory effect of the dorsal to rostral connections in major depression during the incongruent condition of the Stroop task [Schlösser et al., 2008; Wagner et al., 2006].
In contrast, the present findings for OCD did not provide evidence for altered BOLD signal in the rostral ACC. Although the repeated measures ANOVA provided some indication for a task by group interaction in the rostral ACC to dorsal ACC connections, the separate direct group comparisons for either one of these task conditions did not reveal significant differences in the task‐related modulatory influence. In addition, the one‐sample t‐tests did not show these modulatory terms for the rostral to dorsal ACC to be significantly different from zero suggesting their minor role in the cognitive control process. Thus, there is no comparable evidence for OCD‐related altered effective connectivity between the different portions of the ACC as described previously for patients with major depression. This can be regarded as evidence for the observed alterations in the dorsal ACC to DLPFC interactions being specifically related to the pathophysiology of OCD.
DLPFC to Dorsal ACC Connectivity and Y‐BOCS Scores
Most interestingly, in the OCD patients a negative correlation between the bilinear interaction terms (i.e., task‐related modulation) of the left DLPFC to the dorsal ACC connectivity and the rater‐based Y‐BOCS obsessions score, Y‐BOCS compulsions, and Y‐BOCS total self rating scores could be observed.
Given the initial hypothesis of an overactive error control system in the fronto‐cingulate system, this finding appears to be surprising at first sight. However, it could be speculated that the DLPFC to dorsal ACC connectivity which is subserving executive input and cognitive flexibility is disrupted in patients with OCD. The associated connectivity parameters might be, therefore, inversely correlated to the severity of OCD and the intensity of obsessions and compulsions. This interpretation is supported by previous findings that OCD patients exhibiting cognitive inflexibility in terms of deficits in task switching showed hypoactivation of the PFC [Gu et al., 2008].
It might be possible that OCD patients of the current study demonstrated an overall heightened level of cognitive control in comparison to healthy controls as indicated by the univariate data analysis and the dorsal ACC to left DLPFC connectivity data. However, within the patient group the left DLPFC to dorsal ACC connectivity was lower as the severity of obsessive and compulsive symptoms increased. Thus, the group level difference might reflect a general trait characteristic based on physiological differences in the underlying information processing and error control network. On the other hand, the observed within group relationships could be related to a state dependent disruption of fronto‐cingulate connectivity. In the context of this proposed explanatory model the error control system in OCD patients as driven by the dorsal ACC potentially operates on a higher activity level. Once on this high activity/high control level, disease severity associated behavioral and cognitive disturbances from obsessions and compulsions might interfere with left DLPFC to dorsal ACC input and thus lead to gradual reduction of the connectivity level.
Functional Dissociation of Fronto‐Cingulate System
The finding of enhanced dorsal ACC to DLPFC connectivity together with a negative correlation between DLPFC and dorsal ACC connectivity would be consistent with the notion of a functional dissociation in the fronto‐cingulate system. However, controversy about the particular interplay and potential functional dissociation among these two brain areas exists. MacDonald et al. [ 2000] have suggested that cognitive control is a dynamic process implemented in the brain by a distributed network that involves closely interacting, but nevertheless anatomically dissociable, components. This assumption is supported by existing strong reciprocal connections between the dorsal ACC and the lateral PFC [Devinsky et al., 1995].
Differences in functional specialization of dorsal ACC and DLPFC might account for divergent activation patterns during decision‐making and cognitive control reported earlier. Compatibel with our interpretation van den Heuvel et al. [ 2005] have demonstrated both decreased responsiveness in the DLPFC and at the same time higher activation in the dorsal ACC during planning in OCD patients. It was concluded by the authors, that executive impairment is a core feature in OCD and that dorsal ACC activation might be a compensatory neuronal activity subserving error control.
According to a widely adopted model the dorsal ACC monitors conflict and performance thus signaling when adjustments in control are needed whereas the DLPFC exerts executive cognitive control [Cohen et al., 2000; Kerns et al., 2004]. Within this system, the DLPFC provides top‐down support of task‐appropriate behaviors, whereas other components, such as the ACC, are likely to be involved in evaluative processes indicating when control needs to be more strongly engaged.
The observation that the DLPFC is also activated in conflict related paradigms could be an indication that this region is, parallel to the dorsal ACC, involved in conflict resolution and error control. A number of electrophysiological and functional imaging studies have implicated the DLPFC primarily in maintenance of task demands and contextual information, which are used to inform the ACC in monitoring of conflict in information processing and detection of errors [Bush et al., 2002; Carter et al., 2000; Gehring and Knight, 2000]. In addition, mnemonic [Milham et al., 2003] and attentional [Kerns et al., 2004] functions have been attributed to the DLPFC. In addition, it has been suggested that the ACC monitors or detects the presence of conflict and then conveys this information to areas such as the DLPFC, which then adjust the level of cognitive control accordingly [Botvinick et al., 2004; Carter and van Veen, 2007; Ridderinkhof et al., 2004].
The notion of active control exerted by the dorsal ACC is supported by an additional analysis in the present study showing both for OCD patients and healthy controls a significant gradual decrease in the dorsal ACC and the left PFC activation during the time course of the entire Stroop task session. This finding could be interpreted as a decrease of activation as control is established during the task, potentially due to practice and developing an adequate strategy.
However, some imaging and lesion studies have questioned that the role of the ACC is restricted to error control and conflict resolution [Erickson et al., 2004; Mansouri et al., 2009; Stuss et al., 2001]. Rather, it has been proposed that the ACC itself exerts executive control by selectively biasing processing in favor of task relevant pathways [Paus et al., 1998]. The synaptic interactions of the ACC suggest that it might use affective and mnemonic information to either act synergistically with prefrontal areas and strengthen a relevant signal when noise intrudes, or reverse undesired decisions for flexible behavior [Medalla and Barbas, 2009]. Finally, a broader view has linked the role of the ACC for conflict processing to the more general concept of uncertainty tracking, production of prediction error signals, and estimation of expected reward [Rushworth and Behrens, 2008; Walton et al., 2007].
Disrupted Fronto‐Cingulate Interaction in OCD
Despite the evidence for a concerted functional interplay of dorsal ACC and DLPFC the exact roles of the respective regions is still a matter of debate. Therefore, any attempt to integrate the findings of the current study into a coherent model of fronto‐cingulate functional connectivity has to be regarded as preliminary and to a certain extent speculative.
First, according to a proposed model, patients are characterized by inflexible behavioral and cognitive patterns and associated activation in the underlying neuronal circuitry [Chamberlain et al., 2006]. Cognitive inflexibility and the ability for switching to new strategies or behavioral patterns might be compromised [Gu et al., 2008; Remijnse et al., 2006]. The current study now suggests that this deficit in cognitive flexibility and executive capacity might in particular affect the DLPFC and the projections from the DLPFC to the dorsal ACC as these connectivity parameters are lower with increasing psychopathology severity scores. This might be indicating a potentially deficient executive input from the DLPFC. This finding appears to be, at first sight, surprising. However, it would be consistent with the interpretation that higher intensity of obsessions and compulsions is related to a lower cognitive flexibility and deficient cognitive control exerted by the DLPFC.
Second, the error control system of OCD patients which supervises any decision pattern and deviations from this pattern might be overinvolved and the underlying neuronal structures are hyperactivated. Tasks which require suppression of potential erroneous responses induce a strong demand for error control and thus lead to activation of the dorsal ACC.
In line with this interpretation our results have shown enhanced dorsal ACC to the left DLPFC connectivity in OCD patients which is consistent with an overactive, but intact (normal error rates of OCD patients in the present study) error control system primarily based on the functional integrity of the dorsal ACC. The results suggest that the dorsal ACC exerts neuronal control functions over the executive areas of the PFC.
Concluding Remarks
The present study is the first one to combine univariate data analysis with the investigation of effective connectivity to examine error control and decision‐making in patients with OCD. Confirming our primary hypothesis the current data provide firm evidence for a relative hyperactivation of the fronto‐cingulate system in patients with OCD. Moreover, enhanced task‐related input from the dorsal ACC to the left DLPFC in subjects with OCD could be detected. Thus, the study provides strong support for current models proposing a central role of the altered fronto‐cingulate system as part of an error control system and subserving executive functions in the pathophysiology of OCD.
These findings could be interpreted as an expression of an overactive error control and performance monitoring system relevant for suppression of prepotent responses. The present data suggest that this control system acts on a higher level in patients with OCD relative to healthy controls and might be driven by dorsal ACC control exerted over the DLPFC bilaterally. This higher activity level in the fronto‐cingulate system could be reflected by prolonged response times which patients needed to resolve the Stroop conflict.
By identifying network operations potentially underlying the observed regional findings from the univariate data analysis, the dynamic causal modeling approach adds an important and new complement to further disentangle the pathophysiology of OCD.
REFERENCES
- Annett M ( 1967): The binomial distribution of right, mixed and left handedness. Q J Exp Psychol 19: 327–333. [DOI] [PubMed] [Google Scholar]
- Banich MT, Milham MP, Jacobson BL, Webb A, Wszalek T, Cohen NJ, Kramer AF ( 2001): Attentional selection and the processing of task‐irrelevant information: Insights from fMRI examinations of the Stroop task. Prog Brain Res 134: 459–470. [DOI] [PubMed] [Google Scholar]
- Blasi G, Goldberg TE, Weickert T, Das S, Kohn P, Zoltick B, Bertolino A, Callicott JH, Weinberger DR, Mattay VS ( 2006): Brain regions underlying response inhibition and interference monitoring and suppression. Eur J Neurosci 23: 1658–1664. [DOI] [PubMed] [Google Scholar]
- Botvinick MM, Cohen JD, Carter CS ( 2004): Conflict monitoring and anterior cingulate cortex: An update. Trends Cogn Sci 8: 539–546. [DOI] [PubMed] [Google Scholar]
- Buchel C, Friston KJ ( 1997): Modulation of connectivity in visual pathways by attention: Cortical interactions evaluated with structural equation modelling and fMRI. Cereb Cortex 7: 768–778. [DOI] [PubMed] [Google Scholar]
- Bush G, Vogt BA, Holmes J, Dale AM, Greve D, Jenike MA, Rosen BR ( 2002): Dorsal anterior cingulate cortex: A role in reward‐based decision making. Proc Natl Acad Sci USA 99: 523–528. [DOI] [PMC free article] [PubMed] [Google Scholar]
- Carter CS, van Veen V ( 2007): Anterior cingulate cortex and conflict detection: An update of theory and data. Cogn Affect Behav Neurosci 7: 367–379. [DOI] [PubMed] [Google Scholar]
- Carter CS, Macdonald AM, Botvinick M, Ross LL, Stenger VA, Noll D, Cohen JD ( 2000): Parsing executive processes: Strategic vs. evaluative functions of the anterior cingulate cortex. Proc Natl Acad Sci USA 97: 1944–1948. [DOI] [PMC free article] [PubMed] [Google Scholar]
- Chamberlain SR, Fineberg NA, Blackwell AD, Robbins TW, Sahakian BJ ( 2006): Motor inhibition and cognitive flexibility in obsessive‐compulsive disorder and trichotillomania. Am J Psychiatry 163: 1282–1284. [DOI] [PubMed] [Google Scholar]
- Cohen JD, Dunbar K, McClelland JL ( 1990): On the control of automatic processes: A parallel distributed processing account of the Stroop effect. Psychol Rev 97: 332–361. [DOI] [PubMed] [Google Scholar]
- Cohen JD, Botvinick M, Carter CS ( 2000): Anterior cingulate and prefrontal cortex: Who's in control? Nat Neurosci 3: 421–423. [DOI] [PubMed] [Google Scholar]
- Davis KD, Taylor KS, Hutchison WD, Dostrovsky JO, McAndrews MP, Richter EO, Lozano AM ( 2005): Human anterior cingulate cortex neurons encode cognitive and emotional demands. J Neurosci 25: 8402–8406. [DOI] [PMC free article] [PubMed] [Google Scholar]
- Deco G, Jirsa VK, Robinson PA, Breakspear M, Friston K ( 2008): The dynamic brain: From spiking neurons to neural masses and cortical fields. PLoS Comput Biol 4: e1000092. [DOI] [PMC free article] [PubMed] [Google Scholar]
- Devinsky O, Morrell MJ, Vogt BA ( 1995): Contributions of anterior cingulate cortex to behaviour. Brain 118 ( Part 1): 279–306. [DOI] [PubMed] [Google Scholar]
- Doder M, Jahanshahi M, Turjanski N, Moseley IF, Lees AJ ( 1999): Parkinson's syndrome after closed head injury: A single case report. J Neurol Neurosurg Psychiatry 66: 380–385. [DOI] [PMC free article] [PubMed] [Google Scholar]
- Egner T, Hirsch J ( 2005): Cognitive control mechanisms resolve conflict through cortical amplification of task‐relevant information. Nat Neurosci 8: 1784–1790. [DOI] [PubMed] [Google Scholar]
- Erickson KI, Milham MP, Colcombe SJ, Kramer AF, Banich MT, Webb A, Cohen NJ ( 2004): Behavioral conflict, anterior cingulate cortex, and experiment duration: Implications of diverging data. Hum Brain Mapp 21: 98–107. [DOI] [PMC free article] [PubMed] [Google Scholar]
- Etkin A, Egner T, Peraza DM, Kandel ER, Hirsch J ( 2006): Resolving emotional conflict: A role for the rostral anterior cingulate cortex in modulating activity in the amygdala. Neuron 51: 871–882. [DOI] [PubMed] [Google Scholar]
- Fitzgerald KD, Welsh RC, Gehring WJ, Abelson JL, Himle JA, Liberzon I, Taylor SF ( 2005): Error‐related hyperactivity of the anterior cingulate cortex in obsessive‐compulsive disorder. Biol Psychiatry 57: 287–294. [DOI] [PubMed] [Google Scholar]
- Fletcher P, Buchel C, Josephs O, Friston K, Dolan R ( 1999): Learning‐related neuronal responses in prefrontal cortex studied with functional neuroimaging. Cereb Cortex 9: 168–178. [DOI] [PubMed] [Google Scholar]
- Franke G ( 1995): Die Symptomcheckliste von Derogatis—Deutsche Version. Göttingen: Beltz Test Gesellschaft. [Google Scholar]
- Friston KJ, Harrison L, Penny W ( 2003): Dynamic causal modelling. Neuroimage 19: 1273–1302. [DOI] [PubMed] [Google Scholar]
- Gehring WJ, Knight RT ( 2000): Prefrontal‐cingulate interactions in action monitoring. Nat Neurosci 3: 516–520. [DOI] [PubMed] [Google Scholar]
- Gehring WJ, Himle J, Nisenson LG ( 2000): Action‐monitoring dysfunction in obsessive‐compulsive disorder. Psychol Sci 11: 1–6. [DOI] [PubMed] [Google Scholar]
- Gu BM, Park JY, Kang DH, Lee SJ, Yoo SY, Jo HJ, Choi CH, Lee JM, Kwon JS ( 2008): Neural correlates of cognitive inflexibility during task‐switching in obsessive‐compulsive disorder. Brain 131 ( Part 1): 155–164. [DOI] [PubMed] [Google Scholar]
- Hajcak G, Simons RF ( 2002): Error‐related brain activity in obsessive‐compulsive undergraduates. Psychiatry Res 110: 63–72. [DOI] [PubMed] [Google Scholar]
- Kerns JG, Cohen JD, MacDonald Iii AW, Cho RY, Stenger VA, Carter CS ( 2004): Anterior cingulate conflict monitoring and adjustments in control. Science 303: 1023–1026. [DOI] [PubMed] [Google Scholar]
- Kerns JG, Cohen JD, MacDonald AW III, Johnson MK, Stenger VA, Aizenstein H, Carter CS ( 2005): Decreased conflict‐ and error‐related activity in the anterior cingulate cortex in subjects with schizophrenia. Am J Psychiatry 162: 1833–1839. [DOI] [PubMed] [Google Scholar]
- Kondo H, Osaka N, Osaka M ( 2004): Cooperation of the anterior cingulate cortex and dorsolateral prefrontal cortex for attention shifting. Neuroimage 23: 670–679. [DOI] [PubMed] [Google Scholar]
- Leung HC, Skudlarski P, Gatenby JC, Peterson BS, Gore JC ( 2000): An event‐related functional MRI study of the stroop color word interference task. Cereb Cortex 10: 552–560. [DOI] [PubMed] [Google Scholar]
- MacDonald AW III, Cohen JD, Stenger VA, Carter CS ( 2000): Dissociating the role of the dorsolateral prefrontal and anterior cingulate cortex in cognitive control. Science 288: 1835–1838. [DOI] [PubMed] [Google Scholar]
- Mallet L, Mazoyer B, Martinot JL ( 1998): Functional connectivity in depressive, obsessive‐compulsive, and schizophrenic disorders: An explorative correlational analysis of regional cerebral metabolism. Psychiatry Res 82: 83–93. [DOI] [PubMed] [Google Scholar]
- Maltby N, Tolin DF, Worhunsky P, O'Keefe TM, Kiehl KA ( 2005): Dysfunctional action monitoring hyperactivates frontal‐striatal circuits in obsessive‐compulsive disorder: An event‐related fMRI study. Neuroimage 24: 495–503. [DOI] [PubMed] [Google Scholar]
- Mansouri FA, Tanaka K, Buckley MJ ( 2009): Conflict‐induced behavioral adjustment: A clue to the executive functions of the prefrontal cortex. Nat Rev Neurosci 10: 141–152. [DOI] [PubMed] [Google Scholar]
- Mead LA, Mayer AR, Bobholz JA, Woodley SJ, Cunningham JM, Hammeke TA, Rao SM ( 2002): Neural basis of the Stroop interference task: Response competition or selective attention? J Int Neuropsychol Soc 8: 735–742. [DOI] [PubMed] [Google Scholar]
- Mechelli A, Price CJ, Noppeney U, Friston KJ ( 2003): A dynamic causal modeling study on category effects: Bottom‐up or top‐down mediation? J Cogn Neurosci 15: 925–934. [DOI] [PubMed] [Google Scholar]
- Medalla M, Barbas H ( 2009): Synapses with inhibitory neurons differentiate anterior cingulate from dorsolateral prefrontal pathways associated with cognitive control. Neuron 61: 609–620. [DOI] [PMC free article] [PubMed] [Google Scholar]
- Miezin FM, Maccotta L, Ollinger JM, Petersen SE, Buckner RL ( 2000): Characterizing the hemodynamic response: Effects of presentation rate, sampling procedure, and the possibility of ordering brain activity based on relative timing. Neuroimage 11( 6 Part 1): 735–759. [DOI] [PubMed] [Google Scholar]
- Milham MP, Banich MT, Claus ED, Cohen NJ ( 2003): Practice‐related effects demonstrate complementary roles of anterior cingulate and prefrontal cortices in attentional control. Neuroimage 18: 483–493. [DOI] [PubMed] [Google Scholar]
- Paus T, Koski L, Caramanos Z, Westbury C ( 1998): Regional differences in the effects of task difficulty and motor output on blood flow response in the human anterior cingulate cortex: A review of 107 PET activation studies. Neuroreport 9: R37–R47. [DOI] [PubMed] [Google Scholar]
- Penny WD, Stephan KE, Mechelli A, Friston KJ ( 2004a) Comparing dynamic causal models. Neuroimage 22: 1157–1172. [DOI] [PubMed] [Google Scholar]
- Penny WD, Stephan KE, Mechelli A, Friston KJ ( 2004b): Modeling functional integration: A comparison of structural equation and dynamic causal models. Neuroimage 23 ( Suppl 1): S264–S274. [DOI] [PubMed] [Google Scholar]
- Peterson BS, Skudlarski P, Gatenby JC, Zhang H, Anderson AW, Gore JC ( 1999): An fMRI study of Stroop word‐color interference: Evidence for cingulate subregions subserving multiple distributed attentional systems. Biol Psychiatry 45: 1237–1258. [DOI] [PubMed] [Google Scholar]
- Remijnse PL, Nielen MM, van Balkom AJ, Cath DC, van Oppen P, Uylings HB, Veltman DJ ( 2006): Reduced orbitofrontal‐striatal activity on a reversal learning task in obsessive‐compulsive disorder. Arch Gen Psychiatry 63: 1225–1236. [DOI] [PubMed] [Google Scholar]
- Ridderinkhof KR, van den Wildenberg WP, Segalowitz SJ, Carter CS ( 2004): Neurocognitive mechanisms of cognitive control: The role of prefrontal cortex in action selection, response inhibition, performance monitoring, and reward‐based learning. Brain Cogn 56: 129–140. [DOI] [PubMed] [Google Scholar]
- Rushworth MF, Behrens TE ( 2008): Choice, uncertainty and value in prefrontal and cingulate cortex. Nat Neurosci 11: 389–397. [DOI] [PubMed] [Google Scholar]
- Schlösser R, Gesierich T, Kaufmann B, Vucurevic G, Hunsche S, Gawehn J, Stoeter P ( 2003): Altered effective connectivity during working memory performance in schizophrenia: A study with fMRI and structural equation modeling. Neuroimage 19: 751–763. [DOI] [PubMed] [Google Scholar]
- Schlösser RGM, Wagner G, Sauer H ( 2006): Assessing the working memory network: Studies with functional magnetic resonance imaging and structural equation modeling. Neuroscience 139: 91–103. [DOI] [PubMed] [Google Scholar]
- Schlösser RGM, Koch K, Wagner G ( 2007): Assessing the state space of the brain with fMRI: An integrative view of current methods. Pharmacopsychiatry 40 ( Suppl 1): S85–S92. [Google Scholar]
- Schlösser RGM, Wagner G, Koch K, Dahnke R, Reichenbach JR, Sauer H ( 2008): Fronto‐cingulate effective connectivity in major depression: A study with fMRI and dynamic causal modeling. Neuroimage 43: 645–655. [DOI] [PubMed] [Google Scholar]
- Stephan KE, Friston KJ, Frith CD ( 2009a) Dysconnection in schizophrenia: From abnormal synaptic plasticity to failures of self‐monitoring. Schizophr Bull 35: 509–527. [DOI] [PMC free article] [PubMed] [Google Scholar]
- Stephan KE, Penny WD, Daunizeau J, Moran RJ, Friston KJ ( 2009b) Bayesian model selection for group studies. Neuroimage 46: 1004–1017. [DOI] [PMC free article] [PubMed] [Google Scholar]
- Stuss DT, Floden D, Alexander MP, Levine B, Katz D ( 2001): Stroop performance in focal lesion patients: Dissociation of processes and frontal lobe lesion location. Neuropsychologia 39: 771–786. [DOI] [PubMed] [Google Scholar]
- Summerfield C, Egner T, Greene M, Koechlin E, Mangels J, Hirsch J ( 2006): Predictive codes for forthcoming perception in the frontal cortex. Science 314: 1311–1314. [DOI] [PubMed] [Google Scholar]
- Ullsperger M, von Cramon DY ( 2004): Decision making, performance and outcome monitoring in frontal cortical areas. Nat Neurosci 7: 1173–1174. [DOI] [PubMed] [Google Scholar]
- Ursu S, Stenger VA, Shear MK, Jones MR, Carter CS ( 2003): Overactive action monitoring in obsessive‐compulsive disorder: Evidence from functional magnetic resonance imaging. Psychol Sci 14: 347–353. [DOI] [PubMed] [Google Scholar]
- van den Heuvel OA, Veltman DJ, Groenewegen HJ, Cath DC, van Balkom AJLM, van Hartskamp J, Barkhof F, van Dyck R ( 2005): Frontal‐striatal dysfunction during planning in obsessive‐compulsive disorder. Arch Gen Psychiatry 62: 301–309. [DOI] [PubMed] [Google Scholar]
- Wagner G, Sinsel E, Sobanski T, Kohler S, Marinou V, Mentzel HJ, Sauer H, Schlosser RG. ( 2006): Cortical inefficiency in patients with unipolar depression: An event‐related FMRI study with the Stroop task. Biol Psychiatry 59: 958–965. [DOI] [PubMed] [Google Scholar]
- Walton ME, Croxson PL, Behrens TE, Kennerley SW, Rushworth MF ( 2007): Adaptive decision making and value in the anterior cingulate cortex. Neuroimage 36 ( Suppl 2): T142–T154. [DOI] [PMC free article] [PubMed] [Google Scholar]
- Yoon U, Lee JM, Im K, Shin YW, Cho BH, Kim IY, Kwon JS, Kim SI ( 2007): Pattern classification using principal components of cortical thickness and its discriminative pattern in schizophrenia. Neuroimage 34: 1405–1415. [DOI] [PubMed] [Google Scholar]
- Zysset S, Muller K, Lohmann G, von Cramon DY ( 2001): Color‐word matching stroop task: Separating interference and response conflict. Neuroimage 13: 29–36. [DOI] [PubMed] [Google Scholar]