

Abstract
In early blindness, the primary visual area (PVA) loses the ability to process visual information, and shifts to working on the processing of somatosensory input, auditory input, and some higher‐level cognitive functions. It has not yet been investigated whether such functional changes can lead to alterations of the functional connectivity between the PVA and other brain areas in resting state. The purpose of this study is to investigate the differences in the functional connectivity of the PVA between early blind and sighted subjects using resting functional MRI data. The altered functional connectivity was identified by comparing the correlation coefficients of the PVA with other brain areas between 16 early blind subjects (blindness onset within 1 year of age) and 32 gender‐ and age‐matched healthy sighted volunteers. Compared with the sighted, the early blind subjects showed decreased functional connectivity between the left PVA and the bilateral supplementary motor area (SMA), pre‐ and postcentral gyri, superior parietal lobule, and the left superior and middle temporal gyri. Early blind subjects also showed decreased functional connectivity between the right PVA and the bilateral SMA, pre‐ and postcentral gyri. Our findings suggest that early deprivation of a single sensory modality induces alterations of functional connectivity between the deprived functional area and other associated brain areas. Hum Brain Mapp, 2008. © 2007 Wiley‐Liss, Inc.
Keywords: human brain, early blindness, resting state, functional connectivity, primary visual area, functional magnetic resonance imaging
INTRODUCTION
The human brain shows slow fluctuations of regional cerebral blood flow when it is performing no prescribed tasks [Haughton and Biswal, 1998; Hudetz, 1997]. The slow changes of regional cerebral blood flow may induce low‐frequency (<0.08 Hz) fluctuations (LFF) of the signal in the blood oxygen level‐dependent (BOLD) MR imaging. Many researchers have pointed out that the LFF during resting state might be related to neuronal spontaneous activity [Biswal et al., 1995; Greicius et al., 2003; Lowe et al., 1998; Salvador et al., 2005a, b]. In functionally related brain regions, even located remotely, these fluctuations are synchronous [Biswal et al., 1995; Lowe et al., 1998], which implies the existence of neuronal connections that facilitate coordinated activity. To describe the relationship between functionally related brain regions, the term functional connectivity has been used as a measure of the spatiotemporal synchrony or correlations of the BOLD signal between anatomically distinct brain regions [Biswal et al., 1995; Friston et al., 1993; Greicius et al., 2003; Hampson et al., 2002; Lowe et al., 1998; Salvador et al., 2005a, b; Xiong et al., 1999]. Recently, the patterns of the functional connectivity in a resting state have been found to change in some diseased states, i.e., Alzheimer disease, [Greicius et al., 2004; Wang et al., 2006], schizophrenia [Liang et al., 2006], temporal lobe epilepsy [Waites et al., 2006], and multiple sclerosis [Lowe et al., 2002]. However, no study has been done to investigate if the functional connectivity is altered in the early deprivation of a single sensory modality, such as early visual deprivation.
The function of processing visual input of the primary visual area (PVA) is deprived in early‐onset blind subjects. Many previous studies investigated the plastic changes of the PVA in the early blind using task‐based functional MRI (fMRI) and found that the PVA of these patients became responsive to somatosensory input [Büchel et al., 1998; Burton et al., 2002a, 2006; Gizewski et al., 2003; Sadato, 2005; Sadato et al., 1996, 1998], auditory input [Amedi et al., 2003; Gougoux et al., 2004, 2005; Leclerc et al., 2000; Poirier et al., 2006; Roder et al., 1999, 2001; Weeks et al., 2000], and some complex cognitive tasks [Amedi et al., 2003; Burton et al., 2002b; De Volder et al., 2001; Lambert et al., 2004; Raz et al., 2005; Roder et al., 2002; Vanlierde et al., 2003]. These studies indicate that the PVA participates in processing input from other sensory modalities. However, it has not been investigated whether such functional changes of the PVA can lead to alterations of functional connectivity between itself and other brain areas in resting state.
In the present study, our purpose is to address the above‐mentioned question. To this end, fMRI of 16 early blind subjects and 32 gender‐ and age‐matched sighted subjects were acquired while they were at rest. They were instructed to keep their eyes closed, relax their minds, and move as little as possible during the scanning sessions. The temporal synchrony between the PVA and other brain areas during rest was assessed using correlation analysis. Then a two‐sample t‐test in a voxel‐wise manner was used to determine the brain regions that showed significant differences between the two groups in correlation with each side of the PVA.
SUBJECTS AND METHODS
Participants
Eighteen early‐onset blind subjects (loss of sight at birth or within 1 year of age) were recruited from the Special Education College of Beijing Union University. The data from two blind subjects were discarded because one subject had uncorrectable motion artifacts and the other had a lesion in the right cerebral hemisphere. Therefore, only the MR data from the remaining 16 early blind subjects (nine men and seven women; mean age, 22.1 years; range, 16–29 years) were used for further analysis. Demographic characteristics of the 16 early blind subjects were shown in Table I. Thirty‐two gender‐ and age‐matched (two‐sample t‐test, P = 0.953) healthy sighted subjects (18 men and 14 women; mean age, 22.1 years; range, 17–28 years) were recruited as controls. All participating subjects were right‐handed, had no neurological diseases, psychiatric disorders, or structural brain abnormalities on conventional MR images. We evaluated the handedness using a questionnaire that was designed according to the Edinburgh handedness inventory [Oldfield, 1971; Raczkowski et al., 1974]. All subjects were asked to answer it by themselves. We used a strict criterion for the assessment of handedness, that is, only subjects who did all the items with their right hands were categorized as right‐handed. Local Ethical Committee approval from the Medical Research Ethics Committee of Xuanwu Hospital of Capital University of Medical Sciences and written informed consent from all subjects was obtained before the MR examinations.
Table I.
Demographic characteristics of blind subjects
| ID | Sex | Age (year) | Preferred hand | Onset age (year) | Cause of blindness |
|---|---|---|---|---|---|
| 1 | F | 22.8 | Right | 0 | Retinitis pigmentosa |
| 2 | M | 20.9 | Right | 0 | Retinitis pigmentosa |
| 3 | M | 24.6 | Right | 0 | Optic nerve atrophy |
| 4 | M | 19.1 | Right | 0 | Retinitis pigmentosa |
| 5 | M | 24.6 | Right | 0 | Retinitis pigmentosa and optic nerve atrophy |
| 6 | F | 23.6 | Right | 0 | Optic nerve hypoplasia |
| 7 | M | 22.4 | Right | <1 | Congenital glaucoma |
| 8 | M | 29.3 | Right | 0 | Optic nerve hypoplasia |
| 9 | M | 23.4 | Right | <1 | Congenital glaucoma |
| 10 | F | 26.6 | Right | 0 | Optic nerve atrophy |
| 11 | F | 15.6 | Right | 0 | Optic nerve atrophy |
| 12 | F | 18.4 | Right | 0 | Retinitis pigmentosa |
| 13 | F | 21.7 | Right | 0 | Congenital cataract |
| 14 | F | 21.7 | Right | 0 | Congenital glaucoma and cataract |
| 15 | M | 18.7 | Right | 0 | Optic nerve hypoplasia |
| 16 | M | 20.8 | Right | 0 | Retrolental fibroplasias |
Imaging Methods
MR imaging was carried out using a 3.0‐T MR scanner (Magnetom Trio, Siemens, Erlangen, Germany). Foam pads were used to reduce head movements and scanner noise. Structural T1‐weighted images were acquired in a sagittal orientation employing a magnetization prepared rapid gradient echo (MP‐RAGE) sequence (repetition/echo time [TR/TE] = 2,000/2.6 ms; flip angle = 9°) with a voxel size of 1 × 1 × 1 mm3. MR images sensitized to changes in BOLD signal levels (TR/TE = 2,000/30 ms; flip angle = 90°) were obtained by a gradient‐echo echo planar imaging (EPI) sequence. The slice thickness was set to 3 mm (slice gap = 1 mm) with a matrix size of 64 × 64 and a field‐of‐view (FOV) of 220 × 220 mm2, which resulted in a voxel size of 3.4 × 3.4 × 4 mm3. Each brain volume comprised 32 axial sections, and each functional run contained 270 image volumes. While the fMRI data was acquired, all subjects were instructed to keep their eyes closed, relax their mind, and move as little as possible.
Data Preprocessing Analysis
The first 10 BOLD images were discarded to eliminate the unstable initial MRI signals, and allowed the subjects to adapt to the scanning situation. Then the remaining 260 functional MR images were preprocessed as follows: (1) each image was corrected for acquisition time delay between different slices and corrected for geometrical displacements resulting from the estimated head movement and realigned to the first volume; (2) each image was normalized with the Montreal Neurological Institute (MNI) EPI template image and resampled to 3‐mm cubic voxels; (3) the normalized BOLD images were smoothed by a 4‐mm FWHM Gaussian kernel to decrease spatial noise; (4) the time series of each voxel was further corrected for the effects of head movement by regression on the time series of translations and rotations of the head, which were estimated in the course of initial movement correction by image realignment; (5) a band‐pass frequency filter (0.01–0.08 Hz) was applied to reduce low‐frequency drift and high‐frequency noise [Fox et al., 2005; Greicius et al., 2003; Liang et al., 2006]. The first three image preprocessing steps were conducted using the SPM2 software package (Wellcome Department of Imaging Neuroscience; http://www.fil.ion.ucl.ac.uk/spm), the fourth step was processed using our in‐house software, and the last step was processed using the AFNI software package (http://afni.nimh.nih.gov/).
Definition of Region of Interest
The PVA of the brain generally refers to Brodmann area (BA) 17. To define the region of interest (ROI) as precisely as possible, we chose each side of the BA17 as ROIs using the software of WFU_PickAtlas (http://www.ansir.wfubmc.edu/) [Maldjian et al., 2003], which has been used in previous studies to define ROIs [Schon et al., 2005; Williams et al., 2004]. The procedures for defining the seed ROI of the PVA were as follows: (1) each side of the BA17 and the brain gray matter were selected from the TD (Talairach Daemon) BA atlas; (2) the left BA17 and the brain gray matter were intersected to generate the left ROI of the PVA; (3) in the same way, the right ROI was generated.
Functional Connectivity and Statistical Analyses
Functional connectivity and statistical analyses were performed using the SPM2 software package (Wellcome Department of Imaging Neuroscience; http://www.fil.ion.ucl.ac.uk/spm). Functional connectivity analysis was performed for the left and right PVA, respectively. A seed reference time series of each ROI was obtained by averaging the fMRI time series of all voxels within the ROI. Correlation analysis of the time series was carried out between the seed ROI and other brain regions in a voxel‐wise manner. For further statistical analysis, the correlation coefficients were transformed to z‐values using the Fisher r‐to‐z transformation to improve the normality of the correlation coefficients.
The z‐values were entered into a one‐sample t‐test in a voxel‐wise manner to determine the brain regions that showed significant functional connectivity with the left PVA within each group, and the false discovery rate (FDR) method with a threshold of P < 0.000001 was used to correct for multiple comparisons. This method has been introduced in detail in SPM2 (http://www.fil.ion.ucl.ac.uk/spm). We chose a relatively stringent threshold of the P value because of the null hypothesis of correlation coefficient = 0 and the relative large sample size. Then the same statistical analysis was performed to obtain the functional connectivity maps of the right PVA within each group.
The z‐values were also entered into a two‐sample t‐test in a voxel‐wise manner to determine the brain regions that showed significant differences between the two groups in correlation with the left PVA. A FDR method with a threshold of P < 0.01 was used to correct for multiple comparisons. Thirty voxels were used as the threshold of the minimum cluster size to show our results. Exactly the same statistical analyses were performed to obtain the functional connectivity maps of the right PVA to identify the differences of the functional connectivity between the two groups. The final P‐value for the threshold imposed on the displayed data included the following effects: single voxel P‐value, correction for multiple comparisons, and cluster threshold.
RESULTS
Head Motion Effect
Considering that head motion may influence the results of functional connectivity analyses. Each subject was required to have a maximum displacement of less than 1 mm at each axis and a maximum angular motion of less than 1o for each axis. The time courses of head motion were computed by estimating the translations in each direction and the rotations in angular motion about each axis for each of the 260 consecutive volumes, according to the method proposed by Jiang et al. [ 1995]. No significant difference in the peak displacements of head motion between the early blind and the sighted subjects was found (early blind: 0.41 ± 0.17 mm versus sighted subjects: 0.48 ± 0.24 mm; two sample t‐test, P = 0.27).
Functional Connectivity Analysis
The temporal synchrony between the PVA and other brain regions during rest was assessed using correlation analysis. The left and right PVA were used as two seed ROIs (selected by the software of WFU_PickAtlas) for the functional connectivity analysis. First, a one‐sample t‐test in a voxel‐wise manner was performed to determine the brain regions that showed significant functional connectivity with each side of the PVA for each group. In the sighted group, the left PVA showed significant functional connectivity with a large range of brain regions (P < 0.000001, corrected by FDR) (Fig. 1). In the early blind, however, the left PVA only showed significant functional connectivity with occipital regions and cerebellum and did not show any significant functional connectivity with the sensory and motor areas (Fig. 1). Similar results were also obtained in right PVA for each group (Fig. 2). Then, a two‐sample t‐test in a voxel‐wise manner was used to determine the brain regions that showed significant differences between the early blind and the sighted groups in the functional connectivity of each side of the PVA with other brain regions. Compared with the sighted subjects, no significant increased functional connectivity was found in the early blind group. However, in comparison with the sighted subjects, we found several decreased functional connectivity between the PVA and other brain regions in the early blind subjects, when thresholding the statistical parametrical maps at P < 0.01, corrected by FDR. The brain regions that showed decreased functional connectivity with the left PVA were located in the bilateral supplementary motor area (SMA), precentral gyrus (PreCG), postcentral gyrus (PoCG), superior parietal lobule (SPL), and the left superior temporal gyrus (STG) and middle temporal gyrus (MTG) (Figs. 3 and 4; Table II). The brain region showing decreased functional connectivity with the right PVA was restricted to the bilateral SMA, PreCG, and PoCG (Figs. 3 and 4; Table III).
Figure 1.

Brain regions having significant functional connectivity with the left PVA in the sighted group (A) and in the early blind group (B). The figure shows a statistical parametrical map thresholded at P < 0.000001 (FDR corrected) and minimum cluster size of 10 voxels overlaid on high‐resolution T1‐weighted images from one subject in the study. The numbers indicate the position of the slice in MNI space. Color‐coded areas represent brain regions that have significant functional connectivity with the left PVA in each group. In the sighted group, the left PVA shows functional connectivity with a large range of brain regions including sensory and motor areas (A). In the early blind, the left PVA does not show any significant functional connectivity with the sensory and motor areas (B).
Figure 2.

Brain regions having significant functional connectivity with the right primary visual area (PVA) in the sighted group (A) and in the early blind group (B). The figure shows a statistical parametrical map thresholded at P < 0.000001(FDR corrected) and minimum cluster size of 10 voxels overlaid on high‐resolution T1‐weighted images from one subject in the study. The numbers indicate the position of the slice in MNI space. Color‐coded areas represent brain regions that have significant functional connectivity with the right PVA in each group. In the sighted group, the right PVA shows functional connectivity with a large range of brain regions including sensory and motor areas (A). In the early blind, the right PVA does not show any significant functional connectivity with the sensory and motor areas (B).
Figure 3.
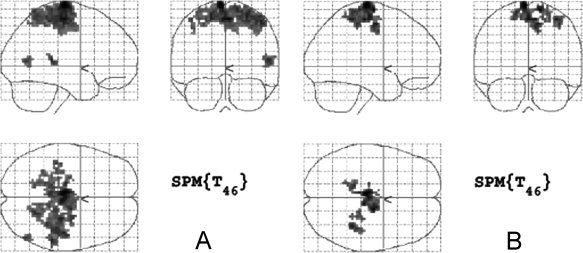
Maximum intensity projection (MIP) images showing brain regions with decreased functional connectivity with the primary visual area (PVA) in the early blind. (A) Voxels that exhibited decreased functional connectivity with the left PVA at the statistical threshold of P < 0.01 (FDR corrected) and minimum cluster size of 30 voxels. (B) Voxels that exhibited decreased functional connectivity with the right PVA at the statistical threshold of P < 0.01 (FDR corrected) and minimum cluster size of 30 voxels.
Figure 4.
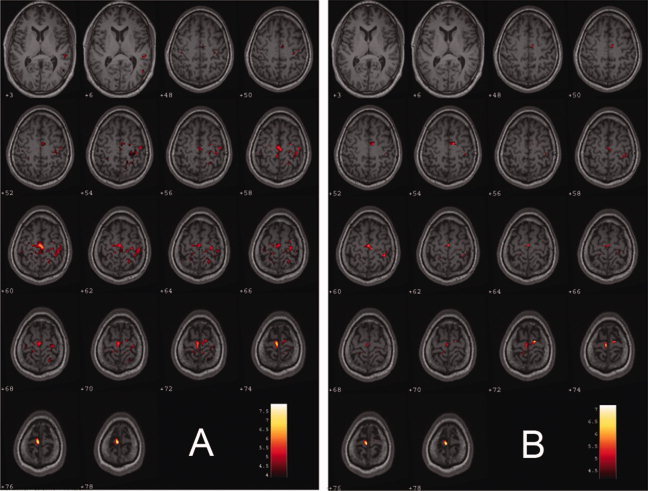
Brain regions having decreased functional connectivity with the primary visual area (PVA) in the early blind. The figure shows a statistical parametrical map thresholded at P < 0.01 (FDR corrected) and a minimum cluster size of 30 voxels overlaid on high‐resolution T1‐weighted images from one subject in the study. The numbers indicate the position of the slice in MNI space. Color‐coded areas represent brain regions that had decreased functional connectivity with the PVA in the early blind subjects. The brain regions having decreased functional connectivity with the left PVA are located in the bilateral supplementary motor area, pre‐ and postcentral gyri, superior parietal lobule, and the left superior and middle temporal gyri (A). The brain regions having decreased functional connectivity with the right PVA are located in the supplementary motor area and pre‐ and postcentral gyri (B).
Table II.
Brain regions having decreased functional connectivity with the left PVA duringresting state in the early blind
| Brain regions | BA | CS | (x, y, z) | Peak t value |
|---|---|---|---|---|
| SMA | 6 | 522 | (−6, −17, 73) | 7.89 |
| (3, −18, 56) | 6.48 | |||
| (15, −8, 67) | 5.73 | |||
| PreCG | 4 | 45 | (−15, −32, 65) | 5.11 |
| 136 | (27, −20, 59) | 5.97 | ||
| PoCG | 3/5/7 | 89 | (−42, −26, 57) | 5.02 |
| 218 | (39, −26, 54) | 5.38 | ||
| SPL | 7 | 33 | (−18, −47, 60) | 4.56 |
| 99 | (21, −49, 61) | 5.08 | ||
| STG | 42 | 34 | (53, −34, 10) | 5.71 |
| (62, −34, 13) | 4.52 | |||
| MTG | 37 | 30 | (50, −67, 9) | 5.01 |
| (50, −61, 3) | 4.32 |
PVA, primary visual area; SMA, supplementary motor area; PreCG, precentral gyrus; PoCG, postocentral gyrus; SPL, superior parietal lobule; STG, superior temporal gyrus; MTG, middle temporal gyrus; BA, Brodmann's area; CS, cluster size; (x, y, z), coordinates of primary peak locations in the space of Talairach.
Table III.
Brain regions having decreased functional connectivity with the right PVA during resting state in the early blind
| Brain regions | BA | CS | (x, y, z) | Peak t value |
|---|---|---|---|---|
| SMA | 6 | 179 | (−6, −17, 73) | 7.16 |
| (0, −15, 59) | 5.93 | |||
| (9, −20, 56) | 5.83 | |||
| PreCG | 4 | 45 | (27, −20, 59) | 4.84 |
| (18, −26, 59) | 4.82 | |||
| (24, −38, 63) | 4.59 | |||
| PoCG | 3 | 129 | (−15, 44, 56) | 4.51 |
| (36, −39, 57) | 5.66 |
PVA, primary visual area; SMA, supplementary motor area; PreCG, precentral gyrus; PoCG, postocentral gyrus; BA, Brodmann's area; CS, cluster size; (x, y, z), coordinates of primary peak locations in the space of Talairach.
DISCUSSION
In the present study, we investigated the functional connectivity between the PVA and other brain areas in the early blind using resting‐state fMRI data. The altered functional connectivity during rest was determined by comparing the correlation coefficients of the PVA with other brain areas between 16 early blind subjects and 32 gender‐ and age‐matched healthy sighted volunteers. We found that the early blind subjects showed decreased functional connectivity between the PVA and the somatosensory, auditory, and motor areas. Our findings suggest that early deprivation of a single sensory modality may lead to alterations of functional connectivity between the deprived functional area and other associated brain regions.
Functional Connectivity During Resting State
Functional connectivity has been used as a measure of the spatiotemporal synchrony of the BOLD signal between anatomically distinct brain regions [Biswal et al., 1995; Friston et al., 1993; Greicius et al., 2003; Hampson et al., 2002; Lowe et al., 1998; Salvador et al., 2005a; Xiong et al., 1999]. In task‐based fMRI experiments, the changes of BOLD signal have been regarded to reflect neuronal activity related to the prescribed tasks, whereas the LFF of the BOLD signal in resting state have been attributed to the spontaneous neuronal activity [Fox et al., 2005; Salvador et al., 2005a; Xiong et al., 1999]. Such synchronous neuronal activity may facilitate the coordination and organization of information processing across several spatial and temporal ranges [Raichle and Mintun, 2006]. Highly synchronous LFF of the BOLD signal has been reported within the primary motor [Biswal et al., 1995; Cordes et al., 2001; Jiang et al., 2004; Lowe et al., 1998], auditory [Cordes et al., 2001], and visual cortices [Lowe et al., 1998], as well as the language regions [Hampson et al., 2002] and limbic system [Fox et al., 2005; Gizewski et al., 2003] of the healthy human brain.
In some diseases, the patterns of the functional connectivity were found to change in resting state. Liang et al. [ 2006] found that patients with schizophrenia showed extensive decreases in functional connectivity within the entire brain, which supports the hypothesis that schizophrenia may arise from the disrupted functional integration of widespread brain areas. Greicius et al. [ 2004] reported that patients with Alzheimer's disease showed decreased resting‐state activity in the posterior cingulate gyrus and hippocampus, suggesting disrupted connectivity between these two regions. Waites et al. [ 2006] studied the changes of functional connectivity between typical language regions in left temporal lobe epilepsy and found reduced functional connectivity between these regions during resting state. Lowe et al. [ 2002] found decreased functional connectivity between right‐ and left‐hemisphere primary motor cortices in patients with multiple sclerosis. These studies indicate that the analysis of the functional connectivity during rest may provide a new avenue to explore the functional abnormalities of some diseases.
Changes of the Function of PVA in Early Blindness
Visual function is critical for sighted people to perfectly perform their routine activities, such as sensing their environment and coordinating their motion. The PVA is an important node for processing visual input. In the early blind, the PVA loses the ability to process visual input in childhood and is reorganized to process the somatosensory input [Büchel et al., 1998; Burton et al., 2002a, 2006; Gizewski et al., 2003; Sadato, 2005; Sadato et al., 1996, 1998], auditory input [Amedi et al., 2003; Gougoux et al., 2004, 2005; Leclerc et al., 2000; Poirier et al., 2006; Roder et al., 1999, 2001; Weeks et al., 2000], and some complex cognitive tasks [Amedi et al., 2003; Burton et al., 2002b; De Volder et al., 2001; Lambert et al., 2004; Raz et al., 2005; Roder et al., 2002; Vanlierde et al., 2003]. That is, the function of the PVA shifts from receiving visual input to processing input from other sensory modalities. This shift in the function of the PVA may induce alterations of functional connectivity between the PVA and other brain areas in resting state. This inspired us to carry out this study.
Decreased Functional Connectivity betweenPVA and Somatosensory Cortices in Early Blindness
Sighted people acquire information about their environment through multiple sensory channels. It is by sampling, comparing, and combining multisensory signals that our brain constructs an accurate representation of space. This process is known as multisensory integration [Avillac et al., 2005]. Visually guided behavior, such as eating, biting, and kissing, require prompt, coordinated processing of spatial visual and somatosensory information [Sereno and Huang, 2006]. In addition, it has been reported that the visual area participates in tactile discrimination of orientation [Sathian and Zangaladze, 2001; Zangaladze et al., 1999] and a vibrotactile discrimination task [Burton et al., 2004] in the sighted subjects, though simple tactile stimuli could not produce the activation of visual areas [Sadato et al., 1996]. The above phenomena and findings indicate that the information from visual and somatosensory input are integrated in the multisensory areas in sighted subjects, through which the PVA and the somatosensory area are connected. Recently, the existence of the functional connectivity between the PVA and the primary somatosensory cortex has also been confirmed by analyzing connectivity data in the macaque monkey using graph‐theoretical tools [Negyessy et al., 2006]. The present study also confirmed the existence of the functional connectivity between the PVA and the somatosensory cortex in the sighted subjects (Figs. 1 and 2).
Compared with the sighted subjects, two factors may influence the resting state functional connectivity between the PVA and the somatosensory area in the early blind. One factor is that the loss of function in the PVA of the early blind may result in decreased functional connectivity between the PVA and the somatosensory area. The other factor is that the function of the PVA is reorganized to participate in processing somatosensory input [Büchel et al., 1998; Burton et al., 2002a, 2006; Gizewski et al., 2003; Sadato, 2005; Sadato et al., 1996, 1998], which may produce a trend of increased functional connectivity between these two areas. Our finding of decreased functional connectivity between the PVA and the somatosensory area in the early blind indicates that the loss of visual function produces a greater effect than the reorganization of the PVA.
Decreased Functional Connectivity between PVA and Temporal Cortices in Early Blindness
In the present study, we also found the decreased functional connectivity between the left PVA and the left STG (Brodmann 42, 34 voxels) and MTG (Brodmann 37, 30 voxels). Although the cluster size is relatively small, it seems that the decreased functional connectivity between these brain regions has physiological significance. The STG (Brodmann 42) is the secondary auditory area, which processes auditory information, such as sounds with discontinued acoustic patterns [Mirz et al., 1999]. The MTG (Brodmann 37) is considered as a multimodal region, which integrates visual and auditory information [Beauchamp et al., 2004]. In the sighted healthy subjects, the visual and auditory brain areas work together to recognize an object by identifying the visual and auditory features, respectively. These two kinds of brain regions are functionally connected by the posterior MTG [Beauchamp et al., 2004]. In early blind, the auditory and visual areas can not work together to process information because of the deprivation of sight, which may explain why the functional connectivity between the PVA and STG and MTG were decreased in these subjects.
Decreased Functional Connectivity Between PVA and Motor Areas in Early Blindness
In the sighted people, the coordination of visual and motor systems, especially eye‐hand coordination, is critical for their routine life. Behavioral experiments have demonstrated the eye and hand motor systems interact during coordinated responses [Desmurget et al., 1998]. We need good eye‐hand coordination to perform many activities, such as picking up a tea cup, using chopsticks, pressing a doorbell, and so on. It involves many synergistic functional systems of the brain, which works coordinately to optimize the accuracy of hand motion [Christensen et al., 2006]. A previous PET study showed that the PVA and the motor systems were synchronously activated when performing some difficult goal‐directed reciprocal aiming tasks [Winstein et al., 1997]. On the basis of the above facts, we suggest that there exists functional connectivity between the PVA and the motor areas in the healthy sighted subjects. The present study also confirmed the existence of the functional connectivity between the PVA and the motor areas in sighted subjects (Figs. 1 and 2). In the early blind, the PVA lost the function of processing visual input, which may lead to the decrease of the functional connectivity between the PVA and the motor area.
Individual Effects on Group Differences
To ensure that each of the significantly different clusters is not dominated by a few subjects, we selected each cluster where functional connectivity with the left PVA was significantly different between groups as a mask. For each subject, we obtained a mean z‐score by averaging the z‐scores of the voxels within this mask. Then we obtained the distribution map of the mean z‐scores of the functional connectivity between the left PVA and each of the significant clusters (see Fig. 5). Exactly the same analyses were performed for the right PVA (see Fig. 6). For each cluster, the distribution of the mean z‐scores of the early blind was obviously different from that of the sighted subjects (Figs. 5 and 6). All the sighted subjects showed relative higher positive mean z‐scores, whereas most of the early blind subjects showed relative lower positive mean z‐scores. Moreover, several blind subjects show negative mean z‐scores. Thus we may conclude that our results reflect a group effect rather than an effect of several extreme values.
Figure 5.
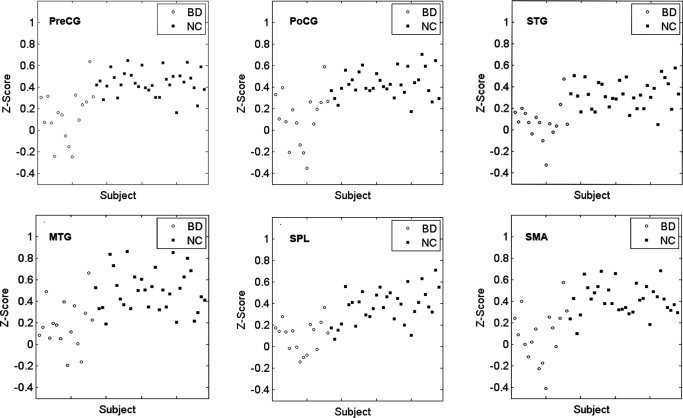
Distribution of mean z‐scores of functional connectivity between the left PVA and each of the significant clusters. For each cluster, the distribution of the mean z‐scores of the early blind was obviously different from that of the sighted subjects. BD, early blind subjects; NC, sighted subjects; PVA, primary visual area; SMA, supplementary motor area; PreCG, precentral gyrus; PoCG, postocentral gyrus; SPL, superior parietal lobule; STG, superior temporal gyrus; MTG, middle temporal gyrus.
Figure 6.
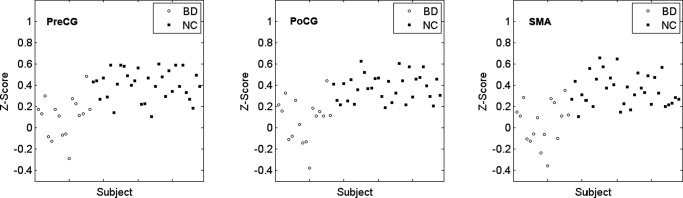
Distribution of mean z‐scores of functional connectivity between the right PVA and each of the significant clusters. For each cluster, the distribution of the mean z‐scores of the early blind was obviously different from that of the sighted subjects. BD, early blind subjects; NC, sighted subjects; PVA, primary visual area; SMA, supplementary motor area; PreCG, precentral gyrus; PoCG, postocentral gyrus.
Limitations
There are some methodological limitations in the present study that should be considered when interpreting our results. Head movement caused by slow rotation or translation of the subject's head may induce noise to the time series data. Although we have applied a linear regression method to reduce its influence, we can not eliminate them completely. Another limitation of this study is that we can not exclude the influence of physiological noise since we used a relatively low sampling rate (TR = 2 s) for multi‐slice acquisitions. Under this sampling rate, respiratory and cardiac fluctuations may be present in the time series data, which may reduce the specificity of low frequency fluctuations to functional connected regions [Lowe et al., 1998]. In this study, we used a band‐pass filtering of 0.01–0.08 Hz to partly reduce these physiological noises [Fox et al., 2005; Greicius et al., 2003; Liang et al., 2006]. However, the filtering can not eliminate them completely. Moreover, subtle changes in a subject's breathing rate or depth, which occur naturally during rest at low frequencies (<0.1 Hz), have been shown to be significantly correlated with fMRI signal changes throughout gray matter and near large vessels [Birn et al., 2006; Wise et al., 2004]. As the authors [Birn et al., 2006] suggested, we cued the subjects to breathe at a relatively constant rate and depth to partly reduce such effects. In future studies, these physiological effects should be reduced by some more robust methods as reported in recent studies [Birn et al., 2006; Deckers et al., 2006; Liston et al., 2006; Lund et al., 2006].
CONCLUSION
In the present study, we analyzed the functional connectivity between the PVA and other brain regions in the early blind and sighted subjects and found that the early blind subjects showed decreased functional connectivity between the PVA and the somatosensory and motor areas. The results presented here suggest that early deprivation of a single sensory modality may lead to altered functional connectivity between the deprived functional area and other associated brain regions. This study could supplement the task‐based fMRI studies, in which much attention has been paid to the plastic changes of the brain induced by early deprivation of a single sensory modality.
Contributor Information
Tianzi Jiang, Email: jiangtz@nlpr.ia.ac.cn.
Kuncheng Li, Email: kunchengli1955@yahoo.com.cn.
REFERENCES
- Amedi A, Raz N, Pianka P, Malach R, Zohary E ( 2003): Early ‘visual’ cortex activation correlates with superior verbal memory performance in the blind. Nat Neurosci 6: 758–766. [DOI] [PubMed] [Google Scholar]
- Avillac M, Deneve S, Olivier E, Pouget A, Duhamel JR ( 2005): Reference frames for representing visual and tactile locations in parietal cortex. Nat Neurosci 8: 941–949. [DOI] [PubMed] [Google Scholar]
- Beauchamp MS, Lee KE, Argall BD, Martin A ( 2004): Integration of auditory and visual information about objects in superior temporal sulcus. Neuron 41: 809–823. [DOI] [PubMed] [Google Scholar]
- Birn RM, Diamond JB, Smith MA, Bandettini PA ( 2006): Separating respiratory‐variation‐related fluctuations from neuronal‐activity‐related fluctuations in fMRI. Neuroimage 31: 1536–1548. [DOI] [PubMed] [Google Scholar]
- Biswal B, Yetkin FZ, Haughton VM, Hyde JS ( 1995): Functional connectivity in the motor cortex of resting human brain using echo‐planar MRI. Magn Reson Med 34: 537–541. [DOI] [PubMed] [Google Scholar]
- Büchel C, Price C, Frackowiak RSJ, Friston KJ ( 1998): Different activation patterns in the visual cortex of late and congenitally blind subjects. Brain 121: 409–419. [DOI] [PubMed] [Google Scholar]
- Burton H, Snyder AZ, Conturo TE, Akbudak E, Ollinger JM, Raichle ME ( 2002a): Adaptive changes in early and late blind: A fMRI study of Braille reading. J Neurophysiol 87: 589–607. [DOI] [PMC free article] [PubMed] [Google Scholar]
- Burton H, Snyder AZ, Diamond JB, Raichle ME ( 2002b): Adaptive changes in early and late blind: A FMRI study of verb generation to heard nouns. J Neurophysiol 88: 3359–3371. [DOI] [PMC free article] [PubMed] [Google Scholar]
- Burton H, Sinclair RJ, McLaren DG ( 2004): Cortical activity to vibrotactile stimulation: A fMRI study in blind and sighted individuals. Hum Brain Mapp 23: 210–228. [DOI] [PMC free article] [PubMed] [Google Scholar]
- Burton H, McLaren DG, Sinclair RJ ( 2006): Reading embossed capital letters: An fMRI study in blind and sighted individuals. Hum Brain Mapp 27: 325–339. [DOI] [PMC free article] [PubMed] [Google Scholar]
- Christensen MS, Ramsoy TZ, Lund TE, Madsen KH, Rowe JB ( 2006): An fMRI study of the neural correlates of graded visual perception. NeuroImage 31: 1711–1725. [DOI] [PubMed] [Google Scholar]
- Cordes D, Haughton VM, Arfanakis K, Carew JD, Turski PA, Moritz CH, Quigley MA, Meyerand ME ( 2001): Frequencies contributing to functional connectivity in the cerebral cortex in “resting‐state” data. Am J Neuroradiol 22: 1326–1333. [PMC free article] [PubMed] [Google Scholar]
- Deckers RH, van Gelderen P, Ries M, Barret O, Duyn JH, Ikonomidou VN, Fukunaga M, Glover GH, de Zwart JA ( 2006): An adaptive filter for suppression of cardiac and respiratory noise in MRI time series data. Neuroimage 33: 1072–1081. [DOI] [PMC free article] [PubMed] [Google Scholar]
- De Volder AG, Toyama H, Kimura Y, Kiyosawa M, Nakano H, Vanlierde A, Wanet‐Defalque MC, Mishina M, Oda K, Ishiwata K, Senda M ( 2001): Auditory triggered mental imagery of shape involves visual association areas in early blind humans. NeuroImage 14: 129–139. [DOI] [PubMed] [Google Scholar]
- Desmurget M, Pelisson D, Rossetti Y, Prablanc C ( 1998): From eye to hand: Planning goal‐directed movements. Neurosci Biobehav Rev 22: 761–788. [DOI] [PubMed] [Google Scholar]
- Fox MD, Snyder AZ, Vincent JL, Corbetta M, Van Essen DC, Raichle ME ( 2005): The human brain is intrinsically organized into dynamic, anticorrelated functional networks. Proc Natl Acad Sci USA 102: 9673–9678. [DOI] [PMC free article] [PubMed] [Google Scholar]
- Friston KJ, Frith CD, Liddle PF, Frackowiak RSJ ( 1993): Functional connectivity: The principal‐component analysis of large (PET) data sets. J Cereb Blood Flow Metab 13: 5–14. [DOI] [PubMed] [Google Scholar]
- Gizewski ER, Gasser T, Greiff A, Boehm A, Forsting M ( 2003): Cross‐modal plasticity for sensory and motor activation patterns in blind subjects. NeuroImage 19: 968–975. [DOI] [PubMed] [Google Scholar]
- Gougoux F, Lepore F, Lassonde M, Voss P, Zatorre RJ, Belin P ( 2004): Neuropsychology: Pitch discrimination in the early blind. Nature 430: 309. [DOI] [PubMed] [Google Scholar]
- Gougoux F, Zatorre RJ, Lassonde M, Voss P, Lepore F ( 2005): A functional neuroimaging study of sound localization: Visual cortex activity predicts performance in early‐blind individuals. PLoS Biol 3: e27. [DOI] [PMC free article] [PubMed] [Google Scholar]
- Greicius MD, Krasnow B, Reiss AL, Menon V ( 2003): Functional connectivity in the resting brain: A network analysis of the default mode hypothesis. Proc Natl Acad Sci USA 100: 253–258. [DOI] [PMC free article] [PubMed] [Google Scholar]
- Greicius MD, Srivastava G, Reiss AL, Menon V ( 2004): Default‐mode network activity distinguishes Alzheimer's disease from healthy aging: Evidence from functional MRI. Proc Natl Acad Sci USA 101: 4637–4642. [DOI] [PMC free article] [PubMed] [Google Scholar]
- Hampson M, Peterson BS, Skudlarski P, Gatenby JC, Gore JC ( 2002): Detection of functional connectivity using temporal correlations in MR images. Hum Brain Mapp 15: 247–262. [DOI] [PMC free article] [PubMed] [Google Scholar]
- Haughton VM, Biswal B ( 1998): Clinical application of basal regional cerebral blood flow fluctuation measurements by FMRI. Adv Exp Med Biol 454: 583–590. [DOI] [PubMed] [Google Scholar]
- Hudetz AG ( 1997): Blood flow in the cerebral capillary network: A review emphasizing observations with intravital microscopy. Microcirculation 4: 233–252. [DOI] [PubMed] [Google Scholar]
- Jiang A, Kennedy DN, Baker JR, Weisskoff RM, Tootell BH, Woods RP, Benson RR, Kwong KK, Brady TJ, Rosen BR, Belliveau JW ( 1995): Motion detection and correction in functional MR imaging. Hum Brain Mapp 3: 224–235. [Google Scholar]
- Jiang T, He Y, Zang Y, Weng X ( 2004): Modulation of functional connectivity during the resting state and the motor task. Hum Brain Mapp 22: 63–71. [DOI] [PMC free article] [PubMed] [Google Scholar]
- Lambert S, Sampaio E, Mauss Y, Scheiber C ( 2004): Blindness and brain plasticity: Contribution of mental imagery? An fMRI study. Brain Res Cogn Brain Res 20: 1–11. [DOI] [PubMed] [Google Scholar]
- Leclerc C, Saint‐Amour D, Lavoie ME, Lassonde M, Lepore F ( 2000): Brain functional reorganization in early blind humans revealed by auditory event‐related potentials. Neuroreport 11: 545–550. [DOI] [PubMed] [Google Scholar]
- Liang M, Zhou Y, Jiang T, Liu Z, Tian L, Liu H, Hao Y ( 2006): Widespread functional disconnectivity in schizophrenia with resting‐state functional magnetic resonance imaging. Neuroreport 17: 209–213. [DOI] [PubMed] [Google Scholar]
- Liston AD, Lund TE, Salek‐Haddadi A, Hamandi K, Friston KJ, Lemieux L ( 2006): Modelling cardiac signal as a confound in EEG‐fMRI and its application in focal epilepsy studies. Neuroimage 30: 827–834. [DOI] [PubMed] [Google Scholar]
- Lowe MJ, Mock BJ, Sorenson JA ( 1998): Functional connectivity in single and multislice echoplanar imaging using resting‐state fluctuations. NeuroImage 7: 119–132. [DOI] [PubMed] [Google Scholar]
- Lowe MJ, Phillips MD, Lurito JT, Mattson D, Dzemidzic M, Mathews VP ( 2002): Multiple sclerosis: Low‐frequency temporal blood oxygen level‐dependent fluctuations indicate reduced functional connectivity initial results. Radiology 224: 184–192. [DOI] [PubMed] [Google Scholar]
- Lund TE, Madsen KH, Sidaros K, Luo WL, Nichols TE ( 2006): Non‐white noise in fMRI: Does modelling have an impact? Neuroimage 29: 54–66. [DOI] [PubMed] [Google Scholar]
- Maldjian JA, Laurienti PJ, Kraft RA, Burdette JH ( 2003): An automated method for neuroanatomic and cytoarchitectonic atlas‐based interrogation of fMRI data sets. Neuroimage 19: 1233–1239. [DOI] [PubMed] [Google Scholar]
- Mirz F, Ovesen T, Ishizu K, Johannsen P, Madsen S, Gjedde A, Pedersen CB ( 1999): Stimulus‐dependent central processing of auditory stimuli: A PET study. Scand Audiol 28: 161–169. [DOI] [PubMed] [Google Scholar]
- Negyessy L, Nepusz T, Kocsis L, Bazso F ( 2006): Prediction of the main cortical areas and connections involved in the tactile function of the visual cortex by network analysis. Eur J Neurosci 23: 1919–1930. [DOI] [PubMed] [Google Scholar]
- Oldfield RC ( 1971): The assessment and analysis of handedness: The Edinburgh inventory. Neuropsychologia 9: 97–113. [DOI] [PubMed] [Google Scholar]
- Poirier C, Collignon O, Scheiber C, Renier L, Vanlierde A, Tranduy D, Veraart C, De Volder AG ( 2006): Auditory motion perception activates visual motion areas in early blind subjects. NeuroImage 31: 279–285. [DOI] [PubMed] [Google Scholar]
- Raczkowski D, Kalat JW, Nebes R ( 1974): Reliablity and validity of some handedness questionnaire items. Neuropsychologia 12: 43–47. [DOI] [PubMed] [Google Scholar]
- Raichle ME, Mintun MA ( 2006): Brain work and brain imaging. Annu Rev Neurosci 29: 449–476. [DOI] [PubMed] [Google Scholar]
- Roder B, Teder‐Salejarvi W, Sterr A, Rosler F, Hillyard SA, Neville HJ ( 1999): Improved auditory spatial tuning in blind humans. Nature 400: 162–166. [DOI] [PubMed] [Google Scholar]
- Roder B, Rosler F, Neville HJ ( 2001): Auditory memory in congenitally blind adults: A behavioral‐electrophysiological investigation. Brain Res Cogn Brain Res 11: 289–303. [DOI] [PubMed] [Google Scholar]
- Roder B, Stock O, Bien S, Neville H, Rosler F ( 2002): Speech processing activates visual cortex in congenitally blind humans. Eur J Neurosci 16: 930–936. [DOI] [PubMed] [Google Scholar]
- Raz N, Amedi A, Zohary E ( 2005): V1 activation in congenitally blind humans is associated with episodic retrieval. Cereb Cortex 15: 1459–1468. [DOI] [PubMed] [Google Scholar]
- Sadato N ( 2005): How the blind “see” Braille: Lessons from functional magnetic resonance imaging. Neuroscientist 11: 577–582. [DOI] [PubMed] [Google Scholar]
- Sadato N, Pascual‐Leone A, Grafman J, Ibanez V, Deiber MP, Dold G, Hallett M ( 1996): Activation of the primary visual cortex by Braille reading in blind subjects. Nature 380: 526–528. [DOI] [PubMed] [Google Scholar]
- Sadato N, Pascual‐Leone A, Grafman J, Deiber MP, Ibanez V, Hallett M ( 1998): Neural networks for Braille reading by the blind. Brain 121: 1213–1229. [DOI] [PubMed] [Google Scholar]
- Salvador R, Suckling J, Coleman MR, Pickard JD, Menon D, Bullmore E ( 2005a): Neurophysiological architecture of functional magnetic resonance images of human brain. Cereb Cortex 15: 1332–1342. [DOI] [PubMed] [Google Scholar]
- Salvador R, Suckling J, Schwarzbauer C, Bullmore E ( 2005b): Undirected graphs of frequency‐dependent functional connectivity in whole brain networks. Philos Trans R Soc Lond B Biol Sci 360: 937–946. [DOI] [PMC free article] [PubMed] [Google Scholar]
- Sathian K, Zangaladze A ( 2001): Feeling with the mind's eye: The role of visual imagery in tactile perception. Optom Vis Sci 78: 276–281. [DOI] [PubMed] [Google Scholar]
- Schon K, Atri A, Hasselmo ME, Tricarico MD, LoPresti ML, Stern CE ( 2005): Scopolamine reduces persistent activity related to long‐term encoding in the parahippocampal gyrus during delayed matching in humans. J Neurosci 25: 9112–9123. [DOI] [PMC free article] [PubMed] [Google Scholar]
- Sereno MI, Huang RS ( 2006): A human parietal face area contains aligned head‐centered visual and tactile maps. Nat Neurosci 9: 1337–1343. [DOI] [PubMed] [Google Scholar]
- Vanlierde A, De Volder AG, Wanet‐Defalque MC, Veraart C ( 2003): Occipito‐parietal cortex activation during visuo‐spatial imagery in early blind humans. Neuroimage 19: 698–709. [DOI] [PubMed] [Google Scholar]
- Waites AB, Briellmann RS, Saling MM, Abbott DF, Jackson GD ( 2006): Functional connectivity networks are disrupted in left temporal lobe epilepsy. Ann Neurol 59: 335–343. [DOI] [PubMed] [Google Scholar]
- Wang L, Zang Y, He Y, Liang M, Zhang X, Tian L, Wu T, Jiang T, Li K ( 2006): Changes in hippocampal connectivity in the early stages of Alzheimer's disease: Evidence from resting state fMRI. Neuroimage 31: 496–504. [DOI] [PubMed] [Google Scholar]
- Weeks R, Horwitz B, Aziz‐Sultan A, Tian B, Wessinger CM, Cohen LG, Hallett M, Rauschecker JP ( 2000): A positron emission tomographic study of auditory localization in the congenitally blind. J Neurosci 20: 2664–2672. [DOI] [PMC free article] [PubMed] [Google Scholar]
- Williams MA, Morris AP, McGlone F, Abbott DF, Mattingley JB ( 2004): Amygdala responses to fearful and happy facial expressions under conditions of binocular suppression. J Neurosci 24: 2898–2904. [DOI] [PMC free article] [PubMed] [Google Scholar]
- Winstein CJ, Grafton ST, Pohl PS ( 1997): Motor task difficulty and brain activity: Investigation of goal‐directed reciprocal aiming using positron emission tomography. J Neurophysiol 77: 1581–1594. [DOI] [PubMed] [Google Scholar]
- Wise RG, Ide K, Poulin MJ, Tracey I ( 2004): Resting fluctuations in arterial carbon dioxide induce significant low frequency variations in BOLD signal. Neuroimage 21: 1652–1664. [DOI] [PubMed] [Google Scholar]
- Xiong J, Parsons LM, Gao J, Fox PT ( 1999): Interregional connectivity to primary motor cortex revealed using MRI resting state images. Hum Brain Mapp 8: 151–156. [DOI] [PMC free article] [PubMed] [Google Scholar]
- Zangaladze A, Epstein CM, Grafton ST, Sathian K ( 1999): Involvement of visual cortex in tactile discrimination of orientation. Nature 401: 587–590. [DOI] [PubMed] [Google Scholar]