

Abstract
It is difficult to study the brain “at rest” with an approach generally pursued in science when external manipulation (independent variable) is used to obtain informative measurements (dependent variable) about the object of interest. External manipulation in its classic sense may suspend the resting state, and hence the object of interest will evade. Naturally, unless in a final and irreversible state, biological rest will always be an endogenously dynamic process. Combining two modalities, electroencephalography (EEG) and functional magnetic resonance imaging (fMRI), to simultaneously measure the brain's activity from two angles, one can be chosen to be interpreted as the independent variable and the other as the dependent variable, and without external manipulation the brain's spontaneous dynamics can be studied. The EEG, for example, observes endogenous modulations of vigilance and detects spontaneous events such as sleep spindles or epileptic discharges and can be used as the independent variable, i.e., to form a regressor to interrogate the fMRI data (dependent variable). The opposite is possible as well, and data fusion attempts try using all data both as dependent and independent variables at the same time. This review limits itself to an exemplary discussion of simultaneous EEG/fMRI studies in humans, and among a variety of proposed resting state networks only discusses a few, especially those for which non‐resting state literature has proposed a functional meaning: the “default mode” network and an attentional network. It will be shown that one EEG feature can correlate with different fMRI activation maps and that a single resting state network may be associated with a variety of EEG patterns giving insight into the function of different resting states and the relationship between the two modalities in themselves. Hum Brain Mapp 2008. © 2008 Wiley‐Liss, Inc.
Keywords: EEG, fMRI, endogeneous oscillations, sleep, sleep spindles, alpha, beta, default mode, epilepsy
INTRODUCTION
The Physiology of the Signals and Their Conceptual Link
Blood oxygen level‐dependent (BOLD) functional magnetic resonance imaging (fMRI) measures the haemodynamic correlate of neuronal activity, probably local field potentials (LFP) and—to a lesser degree—multi unit activity [Logothetis et al., 2001]. Accordingly, BOLD signal decreases are related to neuronal activity decreases [Shmuel et al., 2006]. The BOLD signal may reflect also subthreshold activity, simultaneous inhibition with excitation and the result of modulating afferent input of remote neurons [Nunez and Silberstein, 2000].
Scalp electroencephalogram (EEG) measures neuronal activity in the form of postsynaptic excitatory and inhibitory potentials (EPSP and IPSP) of pyramidal cells perpendicular to the cortical surface. The overlap between EPSP and LFP remains unknown, and fMRI and EEG are measurements not of identical neuronal processes, providing valuable complementary information. Because of this, the relationship between simultaneously acquired EEG and fMRI data needs further consideration (see Fig. 1).
Figure 1.
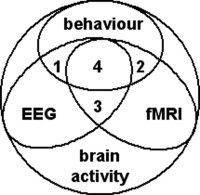
Analytical perspective on the integration of electrophysiological and haemodynamic data. A fraction of all neural processes is reflected by EEG, fMRI and behaviour. Some neural processes manifest in EEG and behaviour (1) or fMRI and behaviour (2). Of the neural processes reflected in both EEG and fMRI there may also be measurable behavioural manifestations (4) or not (3). In both cases, 3 and 4, however, the correlation between EEG and fMRI is direct in that there is a common substrate of neural activity. If behaviour is related to neural processes that also manifest in EEG (1) and fMRI (2) independently, yet without being the identical processes at the source of EEG and fMRI effects, this situation can still result in an indirect but meaningful correlation between fMRI and EEG. Simultaneous multi‐modal experiments benefit from situations where common neural processes are at the origin of EEG and fMRI signals but the most benefit is derived when these neural processes cannot be monitored by or recalibrated to behaviour (3), such as endogenous brain activity. Figure taken from Laufs, Daunizeau et al. [ 2007].
Endogenous Brain Activity
In the context of this review, “endogenous brain activity” shall be considered as not intentionally externally induced or voluntarily generated by the subject, i.e., ongoing brain activity at rest. The study of this type of brain activity becomes especially relevant if one perceives neural processes as mainly intrinsic, weighting, gating and subsequently integrating new and external information into the brain—as opposed to a rather absolute resting state contrasting momentary activity driven by external demands [Raichle and Snyder, 2007].
Without external manipulation, changes in endogenous brain activity can be observed across different stages of vigilance in healthy subjects; in patients, pathologic activity can occur intrinsically in the case of epileptic activity. Both types of changes can be detected and characterized using EEG, the gold standard of determining sleep stages [Rechtschaffen and Kales, 1968] and noninvasively detecting epileptiform activity [Gibbs et al., 1935].
Motivation and Feasibility to Combine Eeg and fMRI
The development of EEG recording during fMRI had its clinical motivation in the wish to localize electrical sources of neuronal activity, in particular epileptic discharges [Ives et al., 1993]. This intention led epilepsy researchers to develop both acquisition hardware and artifact reduction algorithms, such that the methodology today is sufficiently developed to implement a wide variety of experiments as reviewed elsewhere [Gotman et al., 2006; Laufs et al., 2007a; Ritter and Villringer, 2006]. When studying rest with fMRI alone, mainly data driven analysis approaches (functional connectivity, temporal clustering, principal, or independent component analysis) have been used and about a dozen of consistent resting state networks have been identified [Fox and Raichle, 2007]. However, the interpretation of their functional significance remains difficult when assessed unimodally and—necessarily—in the absence of a task and in other words context. Objective assessment of each subject's state during data acquisition (e.g., external observation or via a post hoc questionnaire) has to remain indirect and inaccurate, especially in situations of reduced vigilance. A second perspective on, via a second measure of, brain activity at rest can be obtained by measuring EEG. It can give information on the subject's vigilance state, and to some degree the “state of mind.” Of course, the benefit from EEG when interpreting fMRI maps is limited by how well resting state EEG phenomena and their functional meaning have been studied alone [Laufs et al., 2006c], or on the strength of prior hypotheses [Giraud et al., in press]. Still, its combination with fMRI in the study of the resting state is of great value. Vice versa, EEG/fMRI can help to elucidate the physiology and brain processes which underlie specific EEG phenomena [Laufs et al., 2007b; Schabus et al., 2007].
Endogenous Brain Oscillations in Healthy Volunteers
While neuronal oscillations in different EEG frequency bands and associated topographies have been identified in the context of different types of active mental activity, endogenous brain activity during relaxed wakefulness (awake rest) inherently has been less well characterized, despite being recorded in day‐to‐day clinical practice and having been the first condition that was ever reported to have been assessed with EEG [Berger, 1929]. Hans Berger named the posterior 8–12 Hz oscillations “alpha rhythm,” the most prominent EEG rhythm during the awake resting state. He noticed its desynchronization with ceasing vigilance on the one hand and with engagement in attention demanding tasks on the other [Berger, 1929].
Unsurprisingly, the first EEG/fMRI investigations studying healthy volunteers at rest were concerned with the BOLD correlates of this very prominent EEG feature. In line with electrophysiological animal studies, Goldman et al., Moosmann et al. and—similarly—later Mantini et al. identified thalamic BOLD activity to be positively and occipital‐parietal areas to be inversely correlated with alpha oscillations on scalp EEG, this in turn reflecting their scalp topography [Goldman et al., 2001; Mantini et al., 2007; Moosmann et al., 2003]. Laufs et al.—and, similarly again, Mantini et al. —found a frontal‐parietal network to be associated with alpha desynchronization [Laufs et al., 2003a; Mantini et al., 2007]. In line with Berger's observations, they claimed to have visualized endogenously waxing and waning attention via alpha desynchronization‐associated activity changes in a frontal‐parietal network, previously and independently established as an attentional system [Laufs et al., 2003a, b].
Critically, apart from the thalamic activation associated with alpha power increases [Feige et al., 2005; Goldman et al., 2001; Mantini et al., 2007; Moosmann et al., 2003], none of the mentioned studies in the stricter sense have revealed coherent [cortical] correlates of scalp EEG alpha oscillations; instead, by identifying inverse relationships, they identified brain regions that increase their activity in the absence of marked alpha activity [Laufs et al., 2006c]. When reanalyzing their data, again in congruence with Hans Berger's observations, Laufs et al. found the occipitally pronounced, inversely α‐associated pattern to occur in association with a decline in vigilance. This was supported by a corresponding enhanced spectral density in the theta (4–7 Hz) band, usually observed in drowsiness. Furthermore, activation in occipital brain regions during light sleep compared with wakefulness had been shown with positron emission tomography (PET) [Kjaer et al., 2002]. The failure across studies to identify an average cortical BOLD signal pattern which is positively correlated with alpha power may be explained by nonuniform brain activity at the population level during periods of prominent alpha oscillations which fMRI group analysis must fail to detect [Laufs et al., 2006c].
SIMILAR ELECTRICAL OSCILLATIONS—DIFFERENT fMRI NETWORKS
In the previous section an example was discussed when one EEG‐feature, namely posterior alpha power during relaxed wakefulness (endogenous electrical oscillations), could be associated with different fMRI maps (haemodynamic networks). Slight methodological or analytic differences between the cited studies if at all can only partially explain this effect. Rather, different (dynamic) brain states were studied reflected in several EEG features of which only one, the suppression of occipital alpha oscillations, was included in the above mentioned analyses and which was common to different brain states. This suggested that for a more comprehensive assessment of neural oscillations, broader EEG spectral properties and ideally topographies should be incorporated into any analysis. Additionally, statistical considerations require the parallel evaluation of, for example, multiple EEG frequency bands, especially if the bands are correlated with one another[Laufs et al., 2006c; Mantini et al., 2007]: in this case, for example, if only one of several correlated EEG features is used as a regressor, the attribution of the associated activity will be unspecific.
In a first step to analyze broader EEG frequency content (although not across space), occipital theta, alpha and different beta frequency bands were simultaneously correlated with fMRI data by means of a general linear model. Activity in the β‐2 (17–23 Hz) frequency band was found to correlate with a network of brain areas known as the “default mode network” [Raichle et al., 2001]. No significant theta band correlations were found in the fMRI data in this context [Laufs et al., 2003b]. The “default mode network” (see Fig. 2) was originally identified in PET meta analyses [Mazoyer et al., 2001] and describes a set of brain regions the activity of which is greater at rest than compared with states of reduced consciousness but also than compared to states of extroverted perception and action, i.e., an intermediate state of the brain from which it can either engage in more activity, or less (sleep)—hence its name [Raichle et al., 2001]. Unlike most other resting state networks which were identified by means of data driven fMRI analyses, the “default mode” network was identified as group of areas that consistently exhibit decreases from relative baselines of a wide variety of goal‐directed behaviours monitored with PET and fMRI [Raichle et al., 2001]. Thus a meaning was attached to this network.
Figure 2.
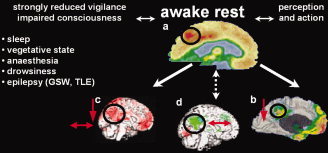
Conditions in which activity in the “default mode” network is affected. Raichle and colleagues coined the term “default mode” network [Raichle et al., 2001] for a set of brain areas comprising the precuneus, dorso‐medial prefrontal cortices and the temporo‐parietal junction [Mazoyer et al., 2001]. Compared to awake rest (a) activity in this network is known to be reduced during extroverted perception and action (b) and also during conditions of impaired consciousness (c–e). Recently, decrease of activity in this network has also been observed in EEG/fMRI studies of epileptic discharges in patients with absence [Gotman et al., 2005; Laufs et al., 2006b] and complex partial seizures [Kobayashi et al., 2006; Laufs et al., 2006a], during which consciousness is impaired (g,f). EEG/fMRI could also reveal dynamic “within state” activity in the “default mode” network during awake rest (i, [Horovitz et al., 2007; Laufs et al., 2003; Mantini et al., 2007]) but also during early sleep stages (h, [Horovitz et al., 2007; Laufs et al., 2007]). GSW – generalized spike and wave activity; TLE – temporal lobe epilepsy; down arrow – relative reduction in activity; up and down arrow – undulating activity; Images: a [Raichle et al., 2001], b [Gusnard and Raichle, 2001], c–e [Laureys et al., 2004], f [Laufs et al., 2006b], g [Laufs et al., 2006a]; i,h [Laufs et al., 2007], [Laufs et al., 2003]).
The identification of this network via a regressor derived from spontaneous EEG (β‐2 power) oscillations suggested that even “at rest” this “default network” was dynamically active. Band‐specificity was demonstrated by an inverse approach correlating a representative fMRI signal time course from a region within the default mode network (left temporo‐parietal junction) with specific EEG sub‐bands [Laufs et al., 2003b]—an example of how EEG can be made the dependent variable.
Martinez‐Montes et al. demonstrated a method analysing EEG “atoms” as the independent variable with spatial, spectral, and temporal signatures correlating them with fMRI “atoms,” the product of spatial and temporal signatures [Martinez‐Montes et al., 2004]. Based on the maximized covariance between corresponding temporal signatures of the EEG and fMRI they identified the α‐band atom to include parieto‐occipital cortex, thalamus, and insula, in correspondence to other published reports discussed above [Goldman et al., 2002; Laufs et al., 2006c; Moosmann et al., 2003]. Mantini et al. also further extended EEG/fMRI integration in an awake rest condition. They incorporated into their analysis EEG bands between 1 and 50 Hz, averaged across the entire scalp and correlated with these bands the fMRI time courses of resting state networks identified by the use of ICA [Mantini et al., 2007]. For four of six identified resting state networks, there was again an almost exclusively inverse correlation between EEG frequency band power (delta, theta, alpha, beta, gamma) and fMRI signals. This possibly indicates that at the group level, a commonality of brain states could only be detected in the form of desynchronization of brain oscillations at different frequencies. Interestingly, the most specific and positive EEG‐fMRI correlation was revealed for the 30–50 Hz gamma band. There is some caveat given that the BOLD signal changes occurred in the frontal lobe near areas typically bound to EPI signal dropout and that 30–50 Hz EEG may contain increased noise. However, if valid, such a finding would be well in line with previous studies on the relationship between neural oscillations reflected in intracranial electrophysiological measurements and the BOLD signal [Lachaux et al., 2007; Logothetis et al., 2001; Niessing et al., 2005]. In any case, it needs to be remembered that fast intracranial oscillations do not translate to scalp EEG one to one.
With simultaneous, invasive intracranial EEG/fMRI measurements yet on the horizon [Carmichael et al., 2007], noninvasive scalp EEG/fMRI experiments are as close as we can currently get to studying the relationship between neural and haemodynamic oscillations in humans. But when drawing conclusions from scalp EEG/fMRI experiments onto the neurophysiology of the BOLD signal, it needs to be carefully assessed whether the EEG‐BOLD correlation can be considered “direct” (compare Fig. 1), i.e., whether the sources of the scalp electrical oscillations overlap with those of the fMRI signal. So far, only a few factors are known that influence the nature of the relationship between neural oscillations measured with scalp EEG and brain networks identified via BOLD‐fMRI. As discussed earlier, the state of vigilance of the subjects studied is an important factor, in addition to the study design and analysis strategy pursued. For example, equal session lengths, consistent spatial coverage, and sufficient smoothing of the fMRI data, proper gradient and ballistocardiogram reduction of the in‐scanner EEG, noise modelling and finally a consistent approach to derive EEG‐based regressors are a prerequisite to avoid invalid or heterogeneous results [Goncalves et al., 2006]. Montage or reference‐selection deserve special attention and will determine whether more local or global EEG properties will be observed [Nunez et al., 2001]. Also, an appropriate and flexible forward model combining EEG and fMRI should be chosen to accommodate interregional or otherwise induced variability in the EEG‐fMRI correspondence both in healthy volunteers [de Munck et al., 2007; Hawco et al., 2007; Laufs et al., 2006b, c; Moeller et al., 2008] and patients. Finally, potentially confounding motion, circulation, and respiration‐related effects need to be accounted for [Birn et al., 2008; Friston et al., 1996; Lund et al., 2005], especially in the context of resting state studies [Birn, 2007; Birn et al., 2006; Laufs et al., 2007b; Lemieux et al., 2007B; Lund et al., 2006].
While Laufs et al. found occipital β‐2 power to correlate positively with the “default mode network,” Mantini et al. additionally found spatially averaged alpha power to co‐vary with BOLD activity in the resting state network. Finally, Scheeringa et al. identified a very similar network during eyes‐open rest inversely correlated with frontal theta power derived using ICA on the EEG data [Scheeringa et al., 2007]. This latter example demonstrates once again how the state of the subject (eyes open, resting in the context of a cognitive task) as well as analysis strategy (frontal EEG power, single frequency band) will affect EEG‐fMRI correspondence. This may be less so if an inherent and possibly conscious processing‐independent physiological principle is studied, for example endogenous cortical rhythms reflecting temporal and spatial constraints of neuronal mechanisms underlying speech perception and production [Giraud et al., in press].
SIMILAR fMRI NETWORKS—DIFFERENT ELECTRICAL OSCILLATIONS
It was demonstrated in the previous paragraph that similar electrical oscillations can correlate with different fMRI oscillations. Vice versa the “default mode” fMRI resting state oscillations have been found to correlate with power in different EEG frequency bands including (during eyes‐closed rest) with spatially averaged alpha and beta [Mantini et al., 2007], posterior β‐2 [Laufs et al., 2003b], and (during eyes open rest) inversely with frontal theta oscillations [Scheeringa et al., 2007].
fMRI functional connectivity analysis suggested that the dynamic resting state activity in this network persists during reduced vigilance [Horovitz et al., in press], and a single case EEG/fMRI study related activity in the “default mode network” during sleep stage II [Rechtschaffen and Kales, 1968] to decreased central alpha power [Laufs et al., 2007b]. While PET data [Maquet, 2000] in line with the “default mode” concept [Raichle et al., 2001] identified a relative activity decrease in that network during sleep compared to wakefulness, it is now clear that this network sustains its activity despite decreasing vigilance, possibly functioning at a lower energetic level. The association of decreased activity in the “default mode network” with yet further EEG features (focal and generalized epileptic activity) will be discussed below.
BRAIN OSCILLATIONS AND NETWORKS DURING SLEEP
A central tool in the study of sleep is the EEG on which a widely accepted classification of different sleep stages is based [Rechtschaffen and Kales, 1968]. EEG/fMRI consequently is an ideal tool to extend investigations of awake resting brain oscillations to states of reduced vigilance. Owing to their limited temporal resolution, EEG/PET studies had to assess sleep stage‐related mean brain activity over many minutes [Maquet, 2000], but could not identify within‐state activity or metabolic correlates of brief sleep‐specific endogenous events such as sleep spindles, vertex sharp waves or K‐complexes. While the first EEG/fMRI study of spontaneous sleep without visual or acoustic stimulation still lived in the spirit of these PET studies [Kaufmann et al., 2006], sleep stage‐specific EEG frequency patterns have meanwhile been studied in a single case alongside an event‐related analysis of sleep spindles and K‐complexes [Laufs et al., 2007b]. A larger study confirmed and extended the findings of sleep spindle‐associated bilateral thalamic, superior temporal and sensori‐motor cortical activations [Schabus et al., 2007]. Both studies discussed the temporal lobe activations as a possible indication for memory processing during sleep; but due to the nature of resting state investigations there was no probing task and this interpretation presently remains speculative. This is an example of a shortcoming of resting state studies even if concurrent EEG information is available.
Delta oscillations are a prominent and characteristic feature of deeper nonrapid eye movement sleep stages [Rechtschaffen and Kales, 1968], but correlating these EEG with fMRI oscillations during sleep stage III and IV in the single case study did not reveal significant fMRI networks. Ignoring the phase of the oscillations and their inappropriately limited spatial sampling are among the possible explanations and call for more sophisticated analysis strategies in future studies [Laufs et al., 2007b].
ENDOGENOUS BRAIN OSCILLATIONS IN PATIENTS WITH EPILEPSY
A special case of EEG/fMRI resting state studies is epilepsy. Originally, the aim had been to localize the source of epileptic activity via haemodynamic correlates of the spontaneously occurring, unpredictable EEG events. Studying patients at rest was sufficient to create an event‐related model for the interrogation of the fMRI data and additional paradigms at the time appeared dispensable [Gotman et al., 2006; Laufs and Duncan, 2007]. Still, epileptic activity contrasted against, but not the resting state per se, was the objective of the studies. As it turned out, however, generalized epileptic activity in the form of 3/s spike and wave complexes affects activity in the “default mode network” [Archer et al., 2003; Gotman et al., 2005; Hamandi et al., 2006; Laufs et al., 2006d; Salek‐Haddadi et al., 2003]. The behavioral correlate of the prototype of such generalized discharges are absence seizures, reflected by impaired consciousness. Other conditions of impaired consciousness had already been described to be associated with a decrease in activity in default mode brain regions [Laureys et al., 2004], to which absence seizures could then be added [Gotman et al., 2005; Laufs et al., 2006d]. More surprisingly, even frequent focal interictal epileptic discharges occurring in patients with (temporal lobe) epilepsy were associated with a relative signal decrease in the “default mode network” despite an absence of obvious behavioral changes [Kobayashi et al., 2006; Laufs et al., 2006a]. If decreased activity in this network during focal epileptic activity represents another instance of impaired consciousness this may explain cognitive deficits observed in epilepsy patients with frequent interictal discharges [Laufs et al., 2006a].
Changes in ongoing EEG activity, such as focal theta or delta slowing, i.e., abnormal oscillations at rest, may indicate brain pathology and can be used for localization of the epileptogenic area in EEG/fMRI analyses [Laufs et al., 2006b; Siniatchkin et al., 2007]. Studies are pending concerned with the differences in resting state oscillations between healthy volunteers versus individuals with epilepsy and on the interaction between epileptic discharges and ongoing EEG activity (endogenous neural oscillations). Another area of research relates to appropriate forward modelling of the haemodynamic response associated with (inter‐)ictal epileptic acitivity [Lemieux et al., 2007a; Lu et al., 2007; Moeller et al., 2008]. More generally, methods are being developed to better integrating multimodal electrophysiological and haemodynamic measurements [Babajani and Soltanian‐Zadeh, 2006; Daunizeau and Friston, 2007; Daunizeau et al., 2007; Laufs et al., 2008; Riera et al., 2006; Sotero and Trujillo‐Barreto, 2008]. Potentially, at the methodological level, a respective analytical approach to multimodal data may contribute to a reconciliation of some of the seeming discrepancies discussed earlier.
CONCLUSION
Neural and haemodynamic oscillations recorded at rest via surface EEG and BOLD fMRI are often only indirectly linked: very similar electrical oscillations in the brain can be associated with different fMRI‐generated spatial maps while haemodynamic oscillations of a distinct single network may correspond to diverse EEG patterns. One reason for this observation lies in the fact that the BOLD and surface EEG signals are generated differently and exhibit different temporo‐spatial properties. Given a constant experimental approach, their overlap is further influenced by the brain state, or context, in which they are acquired. This has implications for prior assumptions when integrating the two signal types, e.g., data fusion models, and eventually the interpretation of any EEG/fMRI based finding.
The terms “rest” and “state” semantically imply inertness while in fact dynamic endogenous neural oscillations can be visualized within different resting states. Nevertheless, the terminology is appropriate as it appears that distinct neural network configurations, or modes, exist with certain properties that can be revealed using EEG‐combined fMRI. Characterizing these configurations and their transitions in healthy and pathologic conditions promises to further our understanding of basic neurophysiology and disease.
Acknowledgements
Thanks to Kolja Jahnke for scientific input and helpful comments on the manuscript and to Andreas Kleinschmidt for scientific guidance throughout the referenced work.
REFERENCES
- Archer JS,Abbott DF,Waites AB,Jackson GD ( 2003): fMRI “deactivation” of the posterior cingulate during generalized spike and wave. Neuroimage 20: 1915–1922. [DOI] [PubMed] [Google Scholar]
- Babajani A,Soltanian‐Zadeh H ( 2006): Integrated MEG/EEG and fMRI model based on neural masses. IEEE Trans Biomed Eng 53: 1794–1801. [DOI] [PubMed] [Google Scholar]
- Berger H ( 1929): Über das Elektrenkephalogramm des Menschen. Archiv für Psychiatrie und Nervenkrankheiten 87: 527–570. [Google Scholar]
- Birn RM ( 2007): The behavioral significance of spontaneous fluctuations in brain activity. Neuron 56: 8–9. [DOI] [PubMed] [Google Scholar]
- Birn RM,Diamond JB,Smith MA,Bandettini PA ( 2006): Separating respiratory‐variation‐related fluctuations from neuronal‐activity‐related fluctuations in fMRI. Neuroimage 31: 1536–1548. [DOI] [PubMed] [Google Scholar]
- Birn RM,Smith MA,Jones TB,Bandettini PA ( 2008): The respiration response function: The temporal dynamics of fMRI signal fluctuations related to changes in respiration. Neuroimage 40: 644–654. [DOI] [PMC free article] [PubMed] [Google Scholar]
- Carmichael DW,Pinto S,Limousin‐Dowsey P,Thobois S,Allen PJ,Lemieux L,Yousry T,Thornton JS ( 2007): Functional MRI with active, fully implanted, deep brain stimulation systems: Safety and experimental confounds. Neuroimage 37: 508–517. [DOI] [PubMed] [Google Scholar]
- Daunizeau J,Friston KJ ( 2007): A mesostate‐space model for EEG and MEG. Neuroimage 38: 67–81. [DOI] [PubMed] [Google Scholar]
- Daunizeau J,Grova C,Marrelec G,Mattout J,Jbabdi S,Pelegrini‐Issac M,Lina JM,Benali H ( 2007): Symmetrical event‐related EEG/fMRI information fusion in a variational Bayesian framework. Neuroimage 36: 69–87. [DOI] [PubMed] [Google Scholar]
- de Munck JC,Goncalves SI,Huijboom L,Kuijer JP,Pouwels PJ,Heethaar RM,Lopes da Silva FH ( 2007): The hemodynamic response of the alpha rhythm: An EEG/fMRI study. Neuroimage 35: 1142–1151. [DOI] [PubMed] [Google Scholar]
- Feige B,Scheffler K,Esposito F,Di Salle F,Hennig J,Seifritz E ( 2005): Cortical and subcortical correlates of electroencephalographic alpha rhythm modulation. J Neurophysiol 93: 2864–2872. [DOI] [PubMed] [Google Scholar]
- Fox MD,Raichle ME ( 2007): Spontaneous fluctuations in brain activity observed with functional magnetic resonance imaging. Nat Rev Neurosci 8: 700–711. [DOI] [PubMed] [Google Scholar]
- Friston KJ,Williams S,Howard R,Frackowiak RS,Turner R ( 1996): Movement‐related effects in fMRI time‐series. Magn Reson Med 35: 346–355. [DOI] [PubMed] [Google Scholar]
- Gibbs FA,Davis H,Lennox WG ( 1935): The electro‐encephalogram in epilepsy and in conditions of impaired consciousness. Arch Neurol Psych 34: 1133. [Google Scholar]
- Giraud AL,Kleinschmidt AK,Poeppel D,Lund TE,Frackowiak RS,Laufs H ( 2007): Endogenous cortical rhythms determine cerebral specialization for speech perception and production. Neuron 56: 1127–1134. [DOI] [PubMed] [Google Scholar]
- Goldman RI,Stern JM,Engel J Jr,Cohen MS ( 2001): Tomographic mapping of alpha rhythm using simultaneous EEG/fMRI. NeuroImage. p S1291. [Google Scholar]
- Goldman RI,Stern JM,Engel J Jr,Cohen MS ( 2002): Simultaneous EEG and fMRI of the alpha rhythm. Neuroreport 13: 2487–2492. [DOI] [PMC free article] [PubMed] [Google Scholar]
- Goncalves SI,de Munck JC,Pouwels PJ,Schoonhoven R,Kuijer JP,Maurits NM,Hoogduin JM,Van Someren EJ,Heethaar RM,Lopes da Silva FH ( 2006): Correlating the alpha rhythm to BOLD using simultaneous EEG/fMRI: Inter‐subject variability. Neuroimage 30: 203–213. [DOI] [PubMed] [Google Scholar]
- Gotman J,Grova C,Bagshaw A,Kobayashi E,Aghakhani Y,Dubeau F ( 2005): Generalized epileptic discharges show thalamocortical activation and suspension of the default state of the brain. Proc Natl Acad Sci USA 102: 15236–15240. [DOI] [PMC free article] [PubMed] [Google Scholar]
- Gotman J,Kobayashi E,Bagshaw AP,Benar CG,Dubeau F ( 2006): Combining EEG and fMRI: A multimodal tool for epilepsy research. J Magn Reson Imaging 23: 906–920. [DOI] [PubMed] [Google Scholar]
- Gusnard DA,Raichle ME ( 2001): Searching for a baseline: functional imaging and the resting human brain. Nat Rev Neurosci 2: 685–694. [DOI] [PubMed] [Google Scholar]
- Hamandi K,Salek‐Haddadi A,Laufs H,Liston A,Friston K,Fish DR,Duncan JS,Lemieux L ( 2006): EEG‐fMRI of idiopathic and secondarily generalized epilepsies. Neuroimage 31: 1700–1710. [DOI] [PubMed] [Google Scholar]
- Hawco CS,Bagshaw AP,Lu Y,Dubeau F,Gotman J ( 2007): BOLD changes occur prior to epileptic spikes seen on scalp EEG. NeuroImage 35: 1450–1458. [DOI] [PubMed] [Google Scholar]
- Horovitz SG,Fukunaga M,de Zwart JA,van Gelderen P,Fulton SC,Balkin TJ,Duyn JH ( 2007): Low frequency BOLD fluctuations during resting wakefulness and light sleep: A simultaneous EEG‐fMRI study. Hum Brain Mapp [Epub ahead of print]: DOI: 10.1002/hbm.20428/. [DOI] [PMC free article] [PubMed] [Google Scholar]
- Ives JR,Warach S,Schmitt F,Edelman RR,Schomer DL ( 1993): Monitoring the patient's EEG during echo planar MRI. Electroencephalogr Clin Neurophysiol 87: 417–420. [DOI] [PubMed] [Google Scholar]
- Kaufmann C,Wehrle R,Wetter TC,Holsboer F,Auer DP,Pollmacher T,Czisch M ( 2006): Brain activation and hypothalamic functional connectivity during human non‐rapid eye movement sleep: An EEG/fMRI study. Brain 129 (Part 3): 655–667. [DOI] [PubMed] [Google Scholar]
- Kjaer TW,Law I,Wiltschiotz G,Paulson OB,Madsen PL ( 2002): Regional cerebral blood flow during light sleep–a H(2)(15)O‐PET study. J Sleep Res 11: 201–207. [DOI] [PubMed] [Google Scholar]
- Kobayashi E,Bagshaw AP,Grova C,Dubeau F,Gotman J ( 2006): Negative BOLD responses to epileptic spikes. Hum Brain Mapp 27: 488–497. [DOI] [PMC free article] [PubMed] [Google Scholar]
- Lachaux JP,Fonlupt P,Kahane P,Minotti L,Hoffmann D,Bertrand O,Baciu M ( 2007): Relationship between task‐related γ oscillations and BOLD signal: New insights from combined fMRI and intracranial EEG. Hum Brain Mapp. [DOI] [PMC free article] [PubMed] [Google Scholar]
- Laufs H,Duncan JS ( 2007): Electroencephalography/functional MRI in human epilepsy: What it currently can and cannot do. Curr Opin Neurol 20: 417–423. [DOI] [PubMed] [Google Scholar]
- Laufs H,Kleinschmidt A,Beyerle A,Eger E,Salek‐Haddadi A,Preibisch C,Krakow K ( 2003a): EEG‐correlated fMRI of human α activity. Neuroimage 19: 1463–1476. [DOI] [PubMed] [Google Scholar]
- Laufs H,Krakow K,Sterzer P,Eger E,Beyerle A,Salek‐Haddadi A,Kleinschmidt A ( 2003b): Electroencephalographic signatures of attentional and cognitive default modes in spontaneous brain activity fluctuations at rest. Proc Natl Acad Sci USA 100: 11053–11058. [DOI] [PMC free article] [PubMed] [Google Scholar]
- Laufs H,Hamandi K,Salek‐Haddadi A,Kleinschmidt AK,Duncan JS,Lemieux L ( 2006a): Temporal lobe interictal epileptic discharges affect cerebral activity in “default mode” brain regions. Hum Brain Mapp 28: 1923–1932. [DOI] [PMC free article] [PubMed] [Google Scholar]
- Laufs H,Hamandi K,Walker MC,Scott C,Smith S,Duncan JS,Lemieux L ( 2006b): EEG‐fMRI mapping of asymmetrical delta activity in a patient with refractory epilepsy is concordant with the epileptogenic region determined by intracranial EEG. Magn Reson Imaging 24: 367–371. [DOI] [PubMed] [Google Scholar]
- Laufs H,Holt JL,Elfont R,Krams M,Paul JS,Krakow K,Kleinschmidt A ( 2006c): Where the BOLD signal goes when α EEG leaves. Neuroimage 31: 1408–1418. [DOI] [PubMed] [Google Scholar]
- Laufs H,Lengler U,Hamandi K,Kleinschmidt A,Krakow K ( 2006d): Linking generalized spike‐and‐wave discharges and resting state brain activity by using EEG/fMRI in a patient with absence seizures. Epilepsia 47: 444–448. [DOI] [PubMed] [Google Scholar]
- Laufs H,Daunizeau J,Carmichael D,Kleinschmidt AK ( 2007a): Recent advances in recording electrophysiological data simultaneously with magnetic resonance imaging. Neuroimage (in press). [DOI] [PubMed] [Google Scholar]
- Laufs H,Walker MC,Lund TE ( 2007): “Brain activation and hypothalamic functional connectivity during human non‐rapid eye movement sleep: An EEG/fMRI study”—Its limitations and an alternative approach. Brain 130 (Part 7): e75. [DOI] [PubMed] [Google Scholar]
- Laufs H,Daunizeau J,Carmichael D,Kleinschmidt AK ( 2008): Recent advances in recording electrophysiological data simultaneously with magnetic resonance imaging. Neuroimage DOI: 10.1016/j.neuroimage. 2007.11.039:in press. [DOI] [PubMed] [Google Scholar]
- Laureys S,Owen AM,Schiff ND ( 2004): Brain function in coma, vegetative state, and related disorders. Lancet Neurol 3: 537–546. [DOI] [PubMed] [Google Scholar]
- Lemieux L,Laufs H,Carmichael D,Paul JS,Walker MC,Duncan JS ( 2007a): Noncanonical spike‐related BOLD responses in focal epilepsy. Hum Brain Mapp doi: 10.1002/hbm.20389. [DOI] [PMC free article] [PubMed] [Google Scholar]
- Lemieux L,Salek‐Haddadi A,Lund TE,Laufs H,Carmichael D ( 2007b): Modelling large motion events in fMRI studies of patients with epilepsy. Magn Reson Imaging 25: 894–901. [DOI] [PubMed] [Google Scholar]
- Logothetis NK,Pauls J,Augath M,Trinath T,Oeltermann A ( 2001): Neurophysiological investigation of the basis of the fMRI signal. Nature 412: 150–157. [DOI] [PubMed] [Google Scholar]
- Lu Y,Grova C,Kobayashi E,Dubeau F,Gotman J ( 2007): Using voxel‐specific hemodynamic response function in EEG‐fMRI data analysis: An estimation and detection model. Neuroimage 34: 195–203. [DOI] [PubMed] [Google Scholar]
- Lund TE,Norgaard MD,Rostrup E,Rowe JB,Paulson OB ( 2005): Motion or activity: Their role in intra‐ and inter‐subject variation in fMRI. Neuroimage 26: 960–964. [DOI] [PubMed] [Google Scholar]
- Lund TE,Madsen KH,Sidaros K,Luo WL,Nichols TE ( 2006): Non‐white noise in fMRI: Does modelling have an impact? Neuroimage 29: 54–66. [DOI] [PubMed] [Google Scholar]
- Mantini D,Perrucci MG,Del Gratta C,Romani GL,Corbetta M ( 2007): Electrophysiological signatures of resting state networks in the human brain. Proc Natl Acad Sci USA 104: 13170–13175. [DOI] [PMC free article] [PubMed] [Google Scholar]
- Maquet P ( 2000): Functional neuroimaging of normal human sleep by positron emission tomography. J Sleep Res 9: 207–231. [DOI] [PubMed] [Google Scholar]
- Martinez‐Montes E,Valdes‐Sosa PA,Miwakeichi F,Goldman RI,Cohen MS ( 2004): Concurrent EEG/fMRI analysis by multiway partial least squares. Neuroimage 22: 1023–1034. [DOI] [PubMed] [Google Scholar]
- Mazoyer B,Zago L,Mellet E,Bricogne S,Etard O,Houde O,Crivello F,Joliot M,Petit L,Tzourio‐Mazoyer N ( 2001): Cortical networks for working memory and executive functions sustain the conscious resting state in man. Brain Res Bull 54: 287–298. [DOI] [PubMed] [Google Scholar]
- Moeller F,Siebner HR,Wolff S,Muhle H,Boor R,Granert O,Jansen O,Stephani U,Siniatchkin M ( 2008): Changes in activity of striato‐thalamo‐cortical network precede generalized spike wave discharges. Neuroimage 39: 1839–1849. [DOI] [PubMed] [Google Scholar]
- Moosmann M,Ritter P,Krastel I,Brink A,Thees S,Blankenburg F,Taskin B,Obrig H,Villringer A ( 2003): Correlates of α rhythm in functional magnetic resonance imaging and near infrared spectroscopy. Neuroimage 20: 145–158. [DOI] [PubMed] [Google Scholar]
- Niessing J,Ebisch B,Schmidt KE,Niessing M,Singer W,Galuske RA ( 2005): Hemodynamic signals correlate tightly with synchronized γ oscillations. Science 309: 948–951. [DOI] [PubMed] [Google Scholar]
- Nunez PL,Silberstein RB ( 2000): On the relationship of synaptic activity to macroscopic measurements: Does co‐registration of EEG with fMRI make sense? Brain Topogr 13: 79–96. [DOI] [PubMed] [Google Scholar]
- Nunez PL,Wingeier BM,Silberstein RB ( 2001): Spatial‐temporal structures of human alpha rhythms: Theory, microcurrent sources, multiscale measurements, and global binding of local networks. Hum Brain Mapp 13: 125–164. [DOI] [PMC free article] [PubMed] [Google Scholar]
- Raichle ME,MacLeod AM,Snyder AZ,Powers WJ,Gusnard DA,Shulman GL ( 2001): A default mode of brain function. Proc Natl Acad Sci USA 98: 676–682. [DOI] [PMC free article] [PubMed] [Google Scholar]
- Raichle ME,Snyder AZ ( 2007): A default mode of brain function: A brief history of an evolving idea. Neuroimage 37: 1083–1090. [DOI] [PubMed] [Google Scholar]
- Rechtschaffen A,Kales AA ( 1968): A Manual of Standardized Terminology, Techniques and Scoring System for Sleep Stages of Human Subjects. Washington, D.C.: Government Printing Office; pp 1463–1476. [Google Scholar]
- Riera JJ,Wan X,Jimenez JC,Kawashima R ( 2006): Nonlinear local electrovascular coupling. I. A theoretical model. Hum Brain Mapp 27: 896–914. [DOI] [PMC free article] [PubMed] [Google Scholar]
- Ritter P,Villringer A ( 2006): Simultaneous EEG‐fMRI. Neurosci Biobehav Rev 30: 823–838. [DOI] [PubMed] [Google Scholar]
- Salek‐Haddadi A,Lemieux L,Merschhemke M,Friston KJ,Duncan JS,Fish DR ( 2003): Functional magnetic resonance imaging of human absence seizures. Ann Neurol 53: 663–667. [DOI] [PubMed] [Google Scholar]
- Schabus M,Dang‐Vu TT,Albouy G,Balteau E,Boly M,Carrier J,Darsaud A,Degueldre C,Desseilles M,Gais S,Phillips C,Rauchs G,Schnakers C,Sterpenich V,Vandewalle G,Luxen A,Maquet P ( 2007): Hemodynamic cerebral correlates of sleep spindles during human non‐rapid eye movement sleep. Proc Natl Acad Sci USA 104: 13164–13169. [DOI] [PMC free article] [PubMed] [Google Scholar]
- Scheeringa R,Bastiaansen MC,Petersson KM,Oostenveld R,Norris DG,Hagoort P ( 2008): Frontal theta EEG activity correlates negatively with the default mode network in resting state. Int J Psychophysiol 67: 242–251. [DOI] [PubMed] [Google Scholar]
- Shmuel A,Augath M,Oeltermann A,Logothetis NK ( 2006): Negative functional MRI response correlates with decreases in neuronal activity in monkey visual area V1. Nat Neurosci 9: 569–577. [DOI] [PubMed] [Google Scholar]
- Siniatchkin M,van Baalen A,Jacobs J,Moeller F,Moehring J,Boor R,Wolff S,Jansen O,Stephani U ( 2007): Different neuronal networks are associated with spikes and slow activity in hypsarrhythmia. Epilepsia. [DOI] [PubMed] [Google Scholar]
- Sotero RC,Trujillo‐Barreto NJ ( 2008): Biophysical model for integrating neuronal activity, EEG, fMRI and metabolism. Neuroimage 39: 290–309. [DOI] [PubMed] [Google Scholar]