

Abstract
Motor fatigue is an exercise‐induced reduction in the force‐generating capacity. The underlying mechanisms can be separated into factors residing in the periphery or in the central nervous system. We designed an experiment in which we investigated central processes underlying motor fatigue by means of magnetic resonance imaging in combination with the twitch interpolation technique. Subjects performed a sustained maximal abduction (2 min) with the right index finger. Brain activation was recorded with an MR scanner, together with index finger abduction force, EMG of several hand muscles and interpolated twitches. Mean activity per volume was calculated for the primary motor cortex and the secondary motor areas (supplementary motor, premotor, and cingulate areas) as well as mean force and mean rectified EMG amplitude. Results showed a progressive decline in maximal index finger abduction force and EMG of the target muscles combined with an increase in brain activity in the contralateral primary motor cortex and secondary motor areas. Analysis of the twitches superimposed on the sustained contraction revealed that during the contraction the voluntary drive decreased significantly. In conclusion, our data showed that despite an increase in brain activity the voluntary activation decreased. This suggests that, although the CNS increased its input to the relevant motor areas, this increase was insufficient to overcome fatigue‐related changes in the voluntary drive. Hum Brain Mapp, 2009. © 2008 Wiley‐Liss, Inc.
Keywords: fatigue, twitch interpolation, fMRI
INTRODUCTION
Motor fatigue can be defined as an exercise‐induced reduction in the force‐generating capacity of the neuro‐muscular system [Bigland‐Ritchie and Woods, 1984; Enoka and Stuart, 1992; Gandevia, 2001]. Although the decline in force is mainly due to changes in the muscle [e.g. Bigland‐Ritchie et al., 1981; Merton, 1954; see for reviews, Fitts, 1994; Kernell, 2006] changes in the central nervous system (CNS) are also important [see for review Gandevia, 2001]. The strength of the voluntary drive from the CNS to the muscle can be studied with the ‘twitch interpolation’ technique [Allen et al., 1995; Merton, 1954]. With this technique a supramaximal electrical stimulus is delivered to the muscle or nerve during a maximal voluntary contraction (MVC). When the stimulation evokes an increment in force, the neural drive was insufficient to generate a ‘real’ maximal contraction. It has been demonstrated that even well‐motivated subjects are not always capable of fully activating a muscle during brief maximal contractions, although the efficiency of the voluntary drive also depends on the muscle under investigation [Allen et al., 1995; Belanger and McComas, 1981; Thomas et al., 1989]. Several studies have shown that during a sustained contraction the ability to maximally activate a muscle declines progressively with time [Gandevia et al., 1996; Schillings et al., 2003; Sogaard et al., 2006; Todd et al., 2003; Zijdewind et al., 1998]. Such a decline in maximal activation during fatigue can be ascribed to processes in the central nervous system and is therefore named ‘central fatigue’.
Neuroimaging techniques (for example, fMRI) can be used to investigate (sub)cortical activation during fatigue. Several studies have investigated changes in brain activation during fatigue induced by a sustained or intermittent submaximal contraction [Benwell et al., 2007; Dettmers et al., 1996; Liu et al., 2003; Van Duinen et al., 2007b]. The results of these studies were contradictory; one study showed no change in cortical activity [Dettmers et al., 1996] while the other three experiments showed an increase in activity of most motor areas [primary motor cortex, premotor areas: Benwell et al., 2007; Liu et al., 2003; Van Duinen et al., 2007b]. Unfortunately, it is uncertain whether these changes were accompanied by central fatigue.
Only one study has investigated cortical activity during a sustained maximal contraction. Liu et al. [ 2002] used fMRI in combination with EMG and force measurements to study the time course of cortical activity during a sustained pinch grip. They demonstrated that during a sustained maximal contraction the number of activated voxels in the sensorimotor cortex (SMC) increased in the first minute of the contraction and decreased in the second minute. This decrease in the size of the activation cluster in the SMC could be a sign of central fatigue but central fatigue was not measured. Therefore, we designed a study that investigates central aspects of fatigue during a sustained maximal contraction by combining the classical twitch interpolation technique with functional MRI. We are not aware of other MRI‐studies that have used twitch interpolation during scanning. Some of the data have been published in abstract form [Post et al., 2006].
METHODS
Subjects
We studied twelve healthy subjects, four male and eight females (mean age 39 ± 9 years]. All subjects were right‐handed as confirmed by the Edinburgh Handedness Inventory [Laterality Quotient: 88.90 ± 17.89, Oldfield, 1971]. Subjects were free of neurological disorders and gave their written informed consent prior to participation in this study. The local ethical committee of the University Medical Center Groningen approved all research procedures. To familiarize subjects with the protocol and MR scanning all subjects participated in a training session in a replica of an MR scanner 1 week before the actual experiment.
Force Recording
Custom‐made MR compatible force transducers [see Van Duinen et al., 2007a] were used to measure the abduction force of the right and left index finger. The index finger was placed parallel to the bar on the force transducer. The proximal interphalangeal joint of the index finger was taped to a wedge that was connected to the force transducer. We further taped the ring and middle finger to the thumb to prevent changes in the hand position in relation to the force transducer (for a schematic overview of the hand position see Fig. 1A). Each force transducer (left and right hand) was connected to a shielded custom‐made amplifier (12 V; 1.9 A). The amplified signal (1000×) was sent via an optical cable to a receiver in the operator room. The receiver was connected to a data‐acquisition interface and a laptop equipped with accompanying software (1401 micro and Spike 2 version 5.19, Cambridge Electronic Design, Cambridge, UK). The force recordings were sampled at 500 Hz.
Figure 1.
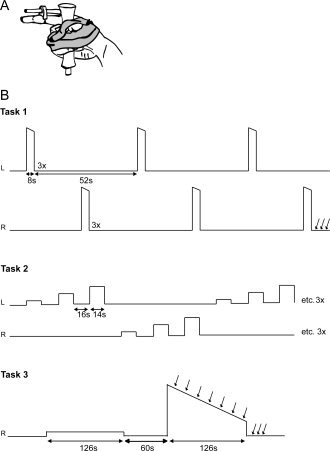
Schematic illustration of the hand position and fixation of the thumb and fingers in relation to the force transducer (A) and a schematic representation of the task procedures (B). Subjects started with task 1, three brief maximal abductions (MVC) with each index finger. Task 2 was a localizer task that consisted of submaximal isometric contractions at 10, 30, and 50% MVC with each index finger separately; repeated three times. In task 3 subjects first performed a sustained contraction at 10% MVC (low‐force contraction) followed by a sustained maximal contraction (high‐force contraction) with the right index finger. After the last right MVC in task 1 and during and immediately after the high force contraction in task 3, electrical (double pulse) stimuli were delivered to the ulnar nerve; indicated by the vertical arrows.
EMG Recording
Surface electromyography (EMG) of the first dorsal interosseous (FDI), the abductor digiti minimi (ADM), the thenar muscles and the flexor carpi radialis (FCR) of both hands was recorded using the BrainAmp MR plus system (Brain Products GmbH, Munich, Germany). A detailed description of the EMG setup is given in van Duinen et al. [ 2005]. In short, the skin lying over the muscles was scrubbed and cleaned with alcohol. MR‐compatible electrodes were placed in a muscle belly‐tendon arrangement for the hand muscles. For the FCR muscle, two electrodes were placed on the belly of the muscle 2 cm apart. A reference and ground electrode was positioned on the right processus styloideus radii. All electrodes were attached to an electrode input box connected to an analog to digital converter (BrainAmp MR plus, Brain Products GmbH, Munich, Germany). An optical cable transferred the signal to a computer outside the MR room. The computer was equipped with Brain Vision Recorder (sampling rate: 5000 Hz/channel). The MRI scanner sent a trigger to the computer at the onset of every scan. Brain Vision Analyser (version 1.05.0001) was used to preprocess the data. During preprocessing, the raw signal was corrected for the artefact of the MRI scans. First, the two monopolar EMG signals were subtracted (bipolar signal) from each other. Next, the signal was filtered with a high pass filter of 10 Hz. Subsequently, a template of the mean MRI artefact was determined and subtracted from the overall signal to give a relatively artefact free EMG. Previously, we showed that this MR‐artefact corrected EMG was highly comparable to MR‐undisturbed EMG [see Van Duinen et al., 2005]. After preprocessing the data was imported into Spike 2 for Windows (version 5.19; Cambridge Electronic Design, Cambridge, UK). In three subjects the EMG recordings showed artefacts due to small movements of the cables in the magnetic MR‐field. In these subjects the EMG recordings was also filtered with a high pass filter of 50 Hz after importing the data in Spike 2.
Stimulation
A constant current stimulator (DS7 Digitimer, Welwyn Garden City, UK) placed outside the MR room was used to deliver pairs of supramaximal electrical stimuli to the ulnar nerve at the wrist (150% of maximal response; 500 μs duration, 25–65 mA, interstimulus interval of 10 ms). To prevent radio frequency waves leaving or entering the scanner room, the stimulation leads entered the scanner room through an RF waveguide. This RF waveguide affected the high frequency component of the stimulus by decreasing the rise time of the stimulus. By using relatively long stimulus durations (500 μs) the stimulus still reached a plateau for about 200 μs. The stimulation pulses were given via MR compatible sintered silver/silver‐chloride surface electrodes (Falk Minow Services) placed on the skin over the right ulnar nerve. To prevent possible warming of the electrodes current‐limiting resistors (2 kΩ) were attached to the stimulation electrodes [Lemieux et al., 1997]. To be certain that the stimulation was supramaximal the stimulator intensity was set with the RF waveguide and the resistors in place.
Brain Imaging
Functional MRI was conducted using a 3T MR scanner (Philips Medical Systems, Best, Netherlands) equipped with echo planar imaging (EPI) capability and a SENSE head coil. Pulse sequence parameters were: single shot EPI; 39 slices; slice thickness 3.5 mm; no gap; field of view 224 mm; matrix scan size 64 by 64; transverse slice orientation; repetition time (TR) = 2000 ms; echo time (TE) = 30 ms; minimal temporal slice timing (1955 ms); flip angle 82°. After the fMRI protocol a T1‐weighted anatomical image of the entire brain was obtained for each subject using the following pulse sequence parameters: field of view 256 mm; matrix scan size 256 by 256; 160 slices; slice thickness 1 mm; transverse slice orientation; TE = 4.6 ms; TR = 25 ms; flip angle 30°.
Tasks
Before entering the MR scanner, subjects performed brief maximal contractions (ca. 3 s) that involved the ADM, thenar, and FCR muscle i.e. little finger abduction, thumb opposition, and wrist flexion. The contractions were performed against resistance given by the one of the authors. To determine maximal EMG values the EMG was rectified (rEMG) and mean values were calculated over 2‐s epochs for each contraction. The maximal value was regarded as the control EMG value. The maximal EMG (2‐s epoch) of the FDI was determined during task 1.
Throughout the experiment, subjects lay in a supine position in the MR scanner with both arms extended and parallel to the body. Subjects got visual feedback of the target force and their produced force via a beamer on a screen that was visible to the subjects via a mirror. A schematic overview of the tasks is given in Figure 1B.
Task 1
Subjects were asked to make three brief (8 s) maximal voluntary isometric contractions (MVCs) with their left or right index finger in alternation, with each contraction followed by 22 s rest (contractions with the same finger were separated by 52 s). The contraction with the highest peak force was regarded as ‘real’ MVC and used to determine the submaximal force levels in ‘Task 2’. To obtain pre‐fatigue rest values for the twitches, three (double pulse) stimuli were given immediately after the last maximal contraction with the right index finger.
Task 2
To localize brain areas in which the activity was related to index finger abduction subjects performed submaximal isometric contractions at 10, 30, and 50% MVC. The task was performed for the right and left index finger separately. The set of submaximal contractions was repeated three times. The contractions lasted for 14 s followed by a 16‐s rest period. The order of the contractions was semirandomized. The data obtained in this task was used to define the regions of interest (see fMRI data analysis).
Task 3
Subjects performed a sustained isometric contraction with the right index finger for 126 s at 10% MVC (low‐force contraction; non‐fatiguing). After a 60 s rest period, the subjects performed a sustained maximal contraction for 126 s (high‐force contraction; fatiguing). During the high‐force contraction, electrical stimuli (double pulse) were given every 18 s. Three stimuli were applied at rest after the contraction.
Force and EMG Data Analysis
Offline, the data were analyzed using Spike2 version 5 for Windows.
Force
We calculated the mean force for 2‐s epochs during theMVC task (task 1). The 2‐s epochs corresponded to the onset of scanning a brain volume. The highest mean force (2‐s epoch) was chosen as the control MVC (cMVC). The mean force (2‐s epoch) during the sustained low‐force and high‐force contractions (task 3) was expressed as a percentage of cMVC. Force variability was calculated by dividing the standard deviation of the force during each 2‐s epoch by the mean force for each 2‐s epoch.
EMG
The mean amplitude of the rectified EMG for the muscles during the MVC tasks (ADM, thenar and FCR: before scanning; FDI: task 1) was measured for the same periods as the force (2‐s epochs). The highest value per muscle was chosen as the control value. The mean rEMG amplitude, per 2‐s epoch, during the sustained low‐force and high‐force contractions (task 3) was expressed as a percentage of the control value. Furthermore, for the sustained high‐force contraction, we determined the mean EMG power frequency (MPF) of the FDI muscle by conducting a 1024 point Fast Fourier transformation with a Hanning window for each epoch (2‐s).
Stimulation
The increments in force produced by the superimposed twitch during the sustained maximal high‐force contraction were expressed as a fraction of the background force at the time of stimulation (‘pre‐stimulus force’). An increase in this fraction represented a decrease in central drive.
fMRI Data Analysis
We used SPM2 (http://www.fil.ion.ucl.ac.uk/spm) implemented in MATLAB (version 6.5, MathWorks, Natick, MA) to process and analyze the fMRI data. For each subject functional data were realigned to the first image, co‐registered with the anatomical image and normalized to a T1 template. Prior to analysis, functional data were smoothed with a full‐width‐at‐half‐maximum 8 mm Gaussian kernel.
A subject‐based model was made for the sustained contractions. To follow changes over time, we first divided the low‐force and high‐force contraction into three equal epochs, leaving us with six conditions per subject. Hereafter, we specified these conditions in a block‐design and convolved the model with the hemodynamic response function. After this, contrast images were created resulting in three contrast images for the sustained low‐force task (10%‐T1, 10%‐T2, 10%‐T3) and three contrast images for the sustained high‐force task (MVC‐T1, MVC‐T2, MVC‐T3). The six contrast images were used in a second level random effect analysis, using a within subjects ANOVA available in SPM2, including a correction for nonsphericity. In this ANOVA, we first compared the activity in the different epochs of the sustained high‐force contractions with the mean activation of the low‐force contraction (MVC‐T1 > mean10%, MVC‐T2 > mean10%, and MVC‐T3 > mean10%). For the activation maps, significance level was set to T ≥ 5.38 (P < 0.05 with correction for multiple comparisons) with a spatial extent of n = 20 voxels. Additionally, we wanted to illustrate brain areas that showed an increase or decrease over time (fatigue). Therefore, we compared brain activation in the third epoch of the sustained high‐force contraction with activation in the first epoch (MVC‐T1 > MVC‐T3 and MVC‐T3 > MVC‐T1). Before performing the analysis we masked the data with the activity during T3 or T1; thereby confining our analysis to areas that were active during the contraction. By using a mask the number of statistical comparisons declines therefore we set the significance level to a higher threshold T ≥ 3.26 but did not correct for multiple comparisons (equals P < 0.001) and used a spatial extent of n = 20 voxels.
In Tables I and II, we present data from significantly activated clusters. MRIcro (http://www.sph.sc.edu/comd/rorden/mricro.html), the Anatomy Toolbox [Eickhoff et al., 2005], and the study of Mayka et al. [ 2006] were used to determine which specific brain areas were active during the tasks.
Table I.
Activated brain areas, their stereotaxic coordinates, and T‐values for the three time‐periods (T1, T2, and T3; 1/3 of the total contraction time) of the sustained high force contraction (significance level corrected for multiple comparisons: T ≥ 5.38, k = 20 voxels)
| Anatomical region (functional region) | Side | BA (probability) | X | Y | Z | T | ||
|---|---|---|---|---|---|---|---|---|
| T1 | T2 | T3 | ||||||
| Central Regions | ||||||||
| Precentral Gyrus (M1) | L | 6:70% | −38 | −20 | 62 | 9.83 | 9.99 | 10.91 |
| Precentral Gyrus (M1) | L | 6:100% | −30 | −22 | 70 | 9.37 | ||
| Precentral Gyrus (SMC) | L | 6:20% | −22 | −24 | 72 | 7.29 | 7.84 | 9.27 |
| 4a:20% | ||||||||
| Precentral Gyrus (SMC/M1) | L | 4p:50% | −32 | −28 | 56 | 6 | ||
| 4a:30% | ||||||||
| Precentral Gyrus (SMC) | L | 6:40% | −24 | −26 | 60 | 5.98 | 6.43 | 6.62 |
| 4a:40% | ||||||||
| Precentral Gyrus pars Opercularis | L | OP1:40% | −60 | −22 | 14 | 6.22 | 6.94 | |
| Postcentral Gyrus (SMC) | L | 4p:50% | −36 | −28 | 48 | 6.39 | 7.43 | |
| 3a:40% | ||||||||
| Postcentral Gyrus (SMC) | L | 3b:60% | −36 | −32 | 58 | 7.35 | 9.11 | 9.5 |
| Postcentral Gyrus (SMC) | L | 1:40% | −26 | −30 | 72 | 7.27 | 7.79 | |
| 6:30% | ||||||||
| Postcentral Gyrus (S1) | L | 2:60% | −34 | −40 | 60 | 7.04 | ||
| 1:50% | ||||||||
| Postcentral gyrus (S1) | L | 1:70% | −50 | −24 | 50 | 6.73 | 7.23 | |
| 2:50% | ||||||||
| Postcentral gyrus (S1) | L | 1:90% | −50 | −18 | 52 | 6.41 | ||
| Postcentral gyrus | L | OP1:50% | −52 | −18 | 16 | 6.47 | 6.68 | |
| Medial Region | ||||||||
| SMA (proper) | L | 6:90% | −4 | −12 | 56 | 6.78 | ||
| Medial Cingulate Gyrus (CMA) | L | 4a:60% | −2 | −22 | 48 | 5.91 | ||
| SMA (proper) | R | 6:90% | 4 | −14 | 54 | 5.47 | ||
| Cerebellar Regions | ||||||||
| Cerebellum Lobule IV–V | R | 12 | −52 | −12 | 6.88 | |||
| Cerebellum Lobule VI | R | 20 | −54 | −22 | 7.73 | |||
| Cerebellum Lobule VI | R | 16 | −58 | −18 | 7.58 | 6.88 | 6.24 | |
| Cerebellum Lobule VI | R | 12 | −60 | −16 | 7.47 | 6.79 | ||
| Cerebellum Lobule VI | R | 30 | −58 | −26 | 6.64 | |||
| Cerebellum Lobule VI | R | 26 | −62 | −24 | 6.58 | |||
| Cerebellum Lobule VI | R | 30 | −68 | −26 | 6.24 | |||
| Cerebellum Lobule VI | R | 16 | −74 | −20 | 6.14 | 6.36 | 6.51 | |
| Cerebellum Lobule VIII | R | 12 | −70 | −44 | 5.85 | |||
| Cerebellum Lobule IX | R | 6 | −62 | −46 | 7.42 | 7.06 | 6.2 | |
| Vermis 4/5 | M | 6 | −58 | −12 | 8.01 | 7.03 | 5.99 | |
| Vermis 6 | M | 6 | −64 | −24 | 7.4 | |||
| Vermis 6 | M | 0 | −60 | −20 | 7.14 | |||
| Vermis 7 | M | 4 | −72 | −32 | 6.38 | |||
| Vermis 8 | M | 6 | −68 | −44 | 8.02 | 7.45 | 6.19 | |
| Vermis 8 | M | 4 | −72 | −34 | 7.55 | 6.82 | 6.38 | |
| Cerebellum Crus 1 | L | −16 | −72 | −28 | 7.74 | 6.95 | 7.32 | |
| Cerebellum Lobule IV–V | L | −4 | −56 | −12 | 6.95 | |||
| Cerebellum Lobule IV–V | L | −12 | −56 | −20 | 6.53 | |||
| Cerebellum Lobule VIII | L | −20 | −64 | −38 | 6.45 | |||
| Cerebellum Lobule VIII | L | −8 | −62 | −46 | 6.3 | 6.17 | ||
| Subcortical Nuclei | ||||||||
| Putamen | R | 28 | −6 | 6 | 6.68 | |||
| Thalamus | L | −16 | −30 | 12 | 6 | 6.35 | ||
| Thalamus | L | −14 | −30 | 6 | 5.63 | 6.01 | ||
| Thalamus | L | −12 | −26 | 8 | 5.62 | |||
M1, primary motor cortex; S1, primary sensory cortex; SMC, sensorimotor cortex; SMA, supplementary motor area; CMA, cingulate motor area.
Table II.
Activated brain areas, their stereotaxic coordinates, T‐values (P < 0.001, significance level not corrected for multiple comparisons: T ≥ 3.26, k = 20 voxels) for MVC‐T1 > MVC‐T3 and MVC‐T3 > MVC‐T1
| Anatomical region (functional region) | Side | BA (probability) | X | Y | Z | T |
|---|---|---|---|---|---|---|
| MVC‐T1 > MVC‐T3 (masked MVC‐T1) | ||||||
| No significant activated areas | ||||||
| MVC‐T31 > MVC‐T1 (masked MVC‐T3) | ||||||
| Central Regions | ||||||
| Precentral Gyrus (M1) | L | 4a:30% | −20 | −24 | 72 | 4.43 |
| Precentral Gyrus (M1) | L | 6:90% | −28 | −22 | 70 | 4.06 |
| Precentral Gyrus (M1) | L | 6, 4a:40% | −38 | −22 | 60 | 4.01 |
| Paracentral Lobule (SMC) | L | 4a:50% | −18 | −30 | 68 | 3.42 |
| 6:30% | ||||||
| Postcentral Gyrus (S1) | L | 3b:60% | −36 | −32 | 58 | 4.82 |
| 2:30% | ||||||
| Postcentral Gyrus (S1) | L | 2:50% | −28 | −42 | 58 | 3.59 |
| 1, 3b:30% | ||||||
| Postcentral Gyrus (S1) | L | 2: 70% | −32 | −40 | 56 | 3.56 |
| Postcentral Gyrus (SMC) | L | 4a:40% | −18 | −30 | 64 | 3.41 |
| 6, 3b:30% | ||||||
| Postcentral Gyrus | L | OP1:50% | −52 | −20 | 20 | 3.93 |
| Postcentral Gyrus | L | 3a:60% | −46 | −10 | 32 | 3.89 |
| 4p:50% | ||||||
| Postcentral Gyrus | L | OP1:50% | −50 | −8 | 22 | 3.85 |
| Medial Region | ||||||
| SMA (proper) | L | 6:80% | −2 | −16 | 56 | 4.16 |
| 4a:40% | ||||||
| Medial Cingulate Gyrus (CMA) | L | 6:40% | −4 | 0 | 44 | 3.71 |
| Medial Cingulate Gyrus (CMA) | R | 2 | 14 | 34 | 3.94 | |
| Parietal Regions | ||||||
| Parietal Operculum | L | OP1:50% | −58 | −22 | 14 | 4.6 |
| Temporal Regions | ||||||
| Heschls Gyrus | L | TE 1.1:20% | −40 | −20 | 8 | 3.86 |
M1, primary motor cortex; S1, primary sensory cortex; SMC, sensorimotor cortex; SMA, supplementary motor area; CMA, cingulate motor area.
Region of Interest Analysis
A region of interest (ROI) analysis was used to investigate the effects of fatigue on the activity in areas related to motor task performance. First, the localizer task was used to determine brain areas associated with index finger contractions for each individual. For this, a subject‐based model was designed in which we specified the timing of the three different force levels per index finger (10, 30, and 50% MVC). To correct for unwanted head movements, we included the head movement parameters as covariates and convolved the model with the hemodynamic response function. Activation maps were created for right and left index finger contractions by contrasting the activity during the contractions versus rest (R‐force > rest and L‐force > rest).
Second, the contrast images obtained in this analysis were used in a second level group analysis using one sample t‐tests. In this analysis, group activation maps were created that are related to right and left index finger movements.
Hereafter, ROIs were built using MarsBar implemented in SPM2 [Brett et al., 2002]. The significant activated areas from the group analysis for both the right index finger contraction and left index finger contraction were used to define functional ROIs, which were then masked with an anatomical region (Automated Anatomical Labeled; AAL [Tzourio‐Mazoyer et al., 2002]. Using this method, we defined functionally active regions within the precentral gyrus, postcentral gyrus, supplementary motor area (SMA), cingulate motor area (CMA), precentral gyrus pars opercularis, cerebellum (lobule 4, 5, and 6) and the insular cortex. For all areas, a ROI was built for the left and right hemisphere.
During task 3, we extracted the contrast of the blood oxygenated‐level dependent (BOLD) signal for each volume per ROI. For every subject, we calculated baseline activity (activity during rest) and expressed activation as a percent signal change ((activation‐baseline activity)/baseline activity × 100).
Statistical Analysis
In the text, group data are presented as mean ± standard deviation (SD). In the figures group data are presented as mean ± standard error (SEM).
SPSS 12.02 for windows was used for statistical analysis. A paired t‐test was used to test for differences between twitches at rest before and after the sustained MVC. The effect of time on the twitch during the sustained high‐force contraction was tested with a repeated measure ANOVA (7 time points). A one‐sample t‐test was used to test whether the start and end peak of the BOLD signal in the low‐force contraction differed from the average activation of the group during that contraction. Effects of time during the sustained contractions for force, EMG and fMRI ROI data points were analyzed for 61 volumes (total number of volumes during the sustained contractions) with a single‐factor repeated measures ANOVA. Because the BOLD response is delayed by about 6 s, we shifted the ROI data for three volumes compared to the force and EMG data. Planned contrasts were used to identify significant differences when appropriate. Furthermore, for the ROI data, differences between hemispheres were analyzed using a 2 (hemisphere) 61× (time) repeated measures ANOVA. For all tests, a level of P < 0.05 was used to identify statistical significance.
RESULTS
Subjects
In total, we included twelve subjects in our experiment. Data from one subject was excluded from the functional‐MRI analysis (n = 11) due to head movements that were largely correlated to the task. For the analysis of the superimposed twitches, data from nine out of twelve subjects were included. In three subjects it was uncertain whether the stimuli were supramaximal because the tape holding the stimulation electrodes came lose during the experiment due to excessive sweating (n = 2) or the stimulator was out of compliance even after repositioning of the electrodes (n = 1).
Force and EMG
During the brief maximal contractions, the right index force equaled 32.42 ± 9.37 N (task 1). In the low‐force sustained contraction (task 3), all subjects maintained their force close to 10% cMVC, whereas during the sustained high‐force contraction force declined to 38.05 ± 14.48% cMVC at the end of the contraction (F (60,660) = 50.526, P < 0.001; Fig. 2A). Force‐variability increased over time during the high‐force contraction (F (60,660) = 2.786, P < 0.001) while during the low‐force contraction force variability was stable over time.
Figure 2.
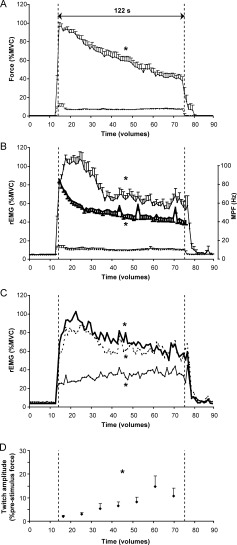
Time course (mean ± SEM) of the index finger abduction force (A), rectified‐EMG amplitude (B; left y‐axis) and EMG power frequency (B; thick line, right y‐axis) of the right FDI muscle per volume (2‐s) during the sustained high‐force contraction (uninterrupted line) and the low‐force contraction (dashed lower line). Panel (C) shows the time course (mean ± SEM) of the rectified‐EMG amplitude per volume of the right ADM muscle (thick uninterrupted line), the right thenar muscle (thick dashed line) and the right FCR muscle (thin uninterrupted line) per volume during the sustained high‐force contraction. Panel (D) shows the twitch force (% pre‐stimulus force) during the sustained high‐force contraction. Statistical analysis was performed on the data points between the vertical dashed lines (61 volumes, 122 s). * denotes significant effect of time (P < 0.05).
In accordance with the force, the rEMG amplitude of the right FDI muscle was also close to 10% MVC during the low‐force contraction. During the sustained high‐force contraction, the rEMG amplitude of the right FDI declined to 55.71 ± 22.29% MVC (F (60,660) = 14.282, P < 0.001; Fig. 2B). Although both the rEMG and the force declined over time, a difference in time course between rEMG amplitude and force was shown (interaction effect: F (60,660) = 4.286, P < 0.001). While the force decreased throughout the contraction, rEMG amplitude increased at the start of the contraction and then decreased.
In three subjects, we used a high‐pass filter (50 Hz) for the EMG recordings to correct for the movement artefacts caused by small movements of the EMG cables in the magnetic field. Because of the high‐pass filter, the EMG amplitude is probably underestimated. However, after expressing these data as a percentage of the (50 Hz high‐pass filtered) MVC values no significant differences were observed between the EMG‐values filtered with a high‐pass filter of 10 Hz versus 50 Hz. The high‐pass filter did affect the mean power frequency: MPF values were larger in EMG high‐pass filtered with 50 Hz than 10 Hz. Because of this, we decided to exclude the data from these three subjects from the MPF analysis. The mean power frequency of the EMG of the right FDI (n = 9) declined during the high‐force contraction (effect time: F (60,480) = 34.325, P < 0.001; Fig. 2B) from 85.64 ± 10.89 Hz at the start of the contraction to 40.67 ± 12.57 Hz at the end.
During the sustained high‐force contraction of the FDI, the right ADM, thenar and FCR muscles were co‐activated. Similar to the right FDI muscle, the rEMG amplitude of the intrinsic hand muscles (ADM and the thenar muscles) first increased and then declined to 57.62 ± 30.16% MVC and 54.51 ± 43.42% cMVC respectively (F (60,660) = 4.149, P < 0.001 and F (60,660) = 3.883, P < 0.001, respectively; Fig. 2C). The rEMG amplitude of the FCR muscle increased during the contraction (F (60,660) = 1.476, P < 0.02; Fig. 2C).
During both the brief MVCs (task 1) and the sustained high‐force contraction (task 3) the target FDI muscle was activated, but also muscles in the contralateral index finger. During the brief MVCs, contralateral forces were generated of 3.46 ± 1.42% MVC with the left and 3.76 ± 2.94% MVC with the right index finger. During the sustained high‐force contractions forces produced by the contralateral index finger slowly increased to 5.27 ± 5.07% MVC by the end of the contraction.
Twitch Interpolation
The initial twitches (double pulse) elicited at rest were 27.24 ± 5.21% cMVC. The rest twitch immediately after the sustained maximal contraction was significantly lower [44.01 ± 26.39% of the initial twitch; P < 0.001], indicating peripheral fatigue. However, the amplitude of the superimposed twitches increased during the fatigue task, from 1.97 ± 1.81% prestimulus force at the start of the contraction to 10.82 ± 9.57% prestimulus force at the end of the contraction (F (6,48) = 6.462, P = 0.001; Fig. 2D). A paired t‐test analysis revealed that the last four superimposed twitches (62, 80, 98, and 116 s after start high‐force contraction) were significantly higher than the first twitch (all P < 0.02) indicating a decline in the voluntary drive.
Brain Activity
Activation pattern during sustained contractions
To compare the brain activation during a low‐force and a fatiguing high‐force contraction we contrasted activation patterns during the high‐force contraction to the activation during the contraction at 10% MVC. To follow changes over time we divided the high‐force contraction in three epochs and contrasted the activity versus the mean activity during the low‐force contraction (see Methods). Figure 3 shows the activation pattern in the three epochs. Activation was observed in areas known to be involved in motor tasks: the SMC, premotor areas, parietal areas, cerebellar areas and several subcortical nuclei (Table I). In our MVC‐T3 > MVC‐T1 contrast analysis we looked at active areas in which the activity increased over time. The analysis revealed activation in the SMC (precentral and postcentral gyrus), in several premotor areas (supplementary motor area and cingulate motor area), in temporal areas and in the parietal operculum (Fig. 4B). The opposite contrast analysis (MVC‐T1 > MVC‐T3) showed no active areas in which a significant decrease in activation over time was seen. A detailed representation of the activated areas (and their stereotaxic coordinates) during the sustained high‐force contraction is listed in Tables I and II.
Figure 3.
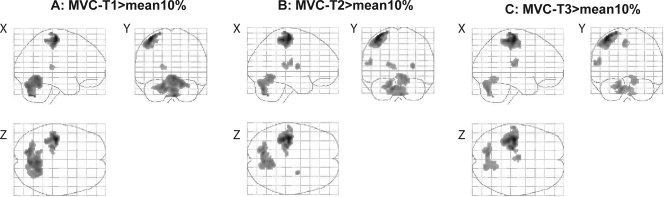
Activated brain areas during the sustained high‐force contraction compared to the mean activity during the sustained low‐force contraction. To follow the changes over time we divided the 2‐min contraction into three equal parts (MVC‐T1, MVC‐T2, and MVC‐T3). Panel (A) shows areas activated during the first part of the sustained MVC (MVC‐T1 > mean10%), (B) during the second part (MVC‐T2 > mean10%) and (C) during the last part of the contraction (MVC‐T3 > mean10%; all pictures corrected for multiple comparisons T ≥ 5.28, k = 20 voxels).
Figure 4.
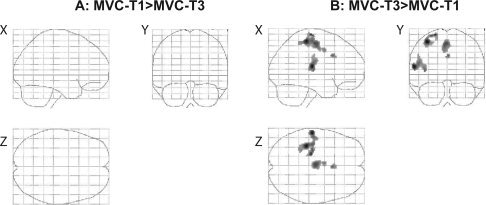
Differences in brain activation between the first and last part of the high‐force contraction. To test only areas that were significantly activated, we used a mask before the statistical analysis. Panel (A) shows brain areas stronger activated during the first part of the contraction (MVC‐T1) than during the last part (MVC‐T3). Data was masked with activity during T1. Panel (B) shows areas stronger activated during MVC‐T3 than during MVC‐T1, data was masked with activity during T3 (P < 0.001, uncorrected for multiple comparisons: T ≥ 3.26, k = 20 voxels).
ROI Analysis
Precentral and postcentral gyrus
At the start of the sustained low‐force contraction, a relatively large increase in the BOLD signal was seen in both the contralateral precentral and postcentral gyrus. Interestingly, this increase was also observed at the end of the contraction (Fig. 5B, D); during the contraction the activation level was significantly lower than the activation peaks at the start and the end of the contraction (P < 0.05). In both the contralateral precentral and postcentral gyrus a small increase in activation was seen over time (F (60,600) = 1.661, P < 0.005 and F (60,600) = 1.652, P < 0.005, respectively).
Figure 5.
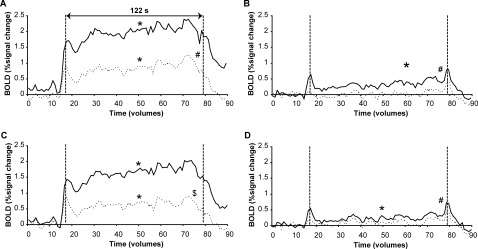
Mean BOLD signal per volume during the sustained high‐force contraction (fatiguing; A, C) and sustained low‐force contraction at 10% MVC (non‐fatiguing; B, D) in the contralateral (uninterrupted line) and ipsilateral (dashed line) precentral (A, B) and postcentral (C, D) gyrus. Statistical analysis was performed on the datapoints between the vertical dashed lines (61 volumes, 122 s). * denotes main effect of time, # denotes significant difference between hemispheres and $ denotes interaction effect between hemisphere and time (All: P < 0.05).
During the 2‐min high‐force contraction, the BOLD response in the contralateral precentral and postcentral gyrus increased at the start of the contraction, with a similar time course to that seen during the low‐force contraction. Furthermore a significant increase in the BOLD response was observed for both precentral and postcentral gyrus over time (precentral gyrus: F (60,600) = 3.992, postcentral gyrus: F (60,600) = 5.580, both P < 0.001; Fig. 5A, C). At the end of the contraction a small decline in the BOLD response was visible. Similar to an earlier study [Liu et al., 2002] increased activation was also seen in the ipsilateral hemisphere. This activity also showed an effect with time (precentral gyrus: F (60,600) = 2.351; postcentral gyrus: F (60,600) = 1.650, both P < 0.005; Fig. 5B, D). For the precentral gyrus the BOLD response was significantly larger in the contralateral hemisphere (F (1,10) = 39.754, P < 0.001) but the increase with time was similar for the contralateral and ipsilateral hemisphere (no interaction effect: F (60,600) = 0.641, P > 0.9). In the postcentral gyrus, the amplitude and the increase of the BOLD response in the contralateral hemisphere were larger (interaction effect: F (60,600) = 3.182, P < 0.001) than in the ipsilateral hemisphere.
Supplementary motor area/ cingulate motor area
For SMA and CMA, activity was found in both the contralateral and ipsilateral hemisphere (see Fig. 6). The ROI analysis revealed that the activation in contralateral SMA and CMA increased during the contraction (SMA: F (60,600) = 4.572; CMA: F (60,600) = 5.179, P < 0.001; Fig. 6). The response in the ipsilateral hemisphere showed a similar increase over time as the contralateral areas (SMA: F (60,600) = 3.454; CMA: F (60,600) = 2.589, P < 0.001), although activity was lower in the ipsilateral SMA (F (1,10) = 5.094, P < 0.05, Fig. 6).
Figure 6.
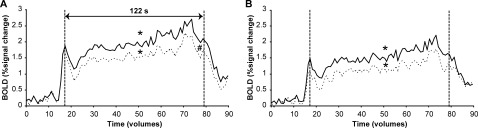
Mean BOLD signal per volume during the sustained high‐force contraction in the contralateral (uninterrupted line) and ipsilateral (dashed line) SMA (A) and CMA (B). Statistical analysis was performed on the datapoints between the vertical dashed lines (61 volumes, 122 s). * denotes main effect of time, # denotes significant difference between hemisphere (All: P < 0.05).
Cerebellum (lobule 4, 5, and 6)
The left and right cerebellum showed a similar amount of activity during the high‐force contraction. The response decreased slightly in both contralateral and ipsilateral hemisphere (ipsilateral: F (60,600) = 2.190; contralateral: F (60,600) = 1.651, both P ≤ 0.002). However, the time course of the activity differed slightly but significantly between the two hemispheres (interaction effect: F (60,600) = 1.613, P < 0.005, Fig. 7A); the BOLD response tended to decline faster in the ipsilateral hemisphere.
Figure 7.
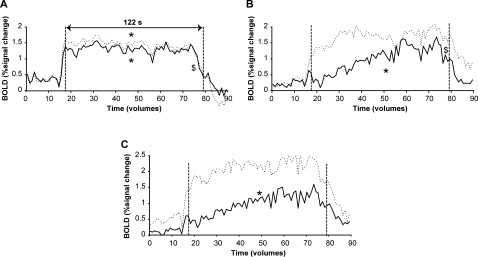
BOLD signal per volume during the sustained high‐force contraction in the contralateral (uninterrupted line) and ipsilateral (dashed line) cerebellum (lobule IV,V and VI; A), precentral gyrus pars opercularis (B) and the insular cortex (C). Statistical analysis was performed on the datapoints between the vertical dashed lines (61 volumes, 122 s). * denotes main effect of time, $ denotes interaction effect between hemisphere and time (All: P < 0.05).
Rolandic operculum and insular cortex
The time courses of activation in the contralateral and ipsilateral rolandic operculum were significantly different (interaction: F (60,600) = 1.569, P < 0.01). In the contralateral hemisphere, the BOLD signal showed an increase over time (F (60,600) = 2.626, P < 0.001) whereas in the ipsilateral hemisphere activity was stable throughout the contraction (no effect time: F (60,600) = 0.961, P > 0.9; Fig. 7B). The contralateral insula also showed a progressive increase in activity with time (effect time: F (60,600) = 2.835, P < 0.001), whereas the ipsilateral insula showed a stable activation pattern throughout the contraction (no time effect: F (60,600) = 1.252, P > 0.1). However, no interaction effects or effect for hemisphere were found (F (60,600) = 0.745, P > 0.9 and F (1,10) = 1.046, P > 0.3, respectively).
DISCUSSION
In this study, we combined neuroimaging techniques with the classical twitch interpolation technique to investigate central aspects of fatigue. During a sustained high‐force contraction, we showed that the hemodynamic response in the most important motor (output) areas increased (SMC, supplementary motor area, premotor areas), whereas the voluntary activation of the FDI muscle decreased with time. Hence, our results suggest that, although the CNS increased its input to the motor areas, these increases did not overcome fatigue‐related changes in the voluntary drive to the motor units.
EMG, Force, and Voluntary Activation
Despite a maximal effort, the abduction force generated with the index finger declined progressively during the high‐force contraction. This decrease in maximal force was comparable to other studies [Gandevia et al., 1996; Schillings et al., 2003]. The EMG of the hand muscles also showed a decline during the contraction but not immediately. At the start of the maximal contraction the rectified EMG increased. This increase was probably due to an increase in the amplitude of the muscle fiber action potentials. It was found that muscle compound action potentials (M‐waves) tend to potentiate at the start of a stimulation protocol [Cupido et al., 1996; Zijdewind et al., 1990; Zijdewind and Kernell, 1994] or during voluntary contractions [Hicks et al., 1989]. This potentiation is probably the result of hyperpolarization of the muscle fiber membrane caused by an in increase in activity of the Na+‐K+ pump [Hicks and McComas, 1989].
As expected from earlier studies [Gandevia et al., 1996; Merton, 1954; Schillings et al., 2003] the almost 60% decrease in rest twitch force after the sustained high‐force contraction indicates that a large part of the force reduction was due to fatigue‐related changes in the muscle. However, part of the force decline was due to central changes as is indicated by the progressive increase in the amplitude of the superimposed twitch [Gandevia et al., 1996; Schillings et al., 2003].
Brain Areas and ROI Analysis
Our contrast analysis revealed that during sustained contractions a large motor network is activated, including the SMC, supplementary motor area (SMA), cingulate motor area (CMA), premotor areas and cerebellum [See also Table I; Dettmers et al., 1995; Thickbroom et al., 1998; van Duinen et al., 2008]. The comparison between the activation during the last (T3) and first (T1) third of the sustained high‐force contraction showed increased activation in clusters in the precentral gyrus, SMA, CMA, and the parietal operculum. These areas are comparable with areas that showed increased activation during a submaximal fatiguing task in the FDI [Van Duinen et al., 2007b]. We analyzed the activity in these areas in more detail with a region of interest analysis (see ROI analysis ).
A ROI analysis was used to follow changes in activation during the sustained maximal contraction. The BOLD response in the SMC, supplementary motor area and the medial cingulate gyrus increased with time, while a decrease in activity was seen in the cerebellum. The only other study that investigated brain activation during a maximal contraction also showed an initial increase in the number of voxels (first minute) followed by a decline during the second minute [Liu et al., 2002] in all investigated brain areas (M1, S1, prefrontal cortex, cingulate cortex, supplementary motor area and cerebellum). However, they did not present data on intensity of the BOLD response.
Increased brain activation can be due to an increase in signal intensity and or an increase in the size of the significantly activated area. Our data showed that both the intensity and the size of the activated area increased over time. An increase in area could be due to recruitment of ‘new’ neurons that are functionally involved in the activation of the target muscles or recruitment of neurons involved in the activation of nontarget muscles. The increase in EMG activity in the wrist flexor muscle demonstrates that nontarget muscles are activated during the contraction and that the increase in activated area could be affected by an increase in nontarget activity. In the study of Liu et al. [ 2002] the activity in hand and wrist muscles decreased and it is possible that the decline in BOLD response in the second half of their contraction was due to an overall decline in muscle activation. Similarly, the small decline in BOLD signal at the end of the contraction in the present study might be caused by a decline in the activation of the nontarget muscles at the end of the sustained high‐force contraction (Fig. 2C).
Our data also showed an increase in intensity over time (see increased intensity in the strongest activated voxel in Table I). Although a change in the relation between BOLD response and metabolic demands could be a complicating factor in the interpretation of the BOLD response during a sustained maximal contraction, this increase probably reflects an increase in neuronal input to that area or an increase in the neuronal processing of the input. Therefore, an increase in BOLD does not necessarily imply an increase in neuronal output activity [Logothetis et al., 2001]. Generally, an increase in excitatory synaptic input to neurons is positively related with an increase in neuronal spiking activity and therefore, often the BOLD response is positively correlated with neuronal activity. Although the BOLD response is more affected by excitatory input, changes in inhibitory input can strongly affect the BOLD response too [Attwell and Iadecola, 2002; Chatton et al., 2003; Lauritzen and Gold, 2003]. Thus, an increase in both inhibitory and excitatory input would increase the BOLD response but not necessarily the neuronal activity. It is unknown whether fatigue affects the input–output relations of cortical neurons. If this is the case, an increased input does not necessarily result in a proportional increase in neuronal output. However, there is evidence that during a sustained MVC both the excitatory and inhibitory input to the motor cortex increases. For instance, in the biceps muscle, the EMG response evoked by transcranial magnetic stimulation increases during a fatiguing MVC [Taylor et al., 1996, 1999] suggesting an increased excitability of the motor cortex, whereas the concurrent lengthening of the silent period reflect an increased inhibition to or in the motor cortex.
The decrease in cerebellum activity confirms previous data obtained in fatiguing submaximal contractions [Van Duinen et al., 2007b; however, cf. Liu et al., 2003]. This experiment [Van Duinen et al., 2007b], showed no increase in cerebellum activity during a fatiguing contraction, although the voluntary drive of the subjects increased. During our sustained MVC, the absolute force declines due to fatigue despite the fact that subjects produce a maximal effort throughout the whole contraction. Moreover, during the fatiguing contractions [both the sustained MVC and the fatiguing submaximal contraction in Van Duinen et al., 2007b] the variability in the force increased. We expected that the increase in variability would enhance the afferent input to the central nervous system and thus increase cerebellum activity. However, data from Vaillancourt et al. [Vaillancourt et al., 2006] already suggested that variability of force is not important for cerebellum activity. Our data suggests that the activity in the cerebellum is more related to the absolute force that is generated during the contraction than the relative force or force variability.
In the low‐force contraction, our results demonstrated an increase in the BOLD response at the start and end of the contraction. An overshoot in the BOLD data is often observed and is thought to be the consequence of the time course of the hemodynamic response. Interestingly, this increase was also seen at the end of the contraction. In this situation, the BOLD increase presumably reflects an increased neuronal activation due to muscle relaxation [see also Toma et al., 1999], although activation of other (upper arm) muscles to maintain position during relaxation of the hand muscles can not be discarded.
Interestingly, many motor areas were activated bilaterally during the unilateral tasks with the index finger. This bilateral activation of motor areas during unilateral tasks is a common observation in fMRI‐studies and is known to be more pronounced during contractions that require a greater voluntary effort [Dettmers et al., 1995; van Duinen et al., 2008]. The bilateral activity seen in our study may reflect a functional involvement of the ipsilateral hemisphere during sustained contractions. Alternatively, the bilateral activity could also represent activation of the muscles contralateral to the target muscle [Zijdewind et al., 2006; Zijdewind and Kernell, 2001]. Indeed, during the sustained high‐force contraction an increase in force and EMG was observed in the left, nontarget hand.
In conclusion, during a sustained high‐force contraction, force, EMG and voluntary activation of the target muscles declines significantly over time. This decline was associated with an increase in fMRI signal in most of the motor areas, suggesting an increased input to these areas. However, this increase was not adequate to overcome fatigue‐related changes in the voluntary drive, as measured with the superimposed twitch technique. This observation can most likely be explained by fatigue‐induced changes in input‐output relations of cortical neurons, and/or a simultaneous increase in both excitatory and inhibitory input to cortical neurons.
Acknowledgements
The authors thank Koen Vaartjes for his technical support, and Anita Kuiper for operating the MR scanner.
REFERENCES
- Allen GM,Gandevia SC,McKenzie DK ( 1995): Reliability of measurements of muscle strength and voluntary activation using twitch interpolation. Muscle Nerve 18: 593–600. [DOI] [PubMed] [Google Scholar]
- Attwell D,Iadecola C ( 2002): The neural basis of functional brain imaging signals. Trends Neurosci 25: 621–625. [DOI] [PubMed] [Google Scholar]
- Belanger AY,McComas AJ ( 1981): Extent of motor unit activation during effort. J Appl Physiol 51: 1131–1135. [DOI] [PubMed] [Google Scholar]
- Benwell NM,Mastaglia FL,Thickbroom GW ( 2007): Changes in the functional MR signal in motor and non‐motor areas duringintermittent fatiguing hand exercise. Exp Brain Res 182: 93–97. [DOI] [PubMed] [Google Scholar]
- Bigland‐Ritchie B,Woods JJ ( 1984): Changes in muscle contractile properties and neural control during human muscular fatigue. Muscle Nerve 7: 691–699. [DOI] [PubMed] [Google Scholar]
- Bigland‐Ritchie B,Donovan EF,Roussos CS ( 1981): Conduction velocity and EMG power spectrum changes in fatigue of sustained maximal efforts. J Appl Physiol 51: 1300–1305. [DOI] [PubMed] [Google Scholar]
- Brett M,Anton J,Valabregue R,Poline J ( 2002): Region of interest analysis using an SPM toolbox Presented at the 8th International Conference on Functional Mapping of the Human Brain 2–6 june 2002, Sendai, Japan. Neuroimage 16: 372–373 [Google Scholar]
- Chatton JY,Pellerin L,Magistretti PJ ( 2003): GABA uptake into astrocytes is not associated with significant metabolic cost: Implications for brain imaging of inhibitory transmission. Proc Natl Acad Sci USA 100: 12456–12461. [DOI] [PMC free article] [PubMed] [Google Scholar]
- Cupido CM,Galea V,McComas AJ ( 1996): Potentiation and depression of the M wave in human biceps brachii. J Physiol 491: 541–550. [DOI] [PMC free article] [PubMed] [Google Scholar]
- Dettmers C,Fink GR,Lemon RN,Stephan KM,Passingham RE,Silbersweig D,Holmes A,Ridding MC,Brooks DJ,Frackowiak RS ( 1995): Relation between cerebral activity and force in the motor areas of the human brain. J Neurophysiol 74: 802–815. [DOI] [PubMed] [Google Scholar]
- Dettmers C,Lemon RN,Stephan KM,Fink GR,Frackowiak RS ( 1996): Cerebral activation during the exertion of sustained static force in man. Neuroreport 7: 2103–2110. [DOI] [PubMed] [Google Scholar]
- Eickhoff SB,Stephan KE,Mohlberg H,Grefkes C,Fink GR,Amunts K,Zilles K ( 2005): A new SPM toolbox for combining probabilistic cytoarchitectonic maps and functional imaging data. Neuroimage 25: 1325–1335. [DOI] [PubMed] [Google Scholar]
- Enoka RM,Stuart DG ( 1992): Neurobiology of muscle fatigue. JAppl Physiol 72: 1631–1648. [DOI] [PubMed] [Google Scholar]
- Fitts RH ( 1994): Cellular mechanisms of muscle fatigue. Physiol Rev 74: 49–94. [DOI] [PubMed] [Google Scholar]
- Gandevia SC ( 2001): Spinal and supraspinal factors in human muscle fatigue. Physiol Rev 81: 1725–1789. [DOI] [PubMed] [Google Scholar]
- Gandevia SC,Allen GM,Butler JE,Taylor JL ( 1996): Supraspinal factors in human muscle fatigue: Evidence for suboptimal output from the motor cortex. J Physiol 490: 529–536. [DOI] [PMC free article] [PubMed] [Google Scholar]
- Hicks A,McComas AJ ( 1989): Increased sodium pump activity following repetitive stimulation of rat soleus muscles. J Physiol 414: 337–349. [DOI] [PMC free article] [PubMed] [Google Scholar]
- Hicks A,Fenton J,Garner S,McComas AJ ( 1989): M wave potentiation during and after muscle activity. J Appl Physiol 66: 2606–2610. [DOI] [PubMed] [Google Scholar]
- Kernell D ( 2006): Short‐term plasticity: Fatigue and potentiation In: The motoneurone and its muscle fibres. New York: Oxford University Press,pp 183–202. [Google Scholar]
- Lauritzen M,Gold L ( 2003): Brain function and neurophysiological correlates of signals used in functional neuroimaging. J Neurosci 23: 3972–3980. [DOI] [PMC free article] [PubMed] [Google Scholar]
- Lemieux L,Allen PJ,Franconi F,Symms MR,Fish DR ( 1997): Recording of EEG during fMRI experiments: Patient safety. Magn Reson Med 38: 943–952. [DOI] [PubMed] [Google Scholar]
- Liu JZ,Dai TH,Sahgal V,Brown RW,Yue GH ( 2002): Nonlinear cortical modulation of muscle fatigue: A functional MRI study. Brain Res 957: 320–329. [DOI] [PubMed] [Google Scholar]
- Liu JZ,Shan ZY,Zhang LD,Sahgal V,Brown RW,Yue GH ( 2003): Human brain activation during sustained and intermittent submaximal fatigue muscle contractions: An FMRI study. J Neurophysiol 90: 300–312. [DOI] [PubMed] [Google Scholar]
- Logothetis NK,Pauls J,Augath M,Trinath T,Oeltermann A ( 2001): Neurophysiological investigation of the basis of the fMRI signal. Nature 412: 150–157. [DOI] [PubMed] [Google Scholar]
- Mayka MA,Corcos DM,Leurgans SE,Vaillancourt DE ( 2006): Three‐dimensional locations and boundaries of motor and premotor cortices as defined by functional brain imaging: A meta‐analysis. Neuroimage 31: 1453–1474. [DOI] [PMC free article] [PubMed] [Google Scholar]
- Merton PA ( 1954): Voluntary strength and fatigue. J Physiol 123: 553–564. [DOI] [PMC free article] [PubMed] [Google Scholar]
- Oldfield RC ( 1971): The assessment and analysis of handedness: The Edinburgh inventory. Neuropsychologia 9: 97–113. [DOI] [PubMed] [Google Scholar]
- Post M,Renken R,Zijdewind I ( 2006): Cortical activity during a sustained maximal contraction: An fMRI study. Med Sci Sports Exerc 38S: S344. [DOI] [PMC free article] [PubMed] [Google Scholar]
- Schillings ML,Hoefsloot W,Stegeman DF,Zwarts MJ ( 2003): Relative contributions of central and peripheral factors to fatigue during a maximal sustained effort. Eur J Appl Physiol 90: 562–568. [DOI] [PubMed] [Google Scholar]
- Sogaard K,Gandevia SC,Todd G,Petersen NT,Taylor JL ( 2006): The effect of sustained low‐intensity contractions on supraspinal fatigue in human elbow flexor muscles. J Physiol 573: 511–523. [DOI] [PMC free article] [PubMed] [Google Scholar]
- Taylor JL,Butler JE,Allen GM,Gandevia SC ( 1996): Changes in motor cortical excitability during human muscle fatigue. J Physiol 490: 519–528. [DOI] [PMC free article] [PubMed] [Google Scholar]
- Taylor JL,Butler JE,Gandevia SC ( 1999): Altered responses of human elbow flexors to peripheral‐nerve and cortical stimulation during a sustained maximal voluntary contraction. Exp Brain Res 127: 108–115. [DOI] [PubMed] [Google Scholar]
- Thickbroom GW,Phillips BA,Morris I,Byrnes ML,Mastaglia FL ( 1998): Isometric force‐related activity in sensorimotor cortex measured with functional MRI. Exp Brain Res 121: 59–64. [DOI] [PubMed] [Google Scholar]
- Thomas CK,Woods JJ,Bigland‐Ritchie B ( 1989): Impulse propagation and muscle activation in long maximal voluntary contractions. J Appl Physiol 67: 1835–1842. [DOI] [PubMed] [Google Scholar]
- Todd G,Petersen NT,Taylor JL,Gandevia SC ( 2003): The effect of a contralateral contraction on maximal voluntary activation and central fatigue in elbow flexor muscles. Exp Brain Res 150: 308–313. [DOI] [PubMed] [Google Scholar]
- Toma K,Honda M,Hanakawa T,Okada T,Fukuyama H,Ikeda A,Nishizawa S,Konishi J,Shibasaki H ( 1999): Activities of the primary and supplementary motor areas increase in preparation and execution of voluntary muscle relaxation: An event‐related fMRI study. J Neurosci 19: 3527–3534. [DOI] [PMC free article] [PubMed] [Google Scholar]
- Tzourio‐Mazoyer N,Landeau B,Papathanassiou D,Crivello F,Etard O,Delcroix N,Mazoyer B,Joliot M ( 2002): Automated anatomical labeling of activations in SPM using a macroscopic anatomical parcellation of the MNI MRI single‐subject brain. Neuroimage 15: 273–289. [DOI] [PubMed] [Google Scholar]
- Vaillancourt DE,Mayka MA,Corcos DM ( 2006): Intermittent visuomotor processing in the human cerebellum, parietal cortex, and premotor cortex. J Neurophysiol 95: 922–931. [DOI] [PMC free article] [PubMed] [Google Scholar]
- Van Duinen H,Zijdewind I,Hoogduin H,Maurits N ( 2005): Surface EMG measurements during fMRI at 3T: Accurate EMG recordings after artifact correction. Neuroimage 27: 240–246. [DOI] [PubMed] [Google Scholar]
- Van Duinen H,Post M,Vaartjes K,Hoogduin H,Zijdewind I ( 2007a): MR compatible strain gauge based force transducer. J Neurosci Methods 164: 247–254. [DOI] [PubMed] [Google Scholar]
- Van Duinen H,Renken R,Maurits N,Zijdewind I ( 2007b): Effects of motor fatigue on human brain activity, an fMRI study. Neuroimage 35: 1438–1449. [DOI] [PubMed] [Google Scholar]
- Van Duinen H,Renken R,Maurits NM,Zijdewind I ( 2008): Relation between muscle and brain activity during isometric contractions of the first dorsal interosseus muscle. Hum Brain Mapp 29: 281–299. [DOI] [PMC free article] [PubMed] [Google Scholar]
- Zijdewind I,Kernell D ( 1994): Fatigue associated EMG behavior of the first dorsal interosseous and adductor pollicis muscles in different groups of subjects. Muscle Nerve 17: 1044–1054. [DOI] [PubMed] [Google Scholar]
- Zijdewind I,Kernell D ( 2001): Bilateral interactions during contractions of intrinsic hand muscles. J Neurophysiol 85: 1907–1913. [DOI] [PubMed] [Google Scholar]
- Zijdewind C,Bosch W,Goessens L,Kandou TW,Kernell D ( 1990): Electromyogram and force during stimulated fatigue tests of muscles in dominant and non‐dominant hands. Eur J Appl Physiol Occup Physiol 60: 127–132. [DOI] [PubMed] [Google Scholar]
- Zijdewind I,Zwarts MJ,Kernell D ( 1998): Influence of a voluntary fatigue test on the contralateral homologous muscle in humans? Neurosci Lett 253: 41–44. [DOI] [PubMed] [Google Scholar]
- Zijdewind I,Butler JE,Gandevia SC,Taylor JL ( 2006): The origin of activity in the biceps brachii muscle during voluntary contractions of the contralateral elbow flexor muscles. Exp Brain Res 175: 526–535. [DOI] [PubMed] [Google Scholar]