

Abstract
Caffeine ingestion results in increased brain cell metabolism (Nehlig et al. [1992] Brain Res Brain Res Rev 17:139–170) and decreased cerebral blood flow (Field et al. [2003] Radiology 227:129–135; Mulderink et al. [2002] Neuroimage 15:37–44). The current study investigated the effect of caffeine in a word stem completion task using only novel word stems (no repeated stimuli). Resting perfusion was measured with arterial spin labeled perfusion MRI, along with blood oxygenation level‐dependent (BOLD) signal before and after ingestion of regular coffee, decaffeinated coffee, and water. Based on previous research (Laurienti et al. [2002] Neuroimage 17:751–757; Mulderink et al. [2002] Neuroimage 15:37–44), we hypothesized that caffeine would result in increased BOLD signal intensity and extent of BOLD activation. As expected, caffeine resulted in a significant decrease in cerebral perfusion. However, both the control and caffeine groups showed an increase in BOLD signal amplitude across two sets of novel word stems. Additionally, the control group showed a 50% reduction in the extent of BOLD activation, while the caffeine group showed no change in activation extent. Neither group showed changes in BOLD baseline signal over time, which had been suggested to mediate caffeine‐related BOLD signal changes. The results suggest that caffeine may attenuate general task practice effects that have been described in recent functional MRI studies of word stem completion (Buckner et al. [2000] Brain 123:620–640). Hum Brain Mapp 2006. © 2006 Wiley‐Liss, Inc.
INTRODUCTION
The most widely used stimulant in the general population is caffeine. Caffeine is highly lipid soluble, crosses the blood–brain barrier quickly, and remains stable for at least an hour, with a slow steady clearance over 3–4 h and longer. Caffeine is a nonspecific antagonist for adenosine receptors, which are distributed widely throughout the cortex [for review, see Nehlig et al., 1992]. Brain regions mediating sleep, mood, and concentration, including the dorsal and medial raphe nuclei and the locus coeruleus, show substantial increases in activity at low doses of caffeine [Nehlig and Boyet, 2000], which probably collectively account for the general increase in alertness and well‐being reported by individuals. Caffeine is also a powerful vasoconstrictor due to antagonism of the vasodilative effects of adenosine [Fredholm, 1995]. Shortly after consumption, caffeine results in a sustained drop in cerebral perfusion as measured by multiple techniques [Cameron et al., 1990; Hasenfratz and Battig, 1992; Mathew et al., 1983; Mathew and Wilson, 1985].
Due to the prevalence of caffeine consumption, the physiological effects of this agent are a concern for researchers who utilize neuroimaging methods that may be sensitive to changes in perfusion, such as blood oxygenation level‐dependent (BOLD) functional MRI (fMRI). Data concerning the effect of caffeine on the BOLD signal are sparse. Mulderink et al. [2002] measured fMRI BOLD signal both before and after ingestion of caffeine or a placebo, while participants performed a visually cued motor task. They found that individuals who ingested caffeine showed a significant increase in BOLD signal in both motor and visual areas, while no such change was observed in the placebo group. Perfusion decreased significantly in the caffeine treatment group compared to the placebo group, as measured by arterial spin‐labeled MRI. The authors suggest that caffeine decreases perfusion, leading to a decrease in the BOLD signal baseline from which subsequent BOLD activation changes are measured. Since signal amplitude is measured relative to baseline, a caffeine‐induced decrease in this baseline would lead to a measurably larger BOLD response. The authors conclude that caffeine may serve as a contrast booster for fMRI experiments.
Laurienti et al. [2002] examined the effect of caffeine on BOLD signal during two passive sensory stimulation tasks (visual checkerboard and auditory white noise). They tested the hypothesis that caffeine would differentially affect BOLD signal in high and low caffeine users (ingesting an equivalent of 27 cups of coffee per week compared to 2 cups of coffee per week, respectively). They reported an increase in peak amplitude of BOLD signal following caffeine intake in high caffeine users, but no change in the low caffeine user group. Perfusion was not measured directly in this study, so it is unclear whether caffeine affected perfusion differently in the two groups.
While it is clear that caffeine can affect the fMRI signal, the mechanism underlying the signal change remains unclear. Mulderink et al. [2002] hypothesized that perfusion change mediates the caffeine effect, therefore, an individual's perfusion response to caffeine should predict the degree of change in the BOLD signal, but this hypothesis has not been directly tested. Mulderink et al. [2002] reported only group differences in perfusion and BOLD signal before and after ingestion of caffeine, and Laurenti et al. [2002] did not report perfusion measures.
In the current study we measured fMRI BOLD signal during a word stem completion task in individuals with a caffeine intake history ranging from low to high. Perfusion was measured with an arterial spin labeling perfusion (flow‐sensitive alternating inversion recovery, FAIR) technique [Kim, 1995]. Measurements were acquired before and after consumption of caffeinated coffee or one of two control beverages—water or decaffeinated coffee—allowing us to directly examine the linear relationship between BOLD signal change and perfusion change. We hypothesized that caffeine would result in decreased perfusion and that the degree of perfusion change after ingesting caffeine would be related to the degree of change in BOLD signal amplitude, extent of activation, or both.
Mulderink et al. [2002] also suggested that perfusion change moderates BOLD signal via an alteration in baseline MRI signal, although they did not report baseline signal values. Baseline signal can be measured directly during a cognitive task by identifying voxels that do not show a significant hemodynamic response (HDR) that is time‐locked to the presentation of stimuli [Kwong et al., 1992]. BOLD signal baseline has been estimated in alternative fashions, such as during passive rest; however, this estimation may be confounded by cognitive activity that is not under the experimenter's control [Stark and Squire, 2001]. In the current study, we measured baseline signal by identifying a subset of voxels that were not active either prior to beverage ingestion or after beverage ingestion. Based on Mulderink et al. [2002], we hypothesized that there would be a linear relationship between baseline signal change, perfusion change, and BOLD signal change, in response to caffeine ingestion. Individuals with greater reductions in perfusion would show greater decreases in baseline signal, resulting in greater increases in BOLD signal amplitude.
An additional issue related to the mechanism of caffeine's effect on BOLD signal change concerns the nature of the cognitive task. Although it is useful to determine the effect of caffeine in relatively pure perceptual and motor tasks, the studies described earlier do not consider how caffeine affects more typical cognitive tasks. In language or memory tasks, for example, cognitive factors such as attention, general practice effects, and stimulus repetition may also mediate BOLD signal changes that are unrelated to perfusion. The current study used a word stem completion (WSC) task that is known to reliably activate a number of brain regions including temporal, parietal, occipital, and frontal lobes. WSC shows significant stimulus repetition effects over time that result in decreases in BOLD signal amplitude in multiple brain regions [Buckner et al., 1995; Henson, 2003; Ojemann et al., 1998; Palmer et al., 2001]. In the present study we did not include repeated trials of word stems, that is, all word stems in the task were novel and, therefore, no priming effect was expected. However, although few studies have measured more general practice effects, at least one study using WSC [Buckner et al., 2000] demonstrated BOLD signal reductions across blocks of trials, even when the specific stimuli in each block were novel. The present study allowed us to explore the interaction between general practice effects and caffeine in a typical fMRI paradigm.
Several other methodological issues were also considered here. First, previous studies scanned participants in two separate sessions, removing participants from the scanner for the purpose of caffeine administration. Separate scanning sessions are not optimal, since BOLD acquisition may not be systematic across fMRI sessions [McGonigle et al., 2000]. In the current study, participants ingested caffeine and control beverages while remaining supine in the scanner, thus ensuring identical head position and minimizing slight variations in scanner hardware characteristics that normally vary from session to session (e.g., shimming performed to homogenize the B0 field).
Second, we collected T1 maps in a subset of participants for comparison before and after caffeine ingestion because of the sensitivity of arterial spin labeled MRI to changes in tissue relaxation, thus ensuring that any observed changes in perfusion could be attributed to the vasoconstrictor effects of caffeine and not to time‐ or caffeine‐induced changes in T1 values. Finally, it is not uncommon for certain behavioral and physiological responses to occur prior to administration of a drug or even at the suggestion that a drug has been administered, particularly when the individual has experienced the effects of the drug previously [Mikalsen et al., 2001; Mitchell et al., 1996]. In order to investigate the possible presence of drug‐expectancy effects, participants assigned to the control group were administered one of two beverages (either water or decaffeinated coffee). Control participants who received decaffeinated coffee were not informed of its decaffeinated nature until the completion of the experiment. The two control groups were compared on reaction time, perfusion measures, and fMRI BOLD measures to assess the effects of expectancy.
SUBJECTS AND METHODS
Participants
Volunteers included 21 healthy adults (7 males, 14 females, ages 18–40 years). Participants underwent a health screening questionnaire to exclude past or current neurological disorder, brain injury, or psychiatric disability. Participants were also screened for contraindications to MRI and completed a caffeine use questionnaire. In order to avoid adverse reactions to caffeine exposure during the experiment, participants who did not ingest caffeine daily in some form (tea, coffee, chocolate, etc.) were excluded from the study. Participants using tobacco were also excluded from the study due to the effects of nicotine on cerebral perfusion [Rogers et al., 1985].
Participants were randomly assigned to one of three groups. The caffeine group (n = 10) was given a 12‐ounce cup of coffee that was prepared in a standardized fashion. Folger's instant coffee or decaffeinated coffee was prepared according to the package instructions, so that all participants ingested the same amount of caffeine, ∼222 mg (Folger's Customer Service, pers. commun.). The control group drank either 12 ounces of water (n = 6) or a 12‐ounce cup of decaffeinated coffee (n = 5). The weight range of participants who consumed caffeine was 110–200 lbs and the weight range of control participants was 125–235 lbs. All procedures were approved by the Human Subjects Committee at the University of Arizona.
Materials
Stimuli for the WSC task consisted of 300 unique three‐letter word stems, such as “RET_____” or “MAR_____”, with a range of possible English language completions (ranging from 3 to >100). In addition to word stems, 150 control stimuli (“XXX”) served as visual and motor baseline controls. The stimuli were randomly divided into two lists, each containing 225 randomly ordered trials (150 word stems and 75 control items). One list was completed prior to administration of a beverage, while the second WSC list was completed following a beverage.
Procedure
Prior to scanning, participants completed medical screening, consent forms, screening for contraindications to MRI, and a caffeine use history questionnaire. Scanning was conducted at approximately the same time every day for all subjects, between 8 and 11 pm. Participants were requested to abstain from food, beverage, and medications containing caffeine for 8 h prior to scanning and were questioned about recent dietary intake immediately prior to scanning to ensure compliance. They were informed that that they would be required to drink 12 ounces of fluid while in the scanner, either coffee or water. In order to assess expectancy effects, all participants receiving coffee were told that their coffee contained caffeine. Participants were told that at two times during the experiment they would be required to perform a word generation task, each 15 min in length, and were given a brief practice session on the WSC task while sitting at a computer outside of the scanner room. Stimuli were presented on the computer screen with DMDX computer presentation software [Forster and Forster, 2003], in uppercase black 80‐point Arial font centered on a white background. Each stimulus was visible for 500 ms, followed by a blank screen for 3500 ms. Participants had 4000 ms to make a response before the next word stem displayed automatically. Participants were instructed to think of the first word that comes to mind to complete the stem. They were instructed not to verbalize their responses, but instead to mentally generate a completion, and to press the mouse button in their right hand as soon as they thought of a word. Participants were told that upon viewing control trials (XXX) they should press the left hand mouse button as quickly as possible, and then wait for the next word stem to appear.
Once inside the scanner, participants viewed the stimuli through MR Vision 2000 goggles (Resonance Technologies, Northridge, CA) secured to the headcoil and resting comfortably over the eyes. Response times were collected using two computer mice modified for use in the MRI scanner and placed in the participant's hands. A plastic cup was attached to the side of the head coil and plastic tubing was taped to the cup at a sufficient length to reach the participant's mouth. Foam cushioning was used to comfortably secure the participant's head and reduce motion. Prior to scanning, participants were instructed to practice moving the drinking tube to his or her mouth while the experimenter monitored head movement. When the subject was able to perform the task without head movement, room temperature coffee, water, or decaffeinated coffee was poured into the cup and the scanner bed was moved into the bore of the magnet.
Scanning began with two localizer scans followed by a 5‐min arterial spin labeled (ASL) perfusion scan. Participants then completed the first WSC task while undergoing fMRI, followed by the second ASL perfusion scan and acquisition of a set of T1‐weighted anatomical images. Participants were instructed at this point to drink the beverage at their own pace (which took between 3 and 10 min) and were reminded not to move their head. After the beverage was consumed the experimenter began timing a 15‐min interval to allow the caffeine to be absorbed [Institute of Medicine, 2001]. During this interval a 3D SPGR scan was acquired. Once 15 min had passed the third ASL perfusion scan was acquired. Participants then completed the second WSC list while undergoing fMRI, followed by the fourth and final perfusion scan. T1 mapping was carried out in a subset of participants (four caffeine, eight controls) to assess the effect of caffeine on T1‐relaxation times. These experiments were carried out immediately following the first and third ASL perfusion scans. The total scanning time (including T1 mapping) was 90 min. Following the experiment, participants were debriefed and informed whether their coffee was regular or decaffeinated.
Imaging Parameters
Images were acquired on a 1.5 T GE Signa MRI (Milwaukee, WI) scanner using a quadrature birdcage headcoil for excitation and reception. Perfusion images were acquired with a FAIR sequence [Kim, 1995] using a single‐shot spiral readout [Yen, 2002]. Fifty pairs of images were acquired from five axial sections (8 mm with a 2 mm gap, field of view (FOV) = 22) using nonselective and selective inversion prior to data collection. The selective inversion slab extended 10 mm superior and inferior to the imaging volume with an inversion time of 1400 ms, TE = 8 ms and TR = 3000 ms. Perfusion sections were positioned as superior as possible to allow for greatest arterial labeling by the headcoil.
Functional scans were acquired with a single‐shot gradient‐echo spiral sequence [Glover and Lee, 1995] and consisted of 12 axial 5‐mm sections, no skip (FOV = 22 cm, TE = 40 ms, TR = 2000 ms, 456 volumes acquired). Sections were positioned to overlap with the perfusion images, so that two functional sections corresponded to every one perfusion section (including gap), with one extra functional section superior and inferior to the perfusion volume.
T1‐weighted anatomical images (TE = 10, TR = 400) were acquired with the same section selection and FOV as the functional dataset. High‐resolution T1‐weighted 3D SPGR images (TE = 6000, TR = 22) were acquired sagittally with 1 × 1 × 1.5 mm resolution in the right/left (R/L), anterior/posterior (A/P), and superior/inferior (S/I) directions, with an acquisition time of 12 min. The T1 maps acquired on a subset of participants were generated using an inversion recovery prepped single‐shot spiral sequence that matched the section positioning of the ASL perfusion images. Images were acquired with 30 different inversion times (TI), ranging from 50–4000 ms with TE = 8 ms and TR = 6000 ms.
All spiral datasets were transferred from the MRI scanner to an offline workstation and reconstructed via regridding [Yen, 2002].
fMRI Image Analysis
fMRI images were corrected for minor head movement and normalized using analysis of functional neuroimages (AFNI) [Cox, 1996] so that scans had the same global average, allowing the data to be compared across scans and across subjects. After normalization, data for each individual was analyzed using event‐related fMRI methods developed by Dale et al. [1999]. The time series data for every voxel were correlated with a reference function derived from an idealized hemodynamic response that identified the contrast of interest. The resulting correlation maps were then thresholded at P < 0.0001 (two‐tailed).
In order to characterize changes in the BOLD fMRI signal, both the extent of significant brain activation (number of significant voxels) and the intensity of the BOLD signal (average signal amplitude) were assessed prior to beverage ingestion (PRE‐BEV) and following beverage ingestion (POST‐BEV). Changes to the extent of activation were identified by counting the number of voxels that met statistical significance PRE‐BEV and counting the number of voxels that met statistical significance POST‐BEV. Changes to the intensity of the BOLD signal were assessed by calculating peak intensity values for significant voxels PRE‐BEV and POST‐BEV. This peak intensity was calculated as an average of the BOLD intensity values at 4, 6, and 8 s poststimulus onset. Although possibly more conservative, averaging three time points rather than selecting a single peak value is less likely to be biased by choosing values representing statistical outliers.
BOLD Baseline
Using raw (unnormalized) fMRI images, baseline signal was calculated for all participants based on 20 gray matter voxels that did not exhibit variation in signal amplitude with stimulus, either PRE‐BEV or POST‐BEV. The voxels were selected by one operator who was blind to group status. Baseline signal for a given individual was averaged over 18 s poststimulus onset and across the total 20 voxels. The same voxels were compared PRE‐BEV to POST‐BEV. Although the specific location of the voxels varied for each subject, depending on where significant activation was found, the baseline measure always included voxels in frontal, parietal, occipital, and temporal regions.
Perfusion Image Analysis
ASL perfusion images were analyzed using programs written in IDL (Interactive Data Language, RSI, Boulder, CO). A perfusion map was the average of 50 subtraction images, each calculated as the spin‐tagged image subtracted from the corresponding untagged image. In order to eliminate occasional anomalous high intensity or negative outliers (present in large vessels) from the perfusion map, negative values were removed and a median perfusion intensity value was calculated for the remaining brain. Individual voxel perfusion values that fell three standard deviations (SD) higher than the median intensity were considered nonphysiologic outliers and were not included in the perfusion map. On average, less than 1% of voxels were dropped with this procedure. From the outlier‐corrected maps a mean perfusion value, Pave, was calculated across all five sections for each subject.
Perfusion measures were acquired at four times during the experiment, two PRE‐BEV and two POST‐BEV. In order to assess the stability of the perfusion measure, perfusion maps were first compared across the first two PRE‐BEV time points. Changes in perfusion were assessed by comparing the average perfusion measures from the second perfusion scan (PRE‐BEV) to the fourth perfusion scan (POST‐BEV). These two perfusion scans were selected because they were closest in time to the acquisition of the PRE‐BEV and POST‐BEV fMRI data.
T1 Map Analysis
T1 maps were calculated from the IR‐prepped spiral images by fitting the magnitude of the image intensity vs. TI to a single exponential recovery [Yen, 2002].
RESULTS
Comparison of Water and Decaffeinated Coffee Control Groups
In order to investigate the possible presence of drug expectancy effects, the two control groups were compared on behavioral and imaging measures using independent t‐tests. No differences were found between the two control groups on response time, average perfusion, extent of BOLD activation, BOLD average signal intensity, or BOLD average baseline, either PRE‐BEV or POST‐BEV (all t's (9) < 1.97, not significant (ns)). Because the two control groups did not differ significantly on any of the experimental measures, they were combined into a single control group for the remainder of the analyses.
Behavioral Results
Response times (RT)
A mixed‐factorial analysis of variance (ANOVA) tested the within‐subject factor TIME (PRE‐BEV, POST‐BEV) and the between‐subject factor GROUP (caffeine, control). There was an overall difference in RTs between the groups, with the caffeine group (M = 889.58, SEM = 61.98) showing significantly faster completion times than the control group (M = 1079.59, SEM = 61.98), F(1,14) = 4.69, MSe = 61463.75, P < 0.05. However, there was no significant effect of TIME, F(1,14) = 1.71, MSe = 13667.13, nor was there a significant interaction between TIME and GROUP, F(1,14) = 1.57, MSe = 13667.13, suggesting that caffeine did not have a measurable effect on stem completion times.
Perfusion Measures
Perfusion
Stability of the perfusion measure was determined by comparing the two perfusion measurements taken ∼20 min apart, prior to beverage ingestion, using a mixed‐factorial ANOVA with the PRE‐BEV measures (first, second) as the within‐subject factor and GROUP (caffeine, control) as the between‐subject factor. Neither main effect nor the interaction between the two factors approached significance (all F's < 1), suggesting that the perfusion measurement was stable and reliable. The effect of caffeine on cerebral perfusion was assessed by comparing the values of Pave PRE‐BEV and POST‐BEV. It was hypothesized that global perfusion would not change following beverage ingestion in the control group but would show a decrease from pre‐ to postbeverage ingestion in the caffeine group. A mixed‐factorial ANOVA compared the within‐subjects effect of TIME (pre, post) and the between‐subject factor of GROUP (caffeine, control). Both groups showed a decrease in global perfusion from prebeverage (M = 147.93, SD = 10.84) to postbeverage (M = 138.95, SD = 9.23), indicated by a significant effect of TIME, F(1,19) = 21.87, MSe = 35.59, P < 0.001. Overall, the caffeine group (M = 138.59, SD = 10.26) had lower global perfusion scores than the control group (M = 148.29, SD = 9.81), F(1,19) = 5.94, MSe = 166.16, P < 0.05. Importantly, there was also a significant interaction between TIME and GROUP, F(1,19) = 9.78, MSe = 35.59, P < 0.05. The results of independent t‐tests indicate that the caffeine (M = 146.08, SD = 9.99) and the control group (M = 149.78, SD = 11.68) did not differ in perfusion prebeverage, t(19) < 1, P = 0.78, but that the caffeine group (M = 131.09, SD = 10.51) had significantly decreased perfusion compared to the control group (M = 146.81, SD = 7.95) postbeverage ingestion, t(19) = −3.89, P < 0.001 (see Fig. 1).1
Figure 1.
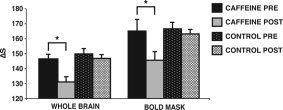
Perfusion before (PRE‐BEV) and after (POST‐BEV) beverage ingestion. Perfusion change across the whole brain is shown on the left. The bars represent a change in signal between images collected with and without selective inversion (ΔS). It was of particular interest whether perfusion changed from PRE‐BEV to POST‐BEV in voxels where BOLD signal amplitude was assessed (shown on the right). We used the PRE‐BEV BOLD mask and applied it to the PRE‐BEV perfusion data and the POST‐BEV perfusion data to assess change in perfusion. In both analyses the caffeine group showed a significant decrease in perfusion following beverage ingestion. Error bars are SEM.
fMRI: Extent of Activation
The extent of BOLD activation (as measured by the total number of active voxels across the entire brain) from PRE‐BEV to POST‐BEV was assessed with a mixed‐factorial ANOVA with TIME (PRE‐BEV, POST‐BEV) as the within‐subject factor and GROUP (caffeine, control) as the between‐subject factor. Results indicated a significant effect of TIME, F(1,19) = 8.09, MSe = 39025.20, P = 0.01, and a significant interaction between TIME and GROUP, F(1,19) = 8.08, MSe = 39025.20, P = 0.01. As is evident in the example displayed in Figure 2, while the extent of activation decreased significantly in the control group, the caffeine group showed no change in the extent of activation. The control group showed more than a 50% decrease in the number of active voxels from PRE‐BEV (M = 682.36, SD = 377.53) to POST‐BEV (M = 335.18, SD = 178.85), paired sample t(10) = 4.02, P < 0.05. In contrast, the caffeine group showed no change in active voxels from PRE‐BEV (M = 485.62, SD = 461.74) to POST‐BEV (M = 486.50, SD = 326.16), t(9) < 1. The main effect of GROUP did not approach significance, F(1,21) < 1. The result of an independent t‐test indicated that the caffeine (M = 485.60, SD = 461.74) and the control group (M = 682.36, SD = 377.53) did not differ in the extent of PRE‐BEV activation.
Figure 2.
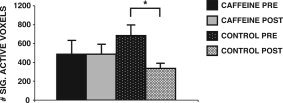
Voxel activation before (PRE‐BEV) and after (POST‐BEV) beverage ingestion. Voxels that met statistical significance for activation were counted in each participant PRE‐BEV and POST‐BEV. A group average was calculated PRE‐BEV and POST‐BEV. The control group showed a significant decrease in the number of active voxels from PRE‐BEV to POST‐BEV, while the caffeine group showed virtually no change in the number of active voxels from PRE to POST. Error bars are SEM.
fMRI: Intensity
Average BOLD signal intensity (average of peak intensity values for significant voxels) was assessed with a mixed‐factorial ANOVA comparing the within‐subject factor TIME (PRE‐BEV, POST‐BEV) and the between‐subject factor GROUP (caffeine, control). The results (see Fig. 3) indicated that the amplitude of the HDR increased significantly in both groups; the caffeine group increased from PRE‐BEV (M = 2.4, SD = 0.62) to POST‐BEV (M = 3.03, SD = 0.66), and the control group increased from PRE‐BEV (M = 2.79, SD = 0.47) to POST‐BEV (M = 3.53, SD = 0.48) reflected as a significant effect of TIME, F(1,19) = 14.58, MSe = 0.30, P < 0.001. Importantly, the interaction between TIME and GROUP was not significant, F < 1, although there was an overall difference in BOLD intensity between the two groups. The control group (M = 3.16, SEM = 0.12) had overall greater signal intensity than the caffeine group (M = 2.74, SEM = 0.12), F(1,19) = 5.62, MSe = 0.32, P < 0.05. An independent t‐test indicated that the caffeine (M = 2.47, SD 0.62) and the control group (M = 2.79, SD = 0.47) did not differ in the extent of PRE‐BEV BOLD intensity.
Figure 3.
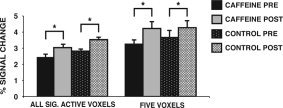
Signal amplitude before (PRE‐BEV) and after (POST‐BEV) beverage ingestion. Signal amplitude was calculated for each participant by averaging the peak intensity values at 4, 6, and 8 s poststimulus onset for all significant voxels PRE‐BEV and POST‐BEV (shown on the left). Both the caffeine group and the control group showed an increase in signal amplitude during the second word stem completion task (POST‐BEV). Signal amplitude was also assessed in five voxels that met statistical significance for activation both PRE‐BEV and POST‐BEV (shown on the right). The pattern is identical to that found for all significantly active voxels in the brain. Error bars are SEM.
We were surprised by this finding, because it was not consistent with the results of Mulderink et al. [2002]. It was possible that the outcome differed due to the selection of voxels that were compared before and after caffeine ingestion. Whereas Mulderink et al. [2002] only compared five voxels in a single brain region, the analysis described here included all voxels in the brain that met the criterion for statistical significance. We therefore completed an additional analysis that followed the procedure used by Mulderink et al. [2002]. We selected five voxels that were statistically significant in both PRE‐BEV and POST‐BEV fMRI scans. The five voxels reported here were selected from the lateral prefrontal cortex, although the results generalize to other brain regions as well. A repeated measures ANOVA compared the within‐subject factor TIME (PRE‐BEV, POST‐BEV) and the between‐subject factor GROUP (caffeine, control). As evident in Figure 3, the results parallel the analysis carried out earlier with all significant voxels. Once again, the results showed that the mean amplitude of the HDR increased from PRE‐BEV (M = 3.45) to POST‐BEV (M = 4.25), resulting in a main effect of TIME, F(1,19) = 7.68, MSe = 0.88, P < .01. Importantly, there was no significant effect of GROUP, F < 1, or a significant interaction between TIME and GROUP, F < 1.
Perfusion Change and BOLD Signal
It is of particular interest to determine whether perfusion change occurred in those voxels that showed significant fMRI BOLD signal activation during WSC. In order to investigate this issue, the activations from each of the two fMRI sections that corresponded to a single perfusion section were combined. The resulting fMRI BOLD activation map from the PRE‐BEV session was then overlaid on the ASL perfusion map from the PRE‐BEV and POST‐BEV sessions separately. Average perfusion was then calculated for active voxels in order to determine whether this measure changed PRE‐BEV to POST‐BEV.
Average perfusion PRE‐BEV and POST‐BEV for voxels that were active during the PRE‐BEV fMRI session were assessed with a mixed‐factorial ANOVA comparing the within‐subjects factor TIME (PRE‐BEV, POST‐BEV) and the between‐subject factor GROUP (caffeine, control). The results are depicted in Figure 1. Both groups showed a decrease in perfusion from PRE‐BEV (M = 165.86, SD = 19.09) to POST‐BEV (M = 154.39, SD = 13.82), indicated by a significant effect of TIME, F(1,19) = 9.44, MSe = 146, P < 0.05. As in the analysis performed on Pave above, there was a significant interaction between TIME and GROUP, F(1,19) = 4.64, MSe = 146, P < 0.05, with no difference between caffeine and control on the PRE‐BEV perfusion measure, but a significant decrease in the caffeine group compared to the control group on the POST‐BEV measure.
Previous research on caffeine‐induced perfusion decrease and BOLD signal increase suggest an inverse correlation between the two measures. A single change measure for perfusion, BOLD signal intensity, and extent of activation was calculated for each subject by subtracting the POST‐BEV measure from the PRE‐BEV measure. A Pearson correlation coefficient calculated between perfusion change and BOLD signal intensity change in the caffeine group indicated no relationship (r = 0.01). Extent of activation change was similarly unrelated to perfusion change (r = −0.05).
T1 relaxation
Because changes in T1 relaxation could result in measured changes of perfusion (as measured by the FAIR technique), T1 parameter maps were compared PRE‐BEV and POST‐BEV in the areas of activation. A mixed factorial ANOVA was used to assess the hypothesis that changes in perfusion would be independent of changes in T1 relaxation, comparing TIME (PRE‐BEV, POST‐BEV) as the within‐subject variable and GROUP (caffeine, control) as the between‐subject variable. There was no significant change in T1 relaxation from PRE‐BEV (M = –388.38, SD = 129.55) to POST‐BEV (M = –383.79, SD = 126.13), F(1,10) < 1. There was no effect of GROUP F(1,10) = 2.27, ns, and no interaction between TIME and GROUP, F(1,10) < 1.
Baseline comparison
To test the hypothesis that caffeine‐induced fMRI signal change is mediated by a change in MRI signal baseline, baseline signal was compared from PRE‐BEV to POST‐BEV using a mixed factorial ANOVA with TIME (PRE‐BEV, POST‐BEV) as the within subject factor and GROUP (caffeine, control) as the between subject factor. The BOLD signal baseline showed a nonsignificant decrease from PRE‐BEV to POST‐BEV, TIME, F(1,19) = 3.22, MSe = 0.13, P = 0.09. There was no effect of GROUP, F < 1, nor was there a significant interaction between TIME and GROUP, F < 1, indicating that caffeine had no effect on MRI signal baseline. A percent change value was calculated for the baseline measure, perfusion, BOLD signal intensity, and extent of activation. There was no significant correlation between baseline and perfusion (r = 0.045, ns); baseline and BOLD signal intensity (r = −0.09, ns); or baseline and extent of activation (r = −0.07, ns).
DISCUSSION
To summarize, the present study replicates prior findings that caffeine results in changes to brain perfusion [Field et al., 2003; Mulderink et al., 2002]. We also found differences in fMRI BOLD signal in response to caffeine, although the specifics of these changes differed substantively from previous studies. Further, we found no support for the hypothesis that change in perfusion is causally linked to caffeine‐related changes in BOLD signal through the modulation of baseline BOLD signal. It is equally plausible that caffeine exerts at least some of its influence on BOLD signal through other well‐established effects, such as increases in sustained attention and increased general arousal. The specific results of the study are discussed below.
In the present study, caffeine resulted in a significant decrease in cerebral perfusion following ingestion of 12 ounces of coffee, as measured by ASL perfusion MRI, replicating numerous previous studies [Mathew et al., 1983; Mathew and Wilson, 1985]. This change in perfusion could not be attributed to changes in other possible confounding variables, such as T1 relaxation rate, or drug expectancy effects, that can have both behavioral and physiological effects [Flaten and Blumenthal, 1999]. Unlike previous research where caffeine resulted in an increase in the amplitude of the HDR, both groups in the current study showed significantly increased signal intensity during the second functional scan, but this increase was no greater for the caffeine group than the control group. Even in a direct replication of Mulderink et al. [2002], we did not see a specific effect of caffeine on BOLD signal amplitude. In contrast to HDR amplitude, however, caffeine resulted in a striking difference between the groups in the extent of activation. While the control group showed a 50% reduction in the number of active voxels across the two functional scans, the caffeine group remained stable over time, with no reduction in the number of active voxels.
The present study produced little evidence for a direct relationship between perfusion change and changes in BOLD activation. Neither the caffeine group nor the control group showed a significant difference in baseline signal over the two functional scans, a finding that is inconsistent with the hypothesis that caffeine acts on the HDR amplitude by decreasing baseline BOLD signal. We also found no evidence for a linear relationship between perfusion change and BOLD signal change, as measured either by the change in HDR amplitude or the number of active voxels across the two functional scans.
Few fMRI studies have assessed the effect of general task practice on fMRI BOLD signal, particularly in cognitive tasks that extend over relatively longer periods of time, as might be used in a typical fMRI experiment. Changes in BOLD signal in response to specific item repetitions, or priming, however, have been well documented [Fletcher et al., 1999; Henson and Rugg, 2003; Schacter and Buckner, 1998]. Most often, repetition of specific stimuli results in decreased fMRI signal, both in extent of activation and the amplitude of activation, although some studies have found increases in signal amplitude, particularly when the first and second presentation of items follows in close proximity [Schnyer et al., 2002]. One priming study using a word stem completion task [Buckner et al., 2000] reported both a specific decrease in signal amplitude when word stems were repeated in blocks, but also an interesting decrease in signal across blocks of new or nonrepeated word stems that was not accompanied by decreases in response times. Buckner et al. [2000] speculated that the change may be due to some general change in attention or effort.
In the present study no word stems were repeated, and thus no decrease in signal due to repetition priming was expected. Nevertheless, controls showed a striking 50% reduction in active voxels over the two functional scans. Therefore, for at least 50% of the voxels the amplitude of BOLD signal decreased below the threshold required for significance. Interestingly, those voxels remaining significant showed a measurable increase in BOLD signal amplitude. In the caffeine group, the same increase in BOLD signal was observed for voxels that remained significant across the two functional scans, but there was no decrease in the number of active voxels, suggesting that signal amplitude for these voxels either remained stable across scans or even increased in order to maintain significance in all or most of the voxels.
One explanation for these results is that the caffeine group showed an attenuation of the general task practice effect that was evident in the control group, due to caffeine's effect on sustained alertness and attention [Brice and Smith, 2001]. This effect is especially evident under suboptimal conditions [Lieberman et al., 2002; Ruijter et al., 2000], and 90 min in an MRI scanner could certainly be considered a suboptimal performance condition. Hypotheses exist regarding the source of stimulus‐specific repetition effects or priming range from decreased visual attention to increased speed of neural processing and a decreased size in neural networks following repetition of specific items [Henson and Rugg, 2003]. Whether or not these mechanisms could also apply to general task practice in the absence of repeated items is not known.
An alternative explanation of the results may be provided by recent animal models describing the coupling of blood flow and neural firing that underlies the BOLD activation signal [Logothetis et al., 2001]. Desimone [1996] has shown that repeated exposure to a stimulus may be accompanied by decreased neuronal firing rate, even when the stimulus is similar but not an exact copy of the original target. It has been suggested that the decreased activations seen in human repetition priming studies may have similar neural underpinnings [Wiggs and Martin, 1998]. Decreases in the size of the neuronal network may be accompanied by a concentration of the delivery of oxygenated blood to remaining active regions, which will result in less extensive activation and possibly a “tuning” of BOLD signal to a smaller, higher signal amplitude region. Clearly, further work needs to be done to tease apart the contribution of general task practice effects and more specific stimulus‐repetition effects on changes in BOLD signal over time.
Although the mechanism remains ambiguous, the results of the present study indicate that caffeine is an important variable to consider in fMRI studies, and may be particularly relevant in studies focusing on priming or practice effects. While some researchers have suggested that caffeine is a possible BOLD contrast booster [Mulderink et al., 2002], the present results suggest that, at least in some situations, caffeine may actually decrease the ability to measure changes in BOLD signal over time.
Acknowledgements
We thank Atsushi Takahashi for the FAIR perfusion code, Gary Glover for the spiral sequence, Rex Newbold for development of the IDL perfusion reconstruction programs, and Jennifer Johnson for word stem completion task stimuli.
Footnotes
The postbeverage perfusion scan in this analysis was taken 35 min after beverage ingestion. In an additional analysis we compared preingestion perfusion measurements to the third perfusion scan, which was taken 15 min postingestion, and before beginning the functional task. This analysis showed the same pattern of results.
REFERENCES
- Brice C, Smith A ( 2001): The effects of caffeine on simulated driving, subjective alertness and sustained attention. Hum Psychopharmacol 16: 523–531. [DOI] [PubMed] [Google Scholar]
- Buckner RL, Petersen SE, Ojemann JG, Miezin FM, Squire LR, Raichle ME ( 1995): Functional anatomical studies of explicit and implicit memory retrieval tasks. J Neurosci 15: 12–29. [DOI] [PMC free article] [PubMed] [Google Scholar]
- Buckner RL, Koutstaal W, Schacter DL, Rosen BR ( 2000): Functional MRI evidence for a role of frontal and inferior temporal cortex in amodal components of priming. Brain 123: 620–640. [DOI] [PubMed] [Google Scholar]
- Cameron OG, Modell JG, Hariharan M ( 1990): Caffeine and human cerebral blood flow: a positron emission tomography study. Life Sci 47: 1141–1146. [DOI] [PubMed] [Google Scholar]
- Cox RW ( 1996): Software for analysis and visualization of functional magnetic resonance neuroimages. Comput Biomed Res 29: 162–173. [DOI] [PubMed] [Google Scholar]
- Dale AM ( 1999): Optimal experimental design for event‐related fMRI. Hum Brain Mapp 8: 109–114. [DOI] [PMC free article] [PubMed] [Google Scholar]
- Desimone R ( 1996): Neural mechanisms for visual memory and their role in attention. Proc Natl Acad Sci U S A 93: 13494–13499. [DOI] [PMC free article] [PubMed] [Google Scholar]
- Field AS, Laurienti PJ, Yen Y, Burdette JH, Moody DM ( 2003): Dietary caffeine consumption and withdrawal: confounding variables in quantitative cerebral perfusion studies? Radiology 227: 129–135. [DOI] [PubMed] [Google Scholar]
- Flaten MA, Blumenthal TD ( 1999): Caffeine‐associated stimuli elicit conditioned responses: an experimental model of the placebo effect. Psychopharmacology (Berl) 145: 105–112. [DOI] [PubMed] [Google Scholar]
- Fletcher P, Buchel C, Josephs O, Friston K, Dolan R ( 1999): Learning‐related neuronal responses in prefrontal cortex studied with functional neuroimaging. Cereb Cortex 9: 168–178. [DOI] [PubMed] [Google Scholar]
- Forster KL, Forster JC ( 2003): DMDX: a windows display program with millisecond accuracy. Behav Res Methods Instrum Comput 35: 116–124. [DOI] [PubMed] [Google Scholar]
- Fredholm BB ( 1995): Astra Award Lecture. Adenosine, adenosine receptors and the actions of caffeine. Pharmacol Toxicol 76: 93–101. [DOI] [PubMed] [Google Scholar]
- Glover GH, Lee AT ( 1995): Motion artifacts in fMRI: comparison of 2DTF with PR and spiral scan methods. Magn Reson Med 33: 624–635. [DOI] [PubMed] [Google Scholar]
- Hasenfratz M, Battig K ( 1992): Action profiles of smoking and caffeine: Stroop effect, EEG, and peripheral physiology. Pharmacol Biochem Behav 42: 155–161. [DOI] [PubMed] [Google Scholar]
- Henson RN ( 2003): Neuroimaging studies of priming. Prog Neurobiol 70: 53–81. [DOI] [PubMed] [Google Scholar]
- Henson RN, Rugg MD ( 2003): Neural response suppression, haemodynamic repetition effects, and behavioural priming. Neuropsychologia 41: 263–270. [DOI] [PubMed] [Google Scholar]
- Institute of Medicine ( 2001): Committee on Military Nutrition Research. Caffeine for the sustainment of mental task performance. Washington: National Academy Press. [Google Scholar]
- Johansson B, Ahlberg S, van der Ploeg I, Brene S, Lindefors N, Persson H, Fredholm BB ( 1993): Effect of long term caffeine treatment on A1 and A2 adenosine receptor binding and on mRNA levels in rat brain. Naunyn Schmied Arch Pharmacol 347: 407–414. [DOI] [PubMed] [Google Scholar]
- Kim SG ( 1995): Quantification of relative cerebral blood flow change by flow‐sensitive alternating inversion recovery (FAIR) techniques: application to functional mapping. Magn Reson Med 34: 293–301. [DOI] [PubMed] [Google Scholar]
- Kwong KK, Belliveau JW, Chesler DA, Goldberg IE, Weisskoff RM, Poncelet BP, Kennedy DN, Hoppel BE, Cohen MS, Turner R, Cheng H, Brady TJ, Rosen BR ( 1992): Dynamic magnetic resonance imaging of human brain activity during primary sensory stimulation. Proc Natl Acad Sci U S A 89: 5675–5679. [DOI] [PMC free article] [PubMed] [Google Scholar]
- Laurienti PJ, Field AJ, Burdette JH, Maldjian JA, Yen Y, Moody DM ( 2002): Dietary caffeine consumption modulates fMRI measures. Neuroimage 17: 751–757. [PubMed] [Google Scholar]
- Lieberman HR, Tharion WJ, Shukitt‐Hale B, Speckman KL, Tulley R ( 2002): Effects of caffeine, sleep loss, and stress on cognitive performance and mood during U.S. Navy SEAL training. Sea‐Air‐Land. Psychopharmacology (Berl) 164: 250–261. [DOI] [PubMed] [Google Scholar]
- Logothetis NK, Pauls J, Augath M, Trinath T, Oeltermann A ( 2001): Neurophysiological investigation of the basis of the fMRI signal. Nature 412: 150–157. [DOI] [PubMed] [Google Scholar]
- Mathew RJ, Wilson WH ( 1985): Caffeine induced changes in cerebral circulation. Stroke 16: 814–817. [DOI] [PubMed] [Google Scholar]
- Mathew RJ, Barr DL, Weinman ML ( 1983): Caffeine and cerebral blood flow. Br J Psychiatry 143: 604–608. [DOI] [PubMed] [Google Scholar]
- McGonigle DJ, Howseman AM, Athwal BS, Friston KJ, Frackowiak RSJ, Holmes AP ( 2000): Variability in fMRI: an examination of intersession differences. Neuroimage 11: 708–734. [DOI] [PubMed] [Google Scholar]
- Mikalsen A, Bertelsen B, Flaten MA ( 2001): Effects of caffeine, caffeine‐associated stimuli, and caffeine‐related information on physiological and psychological arousal. Psychopharmacology (Berl) 157: 373–380. [DOI] [PubMed] [Google Scholar]
- Mitchell SH, Laurent CL, de Wit H ( 1996): Interaction of expectancy and the pharmacological effects of d‐amphetamine: subjective effects and self‐administration. Psychopharmacology (Berl) 125: 371–378. [DOI] [PubMed] [Google Scholar]
- Mulderink A, Gitelman DR, Mesulam MM, Parrish TB ( 2002): On the use of caffeine as a contrast booster for BOLD fMRI studies. Neuroimage 15: 37–44. [DOI] [PubMed] [Google Scholar]
- Nehlig A, Boyet S ( 2000): Dose‐response study of caffeine effects on cerebral functional activity with a specific focus on dependence. Brain Res 858: 71–77. [DOI] [PubMed] [Google Scholar]
- Nehlig A, Daval JL, Debry G ( 1992): Caffeine and the central nervous system: mechanisms of action, biochemical, metabolic and psychostimulant effects. Brain Res Brain Res Rev 17: 139–170. [DOI] [PubMed] [Google Scholar]
- Ojemann JG, Buckner RL, Akbudak E, Snyder AZ, Ollinger JM, McKinstry RC, Rosen BR, Petersen SE, Raichle ME, Conturo TE ( 1998): Functional MRI studies of word‐stem completion: reliability across laboratories and comparison to blood flow imaging with PET. Hum Brain Mapp 6: 203–215. [DOI] [PMC free article] [PubMed] [Google Scholar]
- Palmer ED, Rosen HJ, Ojemann JG, Buckner RL, Kelley WM, Petersen SE ( 2001): An event‐related fMRI study of overt and covert word stem completion. Neuroimage 14: 182–193. [DOI] [PubMed] [Google Scholar]
- Rogers RL, Meyer JS, Judd BW, Mortel KF ( 1985): Abstention from cigarette smoking improves cerebral perfusion among elderly chronic smokers. JAMA 253: 2970–2974. [PubMed] [Google Scholar]
- Ruijter J, Lorist M, Snel J, Ruiter M ( 2000): The influence of caffeine on sustained attention: an ERP study. Pharmacol Biochem Behav 66: 29–37. [DOI] [PubMed] [Google Scholar]
- Schacter DL, Buckner RL ( 1998): Priming and the brain. Neuron 20: 185–195. [DOI] [PubMed] [Google Scholar]
- Schnyer DM, Ryan L, Trouard T, Forster K ( 2002): Masked word repetition results in increased fMRI signal: a framework for understanding signal changes in priming. Neuroreport 13: 281–284. [DOI] [PubMed] [Google Scholar]
- Stark CE, Squire LR ( 2001): When zero is not zero: the problem of ambiguous baseline conditions in fMRI. Proc Natl Acad Sci U S A 98: 12760–12766. [DOI] [PMC free article] [PubMed] [Google Scholar]
- Watson J, Deary I, Kerr D ( 2002): Central and peripheral effects of sustained caffeine use: tolerance is incomplete. Br J Clin Pharmacol 54: 400–406. [DOI] [PMC free article] [PubMed] [Google Scholar]
- Wiggs CL, Martin A ( 1998): Properties and mechanisms of perceptual priming. Curr Opin Neurobiol 8: 227–233. [DOI] [PubMed] [Google Scholar]
- Yen Y‐F, Field AS, Martin EM, Ari N, Burdette JH, Moody DM, Takahashi AM ( 2002): Test‐retest reproducibility of quantitative CBF measurements using FAIR perfusion MRI and acetazolamide challenge. Magn Reson Med 47: 921–928. [DOI] [PubMed] [Google Scholar]