

Abstract
The study describes brain areas involved in medial temporal lobe (mTL) seizures of 12 patients. All patients showed so‐called oro‐alimentary behavior within the first 20 s of clinical seizure manifestation characteristic of mTL seizures. Single photon emission computed tomography (SPECT) images of regional cerebral blood flow (rCBF) were acquired from the patients in ictal and interictal phases and from normal volunteers. Image analysis employed categorical comparisons with statistical parametric mapping and principal component analysis (PCA) to assess functional connectivity. PCA supplemented the findings of the categorical analysis by decomposing the covariance matrix containing images of patients and healthy subjects into distinct component images of independent variance, including areas not identified by the categorical analysis. Two principal components (PCs) discriminated the subject groups: patients with right or left mTL seizures and normal volunteers, indicating distinct neuronal networks implicated by the seizure. Both PCs were correlated with seizure duration, one positively and the other negatively, confirming their physiological significance. The independence of the two PCs yielded a clear clustering of subject groups. The local pattern within the temporal lobe describes critical relay nodes which are the counterpart of oro‐alimentary behavior: (1) right mesial temporal zone and ipsilateral anterior insula in right mTL seizures, and (2) temporal poles on both sides that are densely interconnected by the anterior commissure. Regions remote from the temporal lobe may be related to seizure propagation and include positively and negatively loaded areas. These patterns, the covarying areas of the temporal pole and occipito‐basal visual association cortices, for example, are related to known anatomic paths. Hum Brain Mapp, 2005. © 2005 Wiley‐Liss, Inc.
Keywords: medial temporal lobe seizures; oro‐alimentary behavior; SPECT; categorical analysis; principal component analysis, PCA; functional connectivity
INTRODUCTION
Single photon emission computed tomography (SPECT) using 99mTc ECD has proved a promising method for the study of focal seizures. One procedure combines ictal and interictal data sets and calculates the regional cerebral blood flow (rCBF) increase between them [O'Brien et al., 1998b]. Due to the diversity of semiology—seizure origin and extent of seizure propagation may vary considerably—both within an individual and among individuals, interest focused mainly on the analysis of singular seizures. Furthermore, the pattern observed is strongly influenced by the elapsed time between first seizure signs and application of the radiopharmacon [Kahane et al., 1999]. Hyperperfused regions have been observed as late as the early postictal phase; however, a changing time pattern from early to late ictal scans has to be accounted for [Berkovic, 2000]. These hemodynamic changes are assumed to be caused mainly by enhanced firing rates of neuron populations. Subtraction of interictal from ictal SPECT images has been shown to yield circumscribed clusters of hyperperfusion, consistent with the hypothesized seizure focus [Weder et al., 1996; Zubal et al., 1995]. Coregistration of the SPECT images with high‐resolution magnetic resonance (MR) images facilitates their precise anatomical location. This approach, called subtraction ictal spet coregistered to MRI (SISCOM), has been validated in another study [O'Brien et al., 1998a].
Recently, the subtraction paradigm has been extended by Van Paesschen et al. [2003] to a group analysis of complex partial seizures in patients with hippocampal sclerosis associated with refractory temporal epilepsy. The authors were able to delineate a common pattern of hyper‐ and hypoperfused areas, indicating the epileptic focus in the temporal lobe and propagation of seizure activity to the border zone of ipsilateral middle frontal and precentral gyrus, both occipital lobes and contralateral precentral gyrus. Conversely, large areas of ipsilateral frontal lobe, contralateral posterior cerebellum, and precuneus were functionally depressed. These findings suggested widely distributed, hyperperfused networks activated by the seizure focus within the temporal lobe. From a theoretical point of view, distributed networks elude categorical analysis because subtraction methods are univariate, i.e., image voxels are analyzed independently. The method has several limitations, such as missing regions of a network that do not attain the defined level of significance, or showing activations incidental to the studied phenomenon [Horwitz, 1994]. Instead of evaluating changes in regional activity, covariance analysis determines voxels of the brain that vary together. Principal component analysis (PCA) decomposes the residual matrix into components. Each component corresponds to a distributed system of brain regions that vary together but independently of the other components, indicating functional connectivity. The hypothesis of functional connectivity has been proposed and substantiated in numerous regions‐of‐interest [Alexander and Moeller, 1994] and voxel‐based analyses [Friston et al., 1993; McIntosh et al., 1994; Seitz et al., 2001]. A recent study has performed a PCA of volumes‐of‐interest derived from SPECT images of rCBF in healthy subjects and explored the effects of age and gender [Pagani et al., 2002]. Also, performing a PCA of the normal deviants from mean SPECT images, Houston et al. [1994] were able to differentiate patients with Alzheimer's disease and ischemic infarction from a control group of healthy subjects. By computing a numerical coefficient representing the expression of a principal component (PC) in each image contributing to the residual matrix, PCA permits the comparison of, e.g., patients and controls, subgroups of patients or different conditions using inferential statistics. These comparisons reveal the physiological interpretation of the PC images and the relation to function. Just as important, the coefficient of expression can be computed for images not included in the original set, facilitating prediction and diagnosis.
The aim of the present study is the application of PCA to ictal SPECT data without an a priori assumption and comparison of the findings with the subtraction method. Both methods employ exclusively voxel‐based computation procedures. In order to restrict the study to a particular seizure type, the common criterion for inclusion in the study was oro‐alimentary behavior, i.e., epigastric aura and/or oral automatisms, within the first 20 s of seizure manifestation. This clinical criterion, associated with the term medial temporal lobe (mTL) seizures, was chosen since early oro‐alimentary behavior, comprising epigastric aura and oral automatisms, has been shown to be characteristic of hippocampal temporal lobe seizures, distinguishing them clearly from extrahippocampal temporal lobe seizures [Gil‐Nagel and Risinger, 1997]. Relying on recent data from electrocorticography [Isnard et al., 2000] and cortex stimulation by transopercular electrodes [Ostrowsky et al., 2000], we predict in mTL seizures involvement of critical relay nodes consisting of hippocampus or perihippocampal zone, temporal pole, and anterior insula. From this core zone, functional connectivity to distant areas may be assessed with PCA and compared to known anatomical connections. PCs differentiating among groups are our primary interest.
SUBJECTS AND METHODS
Patients
Twelve patients, seven males and five females, afflicted with drug‐resistant mTL epilepsy, were prospectively included in the study (for detailed summary of patients, see Table I). Their age ranged from 16–54 years. All patients except one were right‐handed according to the Edinburgh inventory handedness test [Oldfield, 1971] and speech dominance in all patients was located in the left hemisphere according to the Wada test.
Table I.
Patient data (N = 12)
| Characteristic | Value |
|---|---|
| Chronic, drug‐resistant mTL epilepsy (n) | 12 |
| Age range (yr) | 16–54 |
| Duration of seizure disease (yr) | 8–48 |
| Interictal EEG, n | 12 |
| Unilateral rt paroxysmal activity | 7 |
| Unilateral lt paroxysmal activity | 2 |
| Predominant rt paroxysmal activity | 1 |
| Predominant lt paroxysmal activity | 1 |
| Bilateral paroxysmal activity | 1 |
| MR images (n) | 12 |
| Mesial temporal sclerosis | 7 |
| Hippocampal atrophy | 4 |
| Tubera at mesial temporal lobe | 1 |
| Prior epilepsy surgery | 1 |
| Epilepsy surgery following evaluation (n) | 9 |
| Selective amygdalo‐hippocampectomy | 7 |
| 2/3 anterior temporal lobectomy | 2 |
| Histological examination | 9 |
| Hippocampal neuronal loss, shrinkage of CA1 and dentate hilus | 8 |
| Tubera at mTL | 1 |
| Course after epilepsy surgery (n = 8)a | 9 |
| Engel Class IA | 7 |
| Engel Class IIAb | 1 |
| Engel Class IIB, after 100% seizure reduction for one year | 1 |
At mean during 2.9 years + 1.4 (SD).
After 100% seizure reduction for one year.
Morphological findings in cerebral MR images were mesial temporal sclerosis as defined by Kuzniecky et al. [1987] (n = 7), hippocampal atrophy as judged by two independent observers (n = 4), tubera at mTL (n = 1), previous anterior two‐thirds resection of one temporal lobe and severe volume loss of the contralateral hippocampus (n = 1), and normal (n = 1). This last patient showed on histological analysis of a biopsy specimen significant gliosis of CA1 hippocampal subregions. Therefore, all patients had either neuropathologically proven features or radiological evidence of significant unilateral hippocampal affection. Neuropathological features included loss of hippocampal pyramidal neurons, gliosis and shrinkage of the CA1 subregion and the dentate hilus (n = 8), and tubera at medial temporal lobe (n = 1). Radiological evidence was given by the typical evidence of atrophy and disruption of the internal hippocampal structure on T 2‐weighted MR images or abnormal signal in the hippocampus on fluid attenuated inversion recovery (FLAIR) sequences, oriented at right angles to the hippocampus (n = 9), a criteria described by Jackson et al. [1993].
In the course of treatment, nine surgical procedures included selective amygdalo‐hippocampectomy (n = 7) and anterior two‐thirds resection of temporal lobe (n = 2). In the mean follow‐up period of 2.9 years, all operated cases showed a beneficial course, with a proportion of 78% (n = 7) remaining in Engel class IA; the others remained free of seizures for 1 year and fell in Engel class IIA and IIB, respectively, after that period [Engel et al., 1993].
Controls
Controls were 13 normal volunteers, seven males and six females, ages 23–55 years. All were right‐handed according to the Edinburgh inventory handedness test [Oldfield, 1971]. None of the subjects suffered from a known neurological or psychiatric illness. Prior to scanning subjects gave written informed consent in accordance with the Declaration of Human Rights (Helsinki, 1975). The study was approved by the Ethics Committee of the University Clinic of Berne.
SPECT Imaging
We measured rCBF using SPECT with the tracer 99mTc ECD (Du Pont Pharmaceuticals, Brussels, Belgium). The scanner room was slightly darkened and the environment quiet. The subjects were placed comfortably on the scanner bed in supine position. The head was fixed in a head holder to avoid movements; positioning of the head with reference to the CA‐CP line was done using a laser system. For injection of the radiotracer, an intravenous access was prepared. The subject was requested to relax. EEG was monitored during the examinations. For normal volunteers and for interictal SPECT, 740–1,000 MBq were injected 10 min after the subject reclined on the scanner bed; he/she was requested to remain relaxed for an additional 5 min. Both interictal and ictal examinations of the patients were part of the presurgical evaluation program for drug‐resistant epilepsies. Interictal SPECT was performed only after a seizure‐free interval of at least 24 h, then ictal SPECT was acquired after cautious reduction of antiepileptic medication.
For ictal SPECT the patients were monitored in the telemetry unit, consisting of a room equipped with one bed for synchronized registration of digital EEG (32 channels, Stellate System, Canada) and video (Glonner System, Germany). The EEG registration included four channels on both sides for recording from electrodes placed at the mTL using the foramen ovale technique [Wieser et al., 1985]. Due to the short half‐life of the tracer, it was prepared every 4 h. The tracer was held in a lead container close to the patient until utilization or replacement. EEG technicians, especially trained in handling radiotracers, educated in recognition of seizure semiology, and familiar with the case history of the patients, were advised to inject the tracer immediately after the first signs of seizures, i.e., within 2˜0 s. The applied dosages were 500–900 MBq of 99mTc ECD.
Image acquisition was performed 60–120 min postinjection using a triple‐head SPECT camera (Prism 3000, Picker International, Bedford Heights, OH) equipped with high‐resolution fan beam collimators (magnification factor 1.0) having a resolution of between 7 and 8 mm FWHM. The data were recorded on a 128 × 128 matrix by a step‐and‐shot mode; 40 steps of 30 s, 3° per step, acquisition time ∼25 min. Postacquisition data processing of the ictal and interictal scans of each subject included iterative reconstruction, which does not utilize pre‐ or postfiltering, and attenuation correction [Chang, 1978]. The method preserved the spatial resolution of 8 mm FWHM. No scatter correction was applied. Images of dimensions 128 × 128 × 64 and voxel sizes 2 × 2 × 1.95 mm3 resulted.
Data Analysis
The SPECT images were mapped into the stereotactic space described by Talairach and Tournoux [1988] using the standard linear affine spatial transformation with 12 parameters implemented in the SPM99 software using Matlab (MathWorks, Sherborn, MA). The dimensions of the resulting images were 79 × 95 × 34 voxels with a voxel size of 2 × 2 × 4 mm3. Visual inspection established the absence of anomalies due to the transformation of ictal and interictal images. The SPM analyses included two types of comparisons. Comparisons between control subjects and patients with right mTL seizures (19° of freedom) involved a two‐sample t‐test after proportional scaling to a common global mean. The resulting voxel maps of t‐statistics were then evaluated for significance according to height and extent thresholds: P < 0.001 uncorrected and eight voxels. Comparison between ictal and interictal states in the eight patients affected on the right mTL (7 df) involved a paired t‐test; the criteria for significance was an uncorrected threshold of P < 0.01 and an extent threshold of 16 voxels. The extent thresholds were chosen to be the mean cluster size of a random t‐distribution with the same degrees of freedom as the comparisons.
The voxel‐based PCA involved the 13 healthy controls and 12 patients in the ictal state. Complementing the categorical comparisons, the analysis relates the brain in the ictal state to the healthy brain of normal volunteers. As described in the Introduction, the first step of the analysis is the computation of the residual matrix: all images of the analysis were merged into a matrix of subjects and voxel values. In order to exclude extracerebral voxels, only those voxels were included for which the values exceeded a fixed proportion of the subject mean: 80% for all subjects. Visual inspection of the mean images used by the PC algorithm as mask verified the validity of the procedure. Due to the size of the SPECT image sets the matrix consisted of few rows (25 images) and many columns (186,156 voxel values). In order to eliminate effects due to global differences among the images, each row was divided by its row mean, implying that the grand mean and each row mean of the transformed matrix were equal to unity.
From this matrix was derived the matrix of residuals by subtracting from each voxel value the mean of the voxel value across subjects. Squaring the matrix of residuals yielded the covariance matrix, a square matrix of dimension 25 × 25. Singular value decomposition of the covariance matrix supplied the proportion of variance described by each component and the coefficients of expression; weighted projection of the expression coefficients on the residual matrix produced 25 PC images. Involving the singular value decomposition of a relatively small matrix and a simple projection onto the larger matrix of residuals, this procedure is efficient and reliable. As mentioned in the Introduction, the expression coefficient indicates the degree to which a component is expressed in an input image. The PC images represent voxels of the brain varying together. The voxel values of the images, i.e., the loads, represent the contribution of the voxel to a component. The component images and expression coefficients are orthonormal, i.e., are uncorrelated and normalized to unity. Display of the PC images and analysis of the expression coefficients used programs adapted from SPM99.
Lacking a validated theory to evaluate statistical significance in PCA, we empirically selected voxels with values exceeding 99.5% of all voxel values in the PC image for the delineation of positively loaded regions and those with less than 0.5% of all voxel values for the delineation of negatively loaded regions. Coordinates of the maximum loads in a region were transformed from the MNI‐space used by SPM to Talairach‐space [Talairach and Tournoux, 1988] using a MatLab script provided online (http://www.mrccbu.cam.ac.uk/Imaging/mnispace.html; Matlab, Natick, MA) [Brett et al., 2002].
RESULTS
Seizure Analysis by EEG Video Monitoring
Seizure manifestation of ictal SPECT examinations is summarized in Table II. All relevant data, including EEG, were stored for nine patients in digitized form, which provided full flexibility in seizure analysis, including detailed offline analysis. In the remaining three patients, videorecording data were available only in analog format. However, the main parameters, i.e., all time relationships between seizure semiology, electroencephalography, and timing of radiopharmacon application, could be determined precisely according to protocol. On average, the radiopharmacon was injected 21 ± 13 s (SD) after the first clinical seizure signs. Offline analysis yielded an average latency of 24 ± 17 s (SD) relying on EEG. This corresponded to the a priori expected delay. As the criterion for inclusion in the study intended, all patients exhibited signs of the so‐called oro‐alimentary behavior within the first 20 s of seizure manifestation. Other signs towards the end of the first manifestation phase were motor automatisms of contralateral hand or versive head and eye movements. Motor automatisms and dystonic motor symptoms persisted or occurred with increased frequency within the next phase; speech arrest ensued in cases involving the left hemisphere. In no case was an experiential aura reported. Finally, as indicated by the occurrence of generalized cloni, three cases ended in a secondary generalized seizure. Mean duration of seizure discharges in EEG and clinical manifestation were 112 ± 143 s (SD) and 102 ± 146 s (SD). Initial seizure activity was recorded at foramen ovale electrodes, in eight patients on the right, in three patients on the left, and in one patient simultaneously on both sides. This served as the primary selection criterion for inclusion into the right and left mTL seizure group and basis for the classification in Table II.
Table II.
Seizure analysis of ictal SPECT examinations (N = 12)
| Semiology | N |
|---|---|
| Phase I: <20 s after first seizure begins | |
| Oro‐alimentary behavior | 12 |
| Viscero‐sensory disturbances | 8 |
| Viscero‐mot. manifestation | 10 |
| Somesthetic disturbances | 3 |
| Motor automatisms of contralateral hand | 3 |
| Versive movements of head and eyes | 1 |
| Phase II: >20 s and <31 s after first seizure begins | |
| Speech arrest | 3 |
| Dystonic extension of upper extremities | 3 |
| Versive movements | 2 |
| Motor automatisms of both hands | 1 |
| Leg movements | 1 |
| Total arrest | 1 |
| Vocalization | 1 |
| Cough | 1 |
| Phase II: 31–62 s after first seizure begins | |
| Secondary generalization | 3 |
| EEG | |
| Fast temporal activity | |
| R temporal origin | 8 |
| L temporal origin | 3 |
| R and L simultaneous origin | 1 |
| SPECT (mean ± SD) | |
| δt radioph. application: clinical ictal activity | 21 ± 13 s |
| δt radioph. application: ictal activity in EEG | 24 ± 17 s |
| Seizure duration (mean ± SD) | |
| Clinical manifestation | 102 ± 146 s |
| Seizure discharge in EEG | 112 ± 143 s |
Neuroimaging Using SPECT
Paired categorical comparison of ictal and interictal stage by SPM99
In the eight right mTL seizures, paired categorical comparison of ictal and interictal stage showed significant rCBF increases within the temporal lobe, involving both medial and lateral areas, and the adjacent anterior insula. Medial areas involved hippocampus, parahippocampal, and fusiform gyrus. Extratemporal rCBF increases were observed in the right occipito‐temporal lobe (i.e., lingual gyrus), in the right pre‐ and postcentral gyrus, in the right postero‐lateral cerebellum, in the left inferior and middle frontal gyrus, in the left insula (Brodmann area 13), in the left inferior parietal lobule, and in the left anterior cerebellum. Subcortically, a significant increase was observed for the right posterolateral thalamus. In contrast, significant rCBF decreases were observed in a large area of the right hemisphere including middle frontal gyrus and anterior cingulate, in the right superior occipital gyrus, and in the posterior cingulate. Furthermore, rCBF declined in small areas of left middle frontal gyrus. The left column of Figure 1 displays the regions of rCBF changes and Table IIIa presents details.
Figure 1.
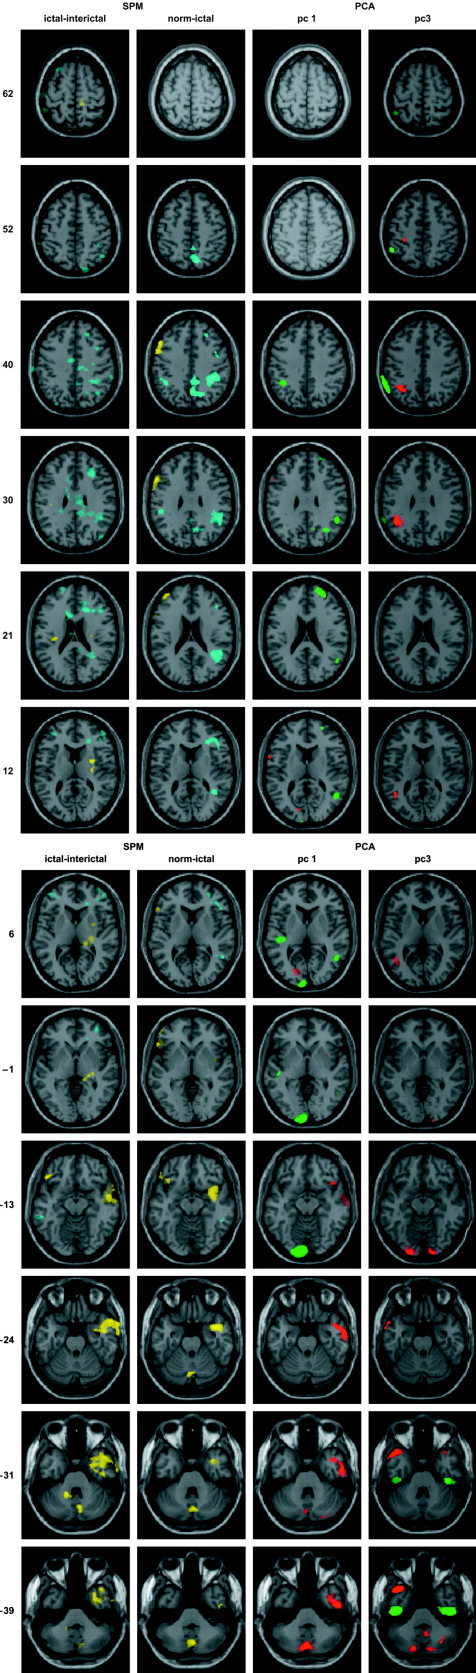
The left column displays representative planes of the statistical parametric maps of the paired comparison of ictal and interictal states in the eight patients affected on the right mTL. Positive t‐values are colored yellow and negative t‐values blue; the intensity threshold corresponds to P < 0.01 and the extent threshold was set to 16 voxels. The second column shows the same planes for the unpaired comparison of eight right mTL patients and the 13 healthy subjects; the color coding and intensity threshold were identical to the paired comparison and the extent threshold was 8 voxels. The third and fourth columns exhibit the corresponding planes of PC1 and PC3, respectively; voxels belonging to the 99.5 percentile of voxel values are colored red, and voxels belonging to the 0.5 percentile green. The selected regions are superimposed on the magnetic resonance (MR) image of the brain of a single subject provided by SPM99. The z‐coordinates indicated on the left refer to the bi‐commissural plane according to Talairach and Tournoux [1988].
Table III.
Significant SPECT perfusion changes
| Anatomic region | Side | Perfusion change | Talairach coordinates (max. t value) | Cluster size |
|---|---|---|---|---|
| Paired comparison of ictal and interictal stage in right mTL seizuresa | ||||
| Inferior temporal gyrus, hippocamp. g. | R | + | 14, −33, 2 | 917 |
| Middle temporal and sup. temp. g. | + | 53, −3, −13 | ||
| Extending to anterior insula | + | 32, 8, −37 | ||
| Temporal lobe, fusiform gyrus | R | + | 46, −15, −26 | 29 |
| Inferior temporal gyrus | L | + | −46, 28, −15 | 39 |
| Insula (BA13) | L | + | −32, −20, 19 | 24 |
| Inferior parietal lobule | + | −38, −22, 27 | ||
| Precentral gyrus, MI | R | + | 20, −24, 64 | 39 |
| Precentral gyrus, MI | L | −26, −28, 60 | 17 | |
| Posterior‐laterial thalamus | R | + | 22, −25, 1 | 69 |
| Claustrum | R | + | 32, −9, 12 | 25 |
| Cerebelloum, post. L., pyramis | R | + | 8, −75, −23 | 55 |
| Cerebellum, ant. L., dentate nc. | L | + | −16, −48, −25 | 45 |
| Anterior cingulate, medial front. G. extending to middle front g. | R | – | 18, 28, 17 | 493 |
| Anterior cingulate | L | – | −16, 28, 24 | 97 |
| Superior frontal gyrus (BA 10) | L | – | −18, 59, 15 | 22 |
| Middle temporal gyrus | R | – | 46, −72, 29 | 53 |
| Posterior cingulate extending to inferior parietal lobule | R | – | 8, −40, 24 | 695 |
| Cerebellum, post. L. lobule | L | – | −46, −66, −40 | 23 |
| Unpaired comparison of ictal data in right mTL seizures (n = 8) and normal volunteers (n = 13)b | ||||
| Ictal data, normal volunteers | ||||
| Inferior temporal gyrus (including BA 20) | R | + | 48, −11, −33 | 12 |
| 40, −4, −37 | ||||
| Superior temporal gyrus | R | + | 38, 5, −20 | 372 |
| 40, 11, −14 | ||||
| Inferior frontal gyrus | L | + | −57, 13, 29 | 195 |
| Including BA 45 | + | −53, 25, 2 | 131 | |
| −51, 29, −8 | ||||
| −38, 23, −11 | ||||
| Middle frontal gyrus | L | + | −53, 19, 23 | 46 |
| −48, 6, 40 | ||||
| Including BA 46 | −40, 49, 16 | |||
| Lingual gyrus (including BA 19) | R | + | 16, −66, −3 | 18 |
| Cerebellum, post. Lobe., uvula | R | 4, −71, −27 | .372 | |
| Declive of vermis | L | 2, −69, −17 | ||
| Cerebellum, post. Lobe, declive | R | −14, −65, −14 | ||
| Normal volunteers: ictal data | ||||
| Superior temporal gyrus | R | – | 51, −52, 10 | 12 |
| 50, −43, −5 | 9 | |||
| Middle frontal gyrus | R | – | 40, 10, 40 | 40 |
| Precentral gyrus (including BA6) | – | 46, 0, 33 | ||
| Middle frontal gyrus (including BA46) | R | – | 26, 33, 35 | 12 |
| Middle frontal gyrus (including BA10) | R | – | 28, 51, 5 | 10 |
| Inferior frontal gyrus | R | – | 50, 27, 6 | 90 |
| 42, 35, 9 | ||||
| 32, 33, 9 | ||||
| Superior frontal gyrus | L | – | −16, 24, 54 | 10 |
| Inferior parietal lobule (including BA40) | R | – | 38, −37, 39 | 609 |
| 46, −45, 24 | ||||
| 42, −31, 35 | ||||
| Precuneus (including BA40) | R | – | 16, −62, 40 | 471 |
| 8, −63, 51 | ||||
| 4, −58, 40 | ||||
| Inferior parietal lobule | L | – | −48, −31, 31 | 74 |
| −42, −43, 39 |
Seven degrees of freedom, uncorrected threshold of P < 0.01; extent threshold of 16 voxels.
Nineteen degrees of freedom, uncorrected threshold of P < 0.001; extent threshold of 8 voxels.
Unpaired categorical comparison of ictal stage and normal volunteers by SPM99
Intended as basis for comparison with the PCA, an unpaired t‐test comparing the eight patients with right mTL seizures in ictal stage with normal volunteers was made. As the second column of Figure 1 indicates, a pattern similar to that described above was seen. However, perfusion increases more clearly involved left frontal and decreases right frontal areas. Table IIIb presents details.
PCA of Ictal Stage and Normal Volunteers
According to the expression coefficients, two principal components, PC1 and PC3, representing the dominant and third‐largest proportion of the variance, differentiated between healthy subjects and patients according to a two‐tailed t‐test (P < 0.005). These two components constitute 7.7% and 6.5% of the total variance, respectively. The third and fourth columns of Figure 1 display the corresponding component images and Table IV presents details of the patterns. The scatterplot of expression coefficients shown in Figure 2 clearly distinguishes among healthy subjects and patients with right and left mTL seizures.
Table IV.
Principal component analysis, PCA, of ictal SPECT data
| Anatomic region | Side max. load* (E‐4) | Talairach coordinates (max. load) | Cluster size | |
|---|---|---|---|---|
| PC1 | ||||
| Inferior temp. g | R | 114 | 50, −9, −33 | 490 |
| Hippocampal g., (incl. BA20,21) | 64, −9, −16 | |||
| Sup. temp. g., ant. insula, | R | 81 | 46, 19, −11 | 21 |
| Inf. front. g., (incl. BA13) | 78 | 34, 8, −4 | ||
| Middle front. g. | L | 77 | −51, 21, 28 | 3 |
| Precentral g. | L | 75 | −61, 6, 11 | 6 |
| Occ. lobe, cuneus, (incl. BA17) | L | 84 | −16, −77, 11 | 30 |
| Caudate nc. | L | 73 | −14, 22, 6 | 1 |
| Cerebellum, post. 1., | R | 93 | 34, −64, −41 | 41 |
| Semi‐lunar lobule, tonsil | 74 | 44, −60, −37 | ||
| Cerebellum, post. 1., | R | 94 | 14, −64, −41 | 25 |
| Semi‐lunar lobule | ||||
| Cerebellum, post. 1., | R | 75 | 30, −83, −23 | 7 |
| Uvula, Tuber | ||||
| Cerebellum, post. 1., | L | 99 | 0, −73, −30 | 254 |
| Semi‐lunar lobule, vermis | −8, −79, −30 | |||
| Sup. temp. g., (incl. BA22) | R | −86 | 50, −56, 14 | 132 |
| Inf. parietal lobule | −76 | 51, −45, 28 | ||
| Sup. temporal g. | L | −82 | −44, −25, 5 | 71 |
| Middle front. g. | R | −80 | 26, 55, 12 | 123 |
| Sup. front. g., (incl. BA6) | R | −71 | 18, 24, 54 | 3 |
| Parietal 1., angular g., | R | −74 | 32, −61, 33 | 31 |
| Occ. 1., precuneus | −66 | 14, −61, 29 | ||
| Inf. parietal lobule | L | −75 | −40, −43, 39 | 30 |
| Parietal 1., angular g. | L | −66 | −40, −64, 33 | 1 |
| Occ. 1., lingual g., (incl. BA17) | L | −128 | −8, −95, −2 | 498 |
| PC3 | ||||
| Sup. temp. g., (incl. BA38) | R | 64 | 36, 20, −28 | 9 |
| Inf. temp. g. | R | 64 | 63, −5, −17 | 4 |
| Sup., middle temp. g., (incl. BA38,21) | L | 93 | −44, 18, −31 | 234 |
| −55, 10, −24 | ||||
| Middle, sup. temp. g | L | 68 | −42, −62, 10 | 241 |
| Supramarg. g. | 86 | −40, −47, 32 | ||
| Occ. Lobe, inf. occ. g., | R/L | 53 | 14, −92, −9 | 161 |
| Cuneus | 75 | −18, −92, −9 | ||
| Postcentral g., (incl. BA3) | L | 68 | −30, −32, 50 | 8 |
| Cerebellum, post. 1. | R | 95 | 6, −54, −34 | 64 |
| Tonsil | ||||
| Cerebellum, post. 1., | L | 79 | −16, −79, −33 | 65 |
| Pyramis | ||||
| Basal temp. 1., | R | −121 | 48, −17, −33 | 388 |
| Inf. temp. g. (Parahippocamp. g.) | ||||
| Basal temp. 1., | L | −129 | −44, −17, −33 | 252 |
| Inf. temp. g. (Parahippocamp. g.) | ||||
| Inferior parietal 1., (incl. BA40) | R | −79 | 61, −39, 42 | 6 |
| Inferior parietal 1., (incl. BA40) | L | −103 | −59, −47, 39 | 227 |
| Cerebellum, post. 1. | R | −82 | 24, −66, −40 | 4 |
Group differentiating principal components: Patients vs. normal volunteers by P < 0.005.
Max. Load = greatest voxel value within a cluster, representing the contribution to a defined PC.
Figure 2.
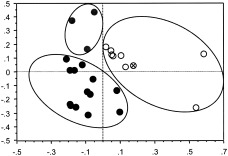
Classification of individuals with right mTL seizures (empty dots), individuals with left mTL seizures (gray dots), and healthy subjects (black dots) into circumscribed, nonintersecting clusters by the expression coefficients of PC1 and PC3. One individual with simultaneous onset of seizure discharge in right and left foramen ovale electrodes is located in the right mTL seizure cluster (highlighted by the sign ×).
Table V presents a summary of the first 14 PCs. The decrease of proportion of variance with PC shows no obvious discontinuity that could serve as a basis for discarding PCs from analysis, as is often done in PCA. However, both the number of clusters and the maximum cluster size do evidence discontinuities for PCs higher than PC12. The number of clusters increases and the maximum cluster size decreases markedly, suggesting the onset of noise and plausible criteria for selecting PCs to be analyzed.
Table V.
Data structure of the first 14 principal components
| PC | Variance (%) | Subject weight controls, mean (SD) | Subject weight patients, mean (SD) | t‐test (Controls vs. Patients) | Null hypothesis (P) | Max. load | Max. cluster size | Clusters (n)* |
|---|---|---|---|---|---|---|---|---|
| 1 | 7.7 | −0.106 (0.099) | 0.114 (0.230) | 3.149 | 0.0045 | 0.0128 | 498 | 22 |
| 2 | 7.2 | −0.008 (0.061) | 0.008 (0.294) | −0.195 | 0.8472 | 0.0133 | 796 | 16 |
| 3 | 6.5 | −0.128 (0.139) | 0.138 (0.173) | 4.26 | 0.0003 | 0.0129 | 388 | 20 |
| 4 | 5.9 | −0.026 (0.109) | 0.028 (0.276) | −0.643 | 0.5268 | 0.0129 | 522 | 34 |
| 5 | 5.5 | −0.052 (0.176) | 0.057 (0.225) | −1.355 | 0.1886 | 0.0139 | 465 | 29 |
| 6 | 5.2 | 0.025 (0.152) | −0.027 (0.025) | 0.631 | 0.5342 | 0.0142 | 722 | 15 |
| 7 | 5.1 | 0.005 (0.180) | −0.006 (0.235) | 0.130 | 0.8977 | 0.0105 | 478 | 38 |
| 8 | 4.8 | 0.035 (0.161) | −0.038 (0.245) | 0.883 | 0.3862 | 0.0121 | 809 | 16 |
| 9 | 4.4 | 0.014 (0.237) | −0.015 (0.170) | 0.350 | 0.7293 | 0.0132 | 686 | 31 |
| 10 | 4.2 | 0.019 (0.209) | −0.021 (0.206) | 0.484 | 0.6329 | 0.0135 | 505 | 27 |
| 11 | 3.9 | 0.005 (0.162) | −0.005 (0.249) | 0.114 | 0.9099 | 0.0127 | 292 | 32 |
| 12 | 3.7 | 0.026 (0.253) | −0.029 (0.140) | 0.662 | 0.5148 | 0.0150 | 811 | 19 |
| 13 | 3.6 | 0.024 (0.229) | −0.026 (0.180) | 0.601 | 0.5536 | 0.0107 | 325 | 54 |
| 14 | 3.5 | −0.007 (0.255) | 0.008 (0.142) | −0.176 | 0.8621 | 0.0122 | 329 | 55 |
Σ(PC1–PC14) = 71.3.
Clusters composed of voxels exceeding 99.5% or less than 0.5% of all voxel values in the PC.
PC, principal component.
A single patient determined PC2, constituting 7.2% of the variance. The expression coefficient of the patient in PC2 was 0.92; the expression coefficients of the patient in the other PCs were unexceptional. The individual had undergone a previous anterior temporal lobe resection of one side and continued to have seizures originating from the nonoperated right side. The pattern showed extensive positively loaded involvement of right temporal lobe, comparable to PC1 and including hippocampus, but leaving free the mesial and anterior pole of left temporal lobe. PC4 exhibited gender differences in temporo‐limbic and frontal brain volumes, characterized by positive loading of the orbito‐frontal cortex in women (P < 0.05, two‐tailed t‐test), which may be related to gender differences in emotion processing [Gur et al., 2002]. Neither the patients nor the healthy subjects evidenced effects of age in the analysis.
In the following, we confine the analysis and discussion to our primary interest: the two components, PC1 and PC3, discriminating between patients and healthy subjects and correlated with seizure activity. In a representation of the respective expression coefficients as the 2‐D graph shown in Figure 2, normal volunteers and patients with right and those with left mTL seizures appear in three disjoint clusters. The ellipses follow from applying a minimal distance criterion to the center of gravity of each group. This segregation of the study population into clusters determined by PC1 and 3 is an important finding, but the data are insufficient to construct the 2D confidence regions that would provide statistical reliability. The cluster of right mTL seizures includes the patient with simultaneous onset of ictal activity at right and left foramen ovale electrodes, suggesting that this patient expressed the same networks as the right mTL seizure group. As evident in Figure 2, PC1 was expressed differentially in right and left mTL seizures, in contrast to PC3. The PC images of the first component show clear unilateral involvement of right mTL, corresponding to seizure origin as signified by the ictal EEG data in most patients. Concerning the temporal lobe, PC images of the third component showed rather a bilateral pattern, with positively loaded involvement of the temporal pole and a large negatively loaded area at inferior temporal gyrus.
For the right mTL seizure group, a positive linear correlation could be demonstrated between the expression coefficients of PC1 and the natural logarithm of seizure duration [ln(duration of seizure discharge in EEG) = 3.6 + 3.4*PC1; r = 0.75, P <0.02], indicating an exponential relationship. Conversely, a negative linear correlation could be demonstrated for the same group between expression coefficients of PC3 and the natural logarithm of seizure duration [ln(duration of seizure discharge in EEG) = 4.8 − 6.5*PC3; r = 0.81, P <0.01]. Thus, the statistically independent expression coefficients of PC1 and PC3 appear related to seizure duration, the former reflecting a positive and the latter a negative effect. After adjusting the signs according to the observed correlations, we tested this hypothesis further by incorporating both sets of expression coefficients into one regression equation: ln(duration of seizure discharge in EEG) = 4.3 + 1.8*PC1 − 4.5*PC3. The equation is insensitive to the extreme points and outliers; the adjusted coefficient of determination is very high and deleting the outliers yields an increase of adjusted multiple r2 from 0.7 to 0.885 (P < 0.000). Analysis of this regression equation, i.e., without outliers forquality control, is shown in the footnote1 and represented by the plane in Figure 3; it indicates that the seizure duration is more sensitive to the negative effects of PC3 than the positive effects of PC1.
Figure 3.
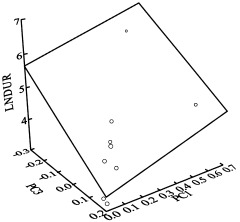
The eight patients presenting right mTL seizures show both a positive linear correlation between the expression coefficients and the natural logarithm of seizure duration as defined by EEG for PC1 and a negative correlation between these two parameters for PC3. In the 3D space determined by the two sets of expression coefficients and the seizure duration, the pairs of expression coefficients are located in a common regression plane (adjusted multiple r2 of 0.885 after deleting two outliers, P < 0.000). The slopes given by intersection of the regression plane with the PC1‐seizure duration and PC3‐seizure duration planes indicates that the seizure duration depends more strongly on the expression coefficients of PC3 than on those of PC1. Note: The two points outside of the plane have been identified as outliers.
PC1 (Table IV, Figs. 1, 4A–C) showed extensive, positively loaded involvement of right temporal lobe, including hippocampus and parahippocampal gyrus, extending to the anterior two‐thirds of the insular cortex. In addition to the temporal lobe, positively loaded areas included right inferior frontal gyrus, small parts of mesial and left middle frontal gyrus, right claustrum, left cuneus, posterior cerebellum on both sides, right anterior cerebellum, and left caudate nucleus at the subcortical level. Negatively loaded main foci were within the right posterior part of superior temporal gyrus and in the heteromodal association cortices of right middle frontal gyrus, right superior frontal gyrus, right inferior parietal lobule, right angular gyrus, right precuneus, and left occipital lobe, including lingual gyrus.
Figure 4.
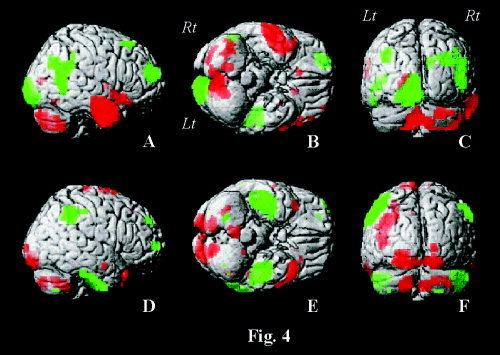
Renderings of PC1 (A–C) and PC3 (D–F) on right lateral (A,D), basal (B,E), and posterior views (C,F) of the single subject T 1‐reference brain of SPM99. Shown are voxels with values exceeding 99.5% of all voxel values for the delineation of positively loaded regions (red), and those with less than 0.5% of all voxel values for the delineation of negatively loaded regions (green).
PC3 (Table IV, Figs. 1, 4D–F) exhibited a bilateral pattern in the temporal lobes with positively loaded zones in the middle and superior temporal gyrus, including the temporal pole, and negatively loaded zones in the inferior temporal gyrus. Note the marked negatively loaded zone at the basal aspect of temporal lobe of both sides in Figure 4E, extending medially and involving parahippocampal and probably dentate gyrus. Besides the temporal lobe, positively loaded zones were located in the left supramarginal gyrus and bilaterally in the visual association cortices, including lingual gyrus, and posterior cerebellum; negatively loaded zones were observed mainly in the right middle and superior frontal gyrus and in the inferior parietal lobe on both sides.
DISCUSSION
PCA of 12 patients exhibiting oro‐alimentary behavior during the initial phase of mTL seizures demonstrates characteristic patterns of covarying regions distinguishing patients from healthy subjects. It complements three published studies [Chang et al., 2002; Lee et al., 2000; Van Paesschen et al., 2003] which applied categorical analysis using statistical parametric mapping in patient groups with mesial temporal lobe epilepsy. In the published studies, patient selection criteria were mainly morphological criteria of hippocampal sclerosis or post‐hoc beneficial response to epilepsy surgery. Lee et al. [2000] and Chang et al. [2002] were primarily interested in the validation of categorical analysis using SPM in comparison to conventional localization of the primary focus by the ictal–interictal subtraction method. In addition, Van Paesschen et al. [2003] showed the associated remote cortical involvement and evaluated pairwise connectivity of the remote regions to the primary focus by calculating Pearson correlation coefficients. In contrast, we have deliberately chosen a common seizure semiology during the SPECT examination for patient selection. The selection of a homogenous patient population exhibiting a distinct seizure manifestation provided the basis for a multivariate voxel‐based covariance analysis without a priori assumptions. The PCA demonstrated cortical interrelations during the ictal stage suggesting distributed functional connectivity related to the observed semiology: (1) locally within the right temporal lobe and the adjacent anterior insula, and (2) between primary seizure focus and remote cortical and subcortical areas. The power of PCA to discriminate among groups serves to uniquely characterize the patterns for the studied seizure type.
Temporal Lobe and Insular Cortex
The main finding within the temporal lobe is the assignment of the medial temporal lobe and temporal pole to different PCs despite their dense interconnection through reciprocal innervation [Mesulam and Mufson, 1982a, b; Penfield and Faulk, 1955]. The appearance of the anterior insula is also significant because of its particular interconnection with amygdalo‐hippocampal structures. The lateralization of PC1 on the right side reflects the predominance of right‐sided mTL seizures in our study group. In a recent analysis of the role of the insular cortex in temporal lobe epilepsy, Isnard et al. [2000] found that seizure activity invaded the insular cortex in all temporal lobe epilepsy patients studied with chronic depth stereotactic recordings. Furthermore, they were unable to differentiate between symptoms evoked by insular discharges and those attributed to the medial temporal area. This phenomenon was investigated further by Ostrowsky et al. [2000] using intracortical stimulation of the insula during stereo‐electroencephalography. Providing functional mapping of this zone, the method indicated a clear topographic specificity within the insular cortex featuring an anterior–posterior gradient of viscero‐sensitive, viscero‐motor, and somaesthetic sensations, respectively. The former indications mimic mTL seizure symptomatology. Thus, definite segregation of visceral and somaesthetic pathways may take place between anterior and posterior insula. Similarly, mTL analog seizures may proceed in rare cases from the temporal pole [Coste et al., 2002; Kahane et al., 2002]. Intracortical stimulation of the anteromedial part of the temporopolar cortex evoked also symptoms of “temporo‐limbic” epilepsies, i.e., viscero‐sensitive and viscero‐motor responses [Ostrowsky et al., 2002]. Thus, the medial temporal area, anterior insula and temporal pole, as delineated by positive loads in PC1 and 3, respectively, may all represent critical relay nodes for seizures characterized by oro‐alimentary behavior and constitute the core zone of this seizure type [Weder et al., 2001]. Exceptional cases of seizure origin in the anterior insula and temporal pole, with the potentially misleading manifestation of mTL seizures, may be of practical importance and explain the persistence of seizures after selective amygdalo‐hippocampectomy.
The temporal pole and the hippocampal gyrus are parts of the associative limbic or paralimbic cortex [Moran et al., 1987] and connected by the anterior commissure to the homotopical contralateral area [Chabardes et al., 2002]. This relation explains the observed bilateral pattern of PC3 and reflects the underlying interhemispheric pathway, i.e., effective connectivity. Considering the patients' expression coefficients, we observe that the left mTL seizures as well as the right mTL seizures contributed to this pattern, indicating a bilateral network. Also within the paralimbic system was involvement of a circumscribed area at the border between anterior cingulate and medial frontal cortex. A special element of the paralimbic system, the insula–orbital–temporal complex, projects from the temporal pole cortex to insular cortex, i.e., to the long anterior and posterior gyrus of the insula [Augustine, 1996; Eberstaller, 1887; Mesulam and Mufson, 1982a].
The negatively loaded parahippocampal gyrus in the PC3 image, extending bilaterally from the basis of temporal lobe medially and probably including the dentate gyrus, is known to show suppressed metabolism in interictal PET studies of fluorodeoxyglucose [Foldvary et al., 1999; Vielhaber et al., 2003]. The implication of the dentate gyrus in the inhibition of seizures is substantiated by studies of rodents and humans. In a mouse model, upregulation of GABA(A)‐receptors within the dentate gyrus was a compensatory response to seizures [Fritschy et al., 1999]. In a rat model for temporal lobe epilepsy, reduced granule cell inhibition within the dentate gyrus preceded recurrent seizures by days or weeks [Kobayashi and Buckmaster, 2003]. In surgical hippocampal specimens obtained from patients with TLE, upregulation of the glutamate receptor mGluR4 found especially in the dentate gyrus may counteract hippocampal seizure activity [Lie et al., 2000]. Considering the negative sign of the load and the inverse relation between seizure duration and expression coefficients for PC3 suggests that this negatively loaded region, especially the dentate gyrus, is likely to fail in counteracting, and thus in limiting the seizures.
PC1 and Extratemporal Covarying Regions
A relatively large, positively loaded area was observed in the left cuneus and a large, negatively loaded area in the left lateral and basal visual association cortex, i.e., the lingual and fusiform gyri, including the striate cortex. The involved visual association cortices lie at one end of the occipito‐temporal connections supplied by inferior longitudinal fasciculus, which has been studied recently in vivo by diffusion tensor MR‐imaging [Catani et al., 2003]. This study was able to discriminate this pathway from the optic radiation and the U‐shaped fibers connecting adjacent gyri and forming a chain of indirect projections between occipital and temporal lobes [Tusa and Ungerleider, 1985]. Several points deserve attention: (1) The clear asymmetric involvement of the occipital lobe may be caused by partial deafferentiation of the right side of the medial temporal area due to morphological lesions in most patients (Table I). However, deafferentiation may be transient and induced by local edema during seizure discharge. (2) Regions of positive and negative loads in the visual association areas probably correspond to different branches within the fascicle, i.e., a cuneate and a lingual branch. (3) Involvement of the primary visual cortex may be due to local U‐shaped gyral connections, since direct fiber projections from anterior temporal lobe spare this area in most anatomical studies of nonhuman primates [Kuypers et al., 1965; Tusa and Ungerleider, 1985] as in the work of Catani et al. [2003].
Paired categorical comparison of ictal and interictal stages identified large areas within the right prefrontal cortex and parietal lobe on both sides undergoing significant rCBF decreases. Involvement delineated by PCA was much more restricted and confined to the right superior (Brodmann area, BA6) and middle frontal gyrus (BA9,10) and to the inferior parietal lobe on both sides. Similar rCBF decreases have also been observed by others and explained by several mechanisms [Van Paesschen et al., 2003], i.e.: (i) a vascular steal phenomenon [Rabinowicz et al., 1997]; (ii) the interruption of cognitive processes during the interictal stage [Fuster, 2001]; and (iii) a surrounding inhibition around the epileptogenic focus [Prince and Wilder, 1967]. However, the much more restricted zone found with PCA might rather reflect neuronal interaction or modulation, respectively. Similar interactions between the medial temporal lobe and prefrontal cortex could be observed in animal experiments on rats [Maroun and Richter‐Levin, 2003]. For example, Takita et al. [1999] induced a persistent depression within the medial, i.e., prelimbic, frontal cortex following repetitive stimulation of ventral hippocampus. Interaction has been shown also to take place between the hippocampus and associative parietal cortex during visuospatial and self‐motion processing [Save and Poucet, 2000].
In a detailed study of temporal lobe epilepsy by Shin et al. [2001] using SISCOM, hyperperfusion of both vermis and cerebellar hemispheres were found on both sides, ipsilateral and contralateral, of the putative epileptogenic focus. Lateralization is usually associated with additional involvement of the frontal lobe and related to the extensive efferent projections from this lobe onto contralateral anterior cerebellar hemispheres [Dietrichs, 1985; Takeuchi et al., 1982].
Maximal rCBF increase in the right mTL seizure group has been shown for the vermis unilaterally. However, covariance analysis indicated interactions of vermian structures and posterior cerebellar hemisphere ipsilateral to the right temporal lobe core zone of PC1, i.e., semilunar lobe. This is consistent with sparse but predominant ipsilateral projections to the cerebellum from the medial temporal lobe [Dietrichs, 1985; Heath and Harper, 1974; Snider and Maiti, 1976; Takeuchi et al., 1982] and early observations of lower cerebellar metabolism in the hemisphere ipsilateral to the temporal lobe of seizure origin [Theodore et al., 1987].
PC3 and Extratemporal Covarying Regions
The third PC image indicates a dense connection to visual association fields characterized by a symmetrical pattern and sparing the primary visual cortex. As stated above, this pattern fits well the theory of a direct path connecting anterior temporal and visual association areas [Catani et al., 2003]. Moreover, the implication of the occipital lobe would have been overlooked in an exclusively categorical analysis of flow differences, an example of Horwitz's criticism of the subtraction method [Horwitz, 1994]. The appearance of the right and left inferior parietal lobes, both with negative loads, may signal interaction with paralimbic associative fields in the parahippocampal gyrus [Divac et al., 1977; Mesulam et al., 1977].
Within cerebellar hemispheres, the posterior and paramedian fields covaried bilaterally in this PC image. Thus, the pattern provides a differentiated view of cerebellar involvement during a seizure in two PCs, in contrast to observations of varying cerebellar rCBF increases deduced using the subtraction method [Duncan et al., 1987; Marks et al., 1992; Shin et al., 2001]. A role of the cerebellum in inhibiting seizure is suggested by the observation that cerebellar atrophy, and the associated loss of inhibitory activity, may negatively affect prognosis for surgical treatment of drug resistant temporal lobe epilepsy [Specht et al., 1997]. Moreover, animal studies [Paz et al., 1985] and stimulation of the anterior cerebellum in humans [Cooper, 1973; Davis and Emmonds, 1992] indicate that the palaeocerebellum may inhibit seizure activity.
CONCLUSIONS
PCA yielded two patterns of cortical and subcortical interaction during mTL seizures which distinguish patients from normal volunteers [Andersson et al., 1998; Seitz et al., 2001]. In contrast to the categorical analysis using the subtraction paradigm, PCA permitted a differentiated survey of both temporal lobe and extratemporal areas including (1) decomposition and attribution to different PCs of activation regions leading to results concerning the temporal lobe and paramedian zone of the cerebellum; (2) demonstration of covarying regions in both PCs which did not achieve significance in categorical analysis using statistical parametric mapping, e.g., the visual association cortices in PC3; and (3) more precise delineation of covarying areas compared to the subtraction paradigm, e.g., the restricted negatively loaded areas of right middle frontal gyrus belonging to PC1 compared to an extensive flow decrease in frontal lobe observed using SPM.
The possibility furnished by PCA of relating expression coefficients to external measures [Seitz et al., 2001] is essential to establishing the physiological significance of the PCs. Thus, the expression coefficients associated with both PC1 and PC3 correlate highly with seizure duration. Concerning the signs of the correlation coefficients, we conjecture that PC1 comprises brain areas within the temporal lobe that sustain seizure duration, while the regions of PC3 limit the duration. The 3‐D regression analysis of seizure duration in terms of the expression coefficients of PC1 and PC3 suggests that the inhibition mechanisms associated with PC3 may outweigh the sustaining mechanisms associated with PC1. Considering the negative sign of the load and the inverse relation between seizure duration and subjects weight for PC3 suggests that areas involved at the basis of temporal lobe, mainly dentate gyrus, are likely to fail in counteracting, and thus, in limiting the seizures. The interplay of the two PCs may help to understand seizure semiology in ambiguous cases when symptoms evolve only after propagation from a primary focus.
Summarizing, without a priori assumptions, PCA provides two patterns found in ictal rCBF images that describe cortical and subcortical brain interactions during mTL seizures. Many aspects of the functional connectivity indicated by the analysis of covarying regions are in excellent agreement with recent findings regarding effective connectivity demonstrated recently in tensor fused MR‐images [Catani et al., 2003]. Structural equation modeling or path analysis offers a procedure for refining the analysis of effective connectivity [Friston, 1994; McIntosh et al., 1996; McIntosh and Gonzalez‐Lima, 1994]. Its application is a compelling future activity.
Acknowledgements
We thank Professor H.G. Wieser (Neurological Department of University Hospital, Zurich) for careful reading of the article. We also thank Professor A. Keel (Institute for Statistics and Mathematics, University of St. Gallen) for help in statistical analysis of the data.
Footnotes
|
Table A1. Two sets of expression coefficients incorporated into one regresion equation
| |||||
|---|---|---|---|---|---|
| Effect | Coefficient | Std Error | Std Coeff | t | P (2‐tail) |
| Constant | 4.23 | 0.25 | 0.00 | 17.06 | 0.000 |
| PC 1 | 1.92 | 0.73 | 0.45 | 2.63 | 0.060 |
| PC 3 | −4.20 | 1.13 | −0.63 | −3.73 | 0.020 |
REFERENCES
- Alexander GE, Moeller JR (1994): Application of the subprofile model to functional imaging in neuropsychiatric disorders: a principal component approach to modeling brain function in disease. Hum Brain Mapp 2: 79–94. [Google Scholar]
- Andersson JL, Onoe H, Hetta J, Lidstrom K, Valind S, Lilja A, Sundin A, Fasth KJ, Westerberg G, Broman JE, Watanabe Y, Langstrom B (1998): Brain networks affected by synchronized sleep visualized by positron emission tomography. J Cereb Blood Flow Metab 18: 701–715. [DOI] [PubMed] [Google Scholar]
- Augustine JR (1996): Circuitry and functional aspects of the insular lobe in primates including humans. Brain Res Rev 22: 229–244. [DOI] [PubMed] [Google Scholar]
- Berkovic SF (2000): SPECT: neurobiology of periictal blood flow alterations. Adv Neurol 83: 33–39. [PubMed] [Google Scholar]
- Brett M, Johnsrude IS, Owen AM (2002): The problem of functional localization in the human brain. Nat Rev Neurosci 3: 243–249. [DOI] [PubMed] [Google Scholar]
- Catani M, Jones DK, Donato R, Ffytche DH (2003): Occipito‐temporal connections in the human brain. Brain 126: 2093–2107. [DOI] [PubMed] [Google Scholar]
- Chabardes S, Kahane P, Minotti L, Hoffmann D, Benabid AL (2002): Anatomy of the temporal pole region. Epileptic Disord 4(Suppl 1): S9–15. [PubMed] [Google Scholar]
- Chang L‐T (1978): A method for attenuation correction in radionuclide computed tomography. IEEE Trans Nucl Sci 25: 638–643. [Google Scholar]
- Chang DJ, Zubal IG, Gottschalk C, Necochea A, Stokking R, Studholme C, Corsi M, Slawski J, Spencer SS, Blumenfeld H (2002): Comparison of statistical parametric mapping and SPECT difference imaging in patients with temporal lobe epilepsy. Epilepsia 43: 68–74. [DOI] [PubMed] [Google Scholar]
- Cooper IS (1973): Effect of chronic stimulation of anterior cerebellum on neurological disease. Lancet 1: 206. [DOI] [PubMed] [Google Scholar]
- Coste S, Ryvlin P, Hermier M, Mauguière F (2002): Temporopolar changes in temporal lobe epilepsy: a quantitative MRI‐based study. Neurology 59: 855–861. [DOI] [PubMed] [Google Scholar]
- Davis R, Emmonds SE (1992): Cerebellar stimulation for seizure control: 17‐year study. Stereotact Funct Neurosurg 58: 200–208. [DOI] [PubMed] [Google Scholar]
- Dietrichs E (1985): Divergent axon collaterals to cerebellum and amygdala from neurons in the parabrachial nucleus, the nucleus locus coeruleus and some adjacent nuclei. A fluorescent double labelling study using rhodamine labelled latex microspheres and fast blue as retrograde tracers. Anat Embryol (Berl) 172: 375–382. [DOI] [PubMed] [Google Scholar]
- Divac I, Lavail JH, Rakic P, Winston KR (1977): Heterogeneous afferents to the inferior parietal lobule of the rhesus monkey revealed by the retrograde transport method. Brain Res 123: 197–207. [DOI] [PubMed] [Google Scholar]
- Duncan R, Patterson J, Bone I, Wyper DJ (1987): Reversible cerebellar diaschisis in focal epilepsy. Lancet 2: 625–626. [DOI] [PubMed] [Google Scholar]
- Eberstaller V (1887): Zur Anatomie und Morphologie der Insula Reilii. Anat Anz 24: 739–750. [Google Scholar]
- Engel J Jr, Van Ness P, Rasmussen TB, Ojemann LM (1993): Outcome with respect to epileptic seizures In: Engel J, Jr, editor. Surgical treatment of the epilepsies. New York: Raven Press; p 609–621. [Google Scholar]
- Foldvary N, Lee N, Hanson MW, Coleman RE, Hulette CM, Friedman AH, Bej MD, Radtke RA (1999): Correlation of hippocampal neuronal density and FDG‐PET in mesial temporal lobe epilepsy. Epilepsia 40: 26–29. [DOI] [PubMed] [Google Scholar]
- Friston KJ (1994): Functional and effective connectivity in neuroimaging: a synthesis. Hum Brain Mapp 2: 56–78. [Google Scholar]
- Friston KJ, Frith CD, Liddle PF, Frackowiak RS (1993): Functional connectivity: the principal‐component analysis of large (PET) data sets. J Cereb Blood Flow Metab 13: 5–14. [DOI] [PubMed] [Google Scholar]
- Fritschy JM, Kiener T, Bouilleret V, Loup F (1999): GABAergic neurons and GABA(A)‐receptors in temporal lobe epilepsy. Neurochem Int 34: 435–445. [DOI] [PubMed] [Google Scholar]
- Fuster JM (2001) The prefrontal cortex — an update: time is of the essence. Neuron 30: 319–333. [DOI] [PubMed] [Google Scholar]
- Gil‐Nagel A, Risinger MW (1997): Ictal semiology in hippocampal versus extrahippocampal temporal lobe epilepsy. Brain 120: 183–192. [DOI] [PubMed] [Google Scholar]
- Gur RC, Gunning‐Dixon F, Bilker WB, Gur RE (2002): Sex differences in temporo‐limbic and frontal brain volumes of healthy adults. Cereb Cortex 12: 998–1003. [DOI] [PubMed] [Google Scholar]
- Heath RG, Harper JW (1974): Ascending projections of the cerebellar fastigial nucleus to the hippocampus, amygdala, and other temporal lobe sites: evoked potential and histological studies in monkeys and cats. Exp Neurol 45: 268–287. [DOI] [PubMed] [Google Scholar]
- Horwitz B (1994): Data analysis paradigms for metabolic‐flow data: combining neural modeling and functional neuroimaging. Hum Brain Mapp 2: 112–122. [DOI] [PubMed] [Google Scholar]
- Houston AS, Kemp PM, Macleod MA (1994): A method for assessing the significance of abnormalities in HMPAO brain SPECT images. J Nucl Med 35: 239–244. [PubMed] [Google Scholar]
- Isnard J, Guenot M, Ostrowsky K, Sindou M, Mauguiere F (2000): The role of the insular cortex in temporal lobe epilepsy. Ann Neurol 48: 614–623. [PubMed] [Google Scholar]
- Jackson GD, Berkovic SF, Duncan JS, Connelly A (1993): Optimizing the diagnosis of hippocampal sclerosis using MR imaging. Am J Neuroradiol 14: 753–762. [PMC free article] [PubMed] [Google Scholar]
- Kahane P, Merlet I, Gregoire MC, Munari C, Perret J, Mauguiere F (1999): An H(2) (15)O‐PET study of cerebral blood flow changes during focal epileptic discharges induced by intracerebral electrical stimulation. Brain 122: 1851–1865. [DOI] [PubMed] [Google Scholar]
- Kahane P, Chabardes S, Minotti L, Hoffmann D, Benabid AL, Munari C (2002): The role of the temporal pole in the genesis of temporal lobe seizures. Epileptic Disord 4(Suppl 1): S51–S58. [PubMed] [Google Scholar]
- Kobayashi M, Buckmaster PS (2003): Reduced inhibition of dentate granule cells in a model of temporal lobe epilepsy. J Neurosci 23: 2440–2452. [DOI] [PMC free article] [PubMed] [Google Scholar]
- Kuypers HG, Szwarcbart MK, Mishkin M, Rosvold HE (1965): Occipitotemporal corticocortical connections in the rhesus monkey. Exp Neurol 11: 245–262. [DOI] [PubMed] [Google Scholar]
- Lee JD, Kim HJ, Lee BI, Kim OJ, Jeon TJ, Kim MJ (2000): Evaluation of ictal brain SPET using statistical parametric mapping in temporal lobe epilepsy. Eur J Nucl Med 27: 1658–1665. [DOI] [PubMed] [Google Scholar]
- Lie AA, Becker A, Behle K, Beck H, Malitschek B, Conn PJ et al. (2000): Up‐regulation of the metabotropic glutamate receptor mGluR4 in hippocampal neurons with reduced seizure vulnerability. Ann Neurol 47: 26–35. [PubMed] [Google Scholar]
- Marks DA, Katz A, Hoffer P, Spencer SS (1992): Localization of extratemporal epileptic foci during ictal single photon emission computed tomography. Ann Neurol 31: 250–255. [DOI] [PubMed] [Google Scholar]
- Maroun M, Richter‐Levin G (2003): Exposure to acute stress blocks the induction of long‐term potentiation of the amygdala‐prefrontal cortex pathway in vivo. J Neurosci 23: 4406–4409. [DOI] [PMC free article] [PubMed] [Google Scholar]
- McIntosh AR, Gonzalez‐Lima F (1994): Structural equation modeling and its application to network analysis in functional brain imaging. Brain 2: 2–22. [Google Scholar]
- McIntosh AR, Grady CL, Ungerleider LG, Haxby JV, Rapoport SI, Horwitz B (1994): Network analysis of cortical visual pathways mapped with PET. J Neurosci 14: 655–666. [DOI] [PMC free article] [PubMed] [Google Scholar]
- McIntosh AR, Bookstein FL, Haxby JV, Grady CL (1996): Spatial pattern analysis of functional brain images using partial least squares. Neuroimage 3: 143–157. [DOI] [PubMed] [Google Scholar]
- Mesulam MM, Mufson EJ (1982a): Insula of the old world monkey. I. Architectonics in the insulo‐orbito‐temporal component of the paralimbic brain. J Comp Neurol 212: 1–22. [DOI] [PubMed] [Google Scholar]
- Mesulam MM, Mufson EJ (1982b): Insula of the old world monkey. III. Efferent cortical output and comments on function. J Comp Neurol 212: 38–52. [DOI] [PubMed] [Google Scholar]
- Mesulam MM, Van Hoesen GW, Pandya DN, Geschwind N (1977): Limbic and sensory connections of the inferior parietal lobule (area PG) in the rhesus monkey: a study with a new method for horseradish peroxidase histochemistry. Brain Res 136: 393–414. [DOI] [PubMed] [Google Scholar]
- Moran MA, Mufson EJ, Mesulam MM (1987): Neural inputs into the temporopolar cortex of the rhesus monkey. J Comp Neurol 256: 88–103. [DOI] [PubMed] [Google Scholar]
- O'Brien TJ, O'Connor MK, Mullan BP, Brinkmann BH, Hanson D, Jack CR et al. (1998a): Subtraction ictal SPET co‐registered to MRI in partial epilepsy: description and technical validation of the method with phantom and patient studies. Nucl Med Commun 19: 31–45. [DOI] [PubMed] [Google Scholar]
- O'Brien TJ, So EL, Mullan BP, Hauser MF, Brinkmann BH, Bohnen NI et al. (1998b): Subtraction ictal SPECT co‐registered to MRI improves clinical usefulness of SPECT in localizing the surgical seizure focus. Neurology 50: 445–454. [DOI] [PubMed] [Google Scholar]
- Oldfield RC (1971): The assessment and analysis of handedness: the Edinburgh inventory. Neuropsychologia 9: 97–113. [DOI] [PubMed] [Google Scholar]
- Ostrowsky K, Isnard J, Ryvlin P, Guenot M, Fischer C, Mauguiere F (2000): Functional mapping of the insular cortex: clinical implication in temporal lobe epilepsy. Epilepsia 41: 681–686. [DOI] [PubMed] [Google Scholar]
- Ostrowsky K, Desestret V, Ryvlin P, Coste S, Mauguiere F (2002): Direct electrical stimulations of the temporal pole in human. Epileptic Disord 4(Suppl 1): S23–S27. [PubMed] [Google Scholar]
- Pagani M, Salmaso D, Jonsson C, Hatherly R, Jacobsson H, Larsson SA, Wägner A (2002): Regional cerebral blood flow as assessed by a principal component analysis and 99mTc‐HMPAO SPET in healthy subjects at rest: normal distribution and effect of age and gender. Eur J Nucl Med 29: 67–75. [DOI] [PubMed] [Google Scholar]
- Paz C, Reygadas E, Fernandez‐Guardiola A (1985): Amygdala kindling in totally cerebellectomized cats. Exp Neurol 88: 418–424. [DOI] [PubMed] [Google Scholar]
- Penfield W, Faulk ME Jr (1955): The insula; further observations on its function. Brain 78: 445–470. [DOI] [PubMed] [Google Scholar]
- Prince DA, Wilder BJ (1967): Control mechanisms in cortical epileptogenic foci. “Surround” inhibition. Arch Neurol 16: 194–202. [DOI] [PubMed] [Google Scholar]
- Rabinowicz AL, Salas E, Beserra F, Leiguarda RC, Vazquez SE (1997): Changes in regional cerebral blood flow beyond the temporal lobe in unilateral temporal lobe epilepsy. Epilepsia 38: 1011–1014. [DOI] [PubMed] [Google Scholar]
- Save E, Poucet B (2000): Hippocampal‐parietal cortical interactions in spatial cognition. Hippocampus 10: 491–499. [DOI] [PubMed] [Google Scholar]
- Seitz RJ, Knorr U, Azari NP, Weder B (2001): Cerebral networks in sensorimotor disturbances. Brain Res Bull 54: 299–305. [DOI] [PubMed] [Google Scholar]
- Shin WC, Hong SB, Tae WS, Seo DW, Kim SE (2001): Ictal hyperperfusion of cerebellum and basal ganglia in temporal lobe epilepsy: SPECT subtraction with MRI coregistration. J Nucl Med 42: 853–858. [PubMed] [Google Scholar]
- Snider RS, Maiti A (1976): Cerebellar contributions to the Papez circuit. J Neurosci Res 2: 133–146. [DOI] [PubMed] [Google Scholar]
- Specht U, May T, Schulz R, Rohde M, Ebner A, Schmidt RC et al. (1997): Cerebellar atrophy and prognosis after temporal lobe resection. J Neurol Neurosurg Psychiatry 62: 501–506. [DOI] [PMC free article] [PubMed] [Google Scholar]
- Takeuchi Y, McLean JH, Hopkins DA (1982): Reciprocal connections between the amygdala and parabrachial nuclei: ultrastructural demonstration by degeneration and axonal transport of horseradish peroxidase in the cat. Brain Res 239: 583–588. [DOI] [PubMed] [Google Scholar]
- Takita M, Izaki Y, Jay TM, Kaneko H, Suzuki SS (1999): Induction of stable long‐term depression in vivo in the hippocampal‐prefrontal cortex pathway. Eur J Neurosci 11: 4145–4148. [DOI] [PubMed] [Google Scholar]
- Talairach J, Tournoux P (1988): Co‐planar stereotaxic atlas of the human brain. 3‐dimensional proportional system. An approach to cerebral imaging. Stuttgart: Thieme. [Google Scholar]
- Theodore WH, Fishbein D, Dietz M, Baldwin P, Deitz M (1987): Complex partial seizures: cerebellar metabolism. Epilepsia 28: 319–323. [DOI] [PubMed] [Google Scholar]
- Tusa RJ, Ungerleider LG (1985): The inferior longitudinal fasciculus: a reexamination in humans and monkeys. Ann Neurol 18: 583–591. [DOI] [PubMed] [Google Scholar]
- Van Paesschen W, Dupont P, Van Driel G, Van Billoen H, Maes A (2003): SPECT perfusion changes during complex partial seizures in patients with hippocampal sclerosis. Brain 126: 1103–1111. [DOI] [PubMed] [Google Scholar]
- Vielhaber S, Von Oertzen JH, Kudin AF, Schoenfeld A, Menzel C, Biersack HJ, Kral T, Elger CE, Kunz WS (2003): Correlation of hippocampal glucose oxidation capacity and interictal FDG‐PET in temporal lobe epilepsy. Epilepsia 44: 193–199. [DOI] [PubMed] [Google Scholar]
- Weder B, Oettli R, Maguire RP, Vonesch T (1996): Partial epileptic seizure with versive movements examined by [99m Tc] HM‐PAO brain single photon emission computed tomography: an early postictal study analyzed by computerized brain atlas methods. Epilepsia 37: 68–75. [DOI] [PubMed] [Google Scholar]
- Weder B, Azari NP, Knorr U, Seitz RJ, Keel A, Nienhusmeier M, Maguire RP, Leenders KL, Ludin HP (2000): Disturbed functional brain interactions underlying deficient tactile object discrimination in Parkinson's disease. Hum Brain Mapp 11: 131–145. [DOI] [PMC free article] [PubMed] [Google Scholar]
- Weder B, Schindler K, Wiest R, Wissmeyer K, Kollar M, Ritter P, et al. (2001): Functional correlates of mesial temporal lobe epilepsy. Neuroimage 13: S852. [Google Scholar]
- Wieser HG, Elger CE, Stodieck SR (1985): The ‘foramen ovale electrode’: a new recording method for the preoperative evaluation of patients suffering from mesio‐basal temporal lobe epilepsy. Electroencephalogr Clin Neurophysiol 61: 314–322. [DOI] [PubMed] [Google Scholar]
- Zubal IG, Spencer SS, Imam K, Seibyl J, Smith EO, Wisniewski G et al. (1995): Difference images calculated from ictal and interictal rechnetium‐99m‐HMPAO SPECT scans of epilepsy. J Nucl Med 36: 684–689. [PubMed] [Google Scholar]