

Abstract
Studies of spoken and written language suggest that the perception of sentences engages the left anterior and posterior temporal cortex and the left inferior frontal gyrus to a greater extent than nonsententially structured material, such as word lists. This study sought to determine whether the same is true when the language is gestural and perceived visually. Regional neural activity was measured using functional MRI while Deaf and hearing native signers of British Sign Language (BSL) detected semantic anomalies in well‐formed BSL sentences and when they detected nonsense signs in lists of unconnected BSL signs. Processing BSL sentences, when contrasted with signed lists, was reliably associated with greater activation in the posterior portions of the left middle and superior temporal gyri and in the left inferior frontal cortex, but not in the anterior temporal cortex, which was activated to a similar extent whether lists or sentences were processed. Further support for the specificity of these areas for processing the linguistic—rather than visuospatial—features of signed sentences came from a contrast of hearing native signers and hearing sign‐naïve participants. Hearing signers recruited the left posterior temporal and inferior frontal regions during BSL sentence processing to a greater extent than hearing nonsigners. These data suggest that these left perisylvian regions are differentially associated with sentence processing, whatever the modality of the linguistic input. Hum Brain Mapp, 2005. © 2005 Wiley‐Liss, Inc.
Keywords: sign language, syntax, fMRI, deaf, anterior temporal lobe, superior temporal gyrus
INTRODUCTION
Neuroimaging studies of spoken language perception have greatly increased our understanding of the neural networks involved within different linguistic subdomains. In a recent meta‐analysis of neuroimaging studies, Indefrey and Cutler [2004] identified the regions most robustly associated with passive listening to spoken language at the lexical (single word) and the sentential level. They found that processing word lists and sentences both recruit the left inferior frontal gyrus and the anterior and posterior middle and superior temporal gyri bilaterally. Only when an appropriately complex auditory baseline condition is employed does left temporal lobe dominance for language processing become evident [e.g., Scott et al., 2000]. Within the left temporal lobe, the increased semantic and/or syntactic complexity of sentences leads to the enhanced recruitment of the anterior and posterior portions of the middle and superior temporal gyri.
The left posterior middle and superior temporal gyri have been identified in a number of studies comparing sentences and nonsententially structured material. These regions have been reported as showing greater activation when participants listen to sentences than when they listen to any of the following: word lists [Friederici et al., 2000], foreign languages [Schlosser et al., 1998], auditorily complex nonspeech stimuli [Narain et al., 2003], and sequences of environmental sounds describing an event [Humphries et al., 2001]. The anterior portion of the left temporal lobe, including the temporal pole, also appears to play a special role in the processing of spoken sentences. Although recruited to some extent during single‐word processing [Price et al., 1996], the left anterior temporal lobe is often reported as showing enhanced activation as linguistic complexity increases. It is engaged during auditory sentence processing when this is contrasted with complex auditory nonspeech stimuli [Crinion et al., 2003; Narain et al., 2003; Scott et al., 2000], meaningful sequences of environmental sounds [Humphries et al., 2001], and listening to lists of unrelated words [Friederici et al., 2000; Mazoyer et al., 1993]. Evidence for involvement of the left anterior temporal lobe in supralexical processing comes not only from functional MRI (fMRI) studies [Humphries et al., 2002; Narain et al., 2003], which can suffer from dropout of signal in this region [e.g., Devlin et al., 2000], but also from studies using PET, in which this is not a potential confound [e.g., Scott et al., 2000]. Furthermore, the recruitment of these anterior and posterior temporal regions during sentence processing is not specific to auditory perception, but has also been observed during sentence reading, in comparison to reading scrambled sentences [Vandenberghe et al., 2002] and reading word lists [Stowe et al., 1999].
The meta‐analysis conducted by Indefrey and Cutler [2004] also identified the pars opercularis of the left inferior frontal gyrus as being consistently involved in sentence comprehension when the participant is not required to perform any specific task (passive presentation). Studies in which participants are required to perform a task, such as a memory or judgment task, usually report more extensive recruitment of the left prefrontal cortices [see Norris and Wise, 2000]. Further to this, Friederici [2004] has argued that the left frontal operculum/insula is involved in syntactic processing per se, whereas the lateral anterior/superior parts of the inferior frontal gyrus (Broca's area, BA44/45) are engaged during tasks with higher processing demands, in particular those involving a memory component. In contrast, Embick et al. [2000] suggest that these anterior portions of the left inferior frontal gyrus play a specific role in syntactic processing. The roles of the anterior and posterior temporal cortices in sentence processing also remain unclear. Friederici [2004] attributes activation in the left anterior temporal lobe to “syntactic online processing” and the left posterior temporal cortex to syntactic integration processes. However, the integration of meaningful components into one message has also been attributed to the anterior temporal cortex [Vandenberghe et al., 2002]. Whatever the relative functional specialization of these regions, it is clear that a predominantly left‐lateralized network, involving the anterior and posterior middle and superior temporal gyri and portions of the inferior frontal cortex, is involved in processing syntactically structured material, whether written or spoken, to a greater extent than nonsyntactically structured material, such as word lists.
Evidence for the involvement of the left hemisphere in processing sign language sentences comes from studies of Deaf1 signers who have suffered brain lesions [e.g., Corina, 1998]. Agrammatic patients have been reported whose production of sentences and discourse is severely impaired, with relatively unimpaired production of single signs [see Poizner et al., 1987]. Although it has been proposed that signed languages may make greater demands on the right hemisphere than written versions of spoken languages [Neville et al., 1998], most neuroimaging studies, including Neville et al. [1998], indicate a prominent role for the left hemisphere in sign language processing [e.g., Emmorey et al., 2003; MacSweeney et al., 2002a, b, 2004]. Our previous studies suggest that the neural systems engaged by native signers viewing signed sentences are remarkably similar to those recruited by speakers viewing and listening to spoken sentences [MacSweeney et al., 2002b]. Furthermore, when perception of British Sign Language (BSL) sentences was contrasted with strings of meaningless hand and arm gestures of similar length, Deaf signers showed enhanced activation in the classical language regions in the left hemisphere, including the inferior frontal gyrus and the posterior superior temporal gyrus [MacSweeney et al., 2004]. However, no differences were found in the anterior temporal lobe. Participants had been told that the nonsense stimuli represented a gestural code that was unfamiliar to them, and were asked to guess which of the sentences did not make sense. Thus, they were required to look for meaning in the input. In addition, the Deaf model added prosody and facial expression to the nonsense sentences to make them as similar to BSL as possible. These two factors may have reduced the processing differences, and therefore the extent of observed differences in activation, between the sign and nonsign conditions.
In the present study we explored the neural systems recruited for signed sentence processing using an alternative comparison condition. Perception of BSL sentences was contrasted with perception of signed lists of single lexical items. Just as in spoken languages, the lexical and syntactic levels of signed languages can be distinguished. Signs to represent single referents can be described in terms of their phonological structure, which consists of handshape, hand orientation, movement, and hand location [see Emmorey, 2002; Sutton‐Spence and Woll, 1999]. Single signs then combine into sentences, which make use of “sign space,” a region in front of the body, in order to refer to agents and actions: that is, they show spatial as well as temporal ordering.
Only one study to date has explored the neural systems associated with the perception of single signs. Petitto et al. [2000] contrasted single‐sign perception with fixation and reported bilateral engagement of the calcarine sulcus and lingual gyri in the occipital lobe, the posterior middle and superior temporal gyri and the precentral gyri (see online Supplementary material). To date, no study has directly contrasted signed sentences with single signs in order to explore the contribution of sentence structure, including sentence prosody and sentence level semantics to the activation patterns observed in previous neuroimaging studies of signed sentence processing [e.g., MacSweeney et al., 2002b; Neville et al., 1998].
Using fMRI, we studied Deaf and hearing native signers of BSL during detection of a nonsign in a list of single signs and of a semantically anomalous sentence in a sequence of BSL sentences. A low‐level baseline task was also included. These stimuli may differ in terms of their linguistic complexity: syntactic structure, semantic elaboration, degree of lexical content, and spatial and durational (including rhythmic) structure. Rather than attempt to control for, or dissociate, these aspects of sentence processing, the aim of this initial study was simply to further elucidate the cortical system involved in processing sign language sentences in general. However, a further exploration of the cortical regions involved in language processing, as opposed to processing nonlinguistic aspects of the input, was undertaken. This was done by contrasting hearing people with no sign language knowledge and hearing signers on the BSL sentence and signed list tasks.
Given the similarities we have previously observed between sign and speech processing, we predicted that in participants with sign language knowledge processing BSL sentences, relative to processing single signs, would engage posterior portions of the left middle and superior temporal gyri and the left inferior frontal gyrus. Our position regarding the involvement of the left anterior temporal cortex was open. We had not previously observed differential activation in this region between BSL and non‐BSL sentences when viewers were required to look for meaning in the nonsense sentences. In line with reports of written and heard sentence processing, however, it is possible that differential activation may be observed in this region when sentences are contrasted with lists of single lexical items.
Hearing nonsigners were not predicted to show differential activation in the classical language regions within the left inferior frontal gyrus and the posterior left middle and superior temporal gyri when sentences were contrasted with signed lists. In addition, it was predicted that signers would show significantly greater activation in these regions than nonsigners during BSL comprehension, whether of signed lists or sentences.
SUBJECTS AND METHODS
Participants
Eighteen right‐handed signing participants were tested. All were native signers, having acquired BSL from their Deaf parents. Nine were congenitally profoundly Deaf from birth (five male, four female). Their mean age was 30.5 years (range 18–48 years). All Deaf participants performed at or above an age appropriate level on a test of nonverbal IQ (Block Design, WAIS‐R). Nine hearing native signers were also tested (three male, six female). Their mean age was 31.3 years (range 20–51 years). All had good English language skills as tested on the Group Reading Test (NFER‐Nelson, 2000) and six of the nine were employed as a BSL interpreter or communication worker. All signing participants were tested on a match to sample BSL comprehension test, consisting of both single lexical items and complex sentential structures, including negation and spatialized‐syntax [see MacSweeney et al., 2004, for more detail]. There was no significant difference between the Deaf and hearing signing groups on this test (t = 1.12 (14), P > 0.1). Ten hearing nonsigners were also tested (five male, five female). Their mean age was 25.9 years (range 18–40 years).
All participants were right‐handed, had normal or corrected vision, and were without known neurological or behavioral abnormality. All participants gave written informed consent to participate in the study, which was approved by the relevant Research Ethics Committee and was in compliance with the Declaration of Helsinki.
Stimuli
Participants were shown a silent video of a Deaf native signer, who produced the BSL sentences, signed lists, and also appeared at rest in the baseline condition. Short declarative BSL sentences were used. Five unrelated sentences were viewed in each 21‐s block, one of which was semantically anomalous. All single sign stimuli were highly familiar concrete nouns. The signer performed 10 single signs in each 21‐s block, one of which was a non‐BSL sign. Each nonsign was phonologically legal in terms of its handshape, location, orientation, and movement. However, they were not lexically meaningful, nor were they closely related in structure to any real lexical item in BSL. English mouth movements were omitted from both sentences and lists of signs to avoid lipreading by nonsigners. Other mouth and facial articulations required for BSL were included [see Sutton‐Spence and Woll, 1999]. English glosses of the sentences and single‐sign stimuli are shown in the Appendix. The videotaped stimuli were projected onto a screen located at the base of the scanner table via a Proxima 8300 LCD projector. The stimuli were then projected to a mirror angled above the subject's head in the scanner.
Experimental Design
The experiment used a block design consisting of 21‐s epochs. Participants performed five blocks of each of the two experimental conditions (single sign and sentence perception) and 10 blocks of a baseline task. Experimental blocks alternated with the baseline task (e.g., baseline/BSL sentences/baseline/single BSL signs, etc.). The presentation of initial experimental condition was counterbalanced across participants such that half the participants performed the single sign task first and half the sentences task. Data acquisition lasted 7 min total.
Signed list task.
Participants watched 10 single BSL signs in each block. Between each sign the signer returned her hands to a resting position on her lap. This form of presentation is similar to a silent pause when reading aloud a list of words. Within each block, a nonsign was included. The participant's task was to make a button press response to the non‐BSL sign using a button box in the right hand.
BSL sentence task.
Participants watched blocks of five BSL sentences. Between each sentence the signer returned her hands to a resting position on her lap. Participants were told that one of the five sentences did not make sense (e.g., “The book climbed the tree”) and their task was to identify the semantically anomalous sentence.
Baseline task.
In the baseline condition the signer was seen at rest. The participant was required to monitor the display for the occurrence of a visual cue superimposed on the chin of the model. A small square appeared five times throughout the block, for about 1,000 ms. On four exposures the square was black and on one appearance it was gray. Participants pressed a button in response to the appearance of the gray square. This control condition therefore served to maintain vigilance to the visual display, and controlled for the attentional and motor‐response parameters of the linguistic tasks, as well as for the perception of a face and body at rest.
In order to maintain attention across the whole block, the anomalous sentence, nonsense sign, or target square appeared near the end of each 21‐s epoch. The relatively sparse occurrence of the meaningless targets in both language conditions ensured that activation reflected normal linguistic analysis rather than anomaly detection. Hearing nonsigners were told that, although they did not know any BSL, they were to try to guess which was the non‐BSL sign and which sentence did not make sense.
Imaging Parameters
Gradient echo echoplanar MRI data were acquired with a General Electric (Milwaukee, WI) 1.5 T Neuro‐optimized MR system using a standard quadrature head coil. Head movement was minimized by positioning the participant's head between cushioned supports. In all, 140 T2*‐weighted images depicting BOLD contrast were acquired at each of 14 near‐axial 7‐mm thick planes parallel to the intercommissural (AC–PC) line (0.7 mm interslice gap; TR = 3 s, TE = 40 ms). An inversion recovery EPI dataset was also acquired to facilitate registration of individual fMRI datasets to Talairach space [Talairach and Tournoux., 1988]. This comprised 43 near‐axial 3‐mm slices (0.3 mm gap) which were acquired parallel to the AC–PC line (TE = 80 ms, TI = 180 ms, TR = 16 s).
Data Analysis
Following motion correction, fMRI data were smoothed using a Gaussian filter (FWHM 7.2 mm) and the least‐squares fit computed between the observed time series at each voxel and the convolutions of two one‐parameter gamma variate functions (peak responses 4 and 8 s) with the experimental design [Friston et al., 1998]. In order to constrain the range of fits to those known to reflect the physiological features of BOLD responses, the constraints described by Friman et al. [2003] were applied during the fitting process. The relative weighting of the fits to these two convolutions permits the peak time of BOLD response to adapt to local variations within the time range 4–8 s. Following fitting, a statistic describing the standardized power of response was derived by calculating the ratio between the sum of squares due to the model fit and the residual sum of squares (SSQ ratio). Significant values of this statistic were identified by comparison with its null distribution computed by repeating the fitting procedure 20 times at each voxel after wavelet‐based permutation of the time series [Bullmore et al., 2001]. This procedure preserves the noise structure of the time‐series during the permutation process and gives good control of Type I error rates. The voxel‐wise SSQ ratios were calculated for each subject from the observed data and, following time‐series permutation, were transformed into standard space of Talairach and Tournoux [1988] as described previously [Brammer et al., 1997; Bullmore et al., 1996].
Group Analysis
Further analysis was carried out to identify 3‐D clusters of voxels showing significant responses to the paradigm (see Table I). This was achieved by first thresholding the median voxel‐level SSQ ratio maps at a voxel‐wise false‐positive probability of 0.01. These “activated” voxels were then assembled into 3‐D connected clusters and the sum of the SSQ ratios (statistical cluster mass) determined for each cluster. The same procedure was repeated for the median SSQ ratio maps obtained from the wavelet‐permuted data to compute the null distribution of statistical cluster masses under the null hypothesis. This distribution was then used to determine the critical threshold for the cluster mass statistic under the null hypothesis. For all groups the cluster‐wise P‐value was set at 0.005, since this resulted in the expectation of less than one false‐positive cluster across the whole brain. This was applied to the observed cluster mass data to determine significantly activated clusters [for details, see Bullmore et al., 1999].
Table I.
Regions activated during perception of British Sign Language sentences and signed lists in contrast to a static baseline task in each group
| Side | Sentences vs. baseline | Signed lists vs. baseline | |||||
|---|---|---|---|---|---|---|---|
| Size | x, y, z | BA | Size | x, y, z | BA | ||
| Deaf native signers | |||||||
| Posterior inferior temporal gyrus | R | 357 | 47, −59, −7 | 37 | 513 | 43, −63, −2 | 37 |
| L | 490 | −51, −63, −2 | 37 | ||||
| Superior temporal gyrus/SMG | L | 498 | −51, −44, 26 | 22/40 | |||
| Inferior frontal gyrus | R | 476 | 51, 15, 26 | 44 | 492 | 43, 19, 20 | 45 |
| L | 408 | −43, 11, 37 | 9 | 329 | −43, 11, 31 | 44 | |
| Middle frontal gyrus | L | 17 | −36, 48, −7 | 47/10 | |||
| Medial frontal gyrus | R | 16 | 11, 59, 20 | 10 | |||
| Anterior cingulate | R | 42 | 7, 22, 37 | 32 | 9 | 14, 15, 37 | 32 |
| Calcarine sulcus | R | 14 | 18, −85, 9 | 17 | |||
| Putamen | R | 39 | 11, 0, 9 | 11 | 11, 0, 9 | ||
| L | 12 | −11, 0, 9 | |||||
| Cerebellum | L | 8 | −40, −67, −29 | ||||
| L | 13 | −11, −85, −18 | |||||
| Hearing native signers | |||||||
| Posterior inferior temporal gyrus/ | R | 359 | 51, −56, 4 | 21/37 | 210 | 51, −59, −2 | 37 |
| Middle temporal gyrus | L | 574 | −51, −63, 9 | 37 | 506 | −47, −63, 9 | 21 |
| Precentral gyrus/ | R | 313 | 51, 19, 31 | 9 | 377 | 47, 4, 37 | 6 |
| Middle frontal gyrus | L | 540 | −36, 7, 31 | 6 | 363 | −36, 4, 31 | 6 |
| Anterior cingulate | R | 47 | 7, 22, 37 | 32 | 65 | 7, 22, 31 | 32 |
| Supramarginal gyrus | R | 17 | 36, −52, 31 | 40 | |||
| R | 28 | 33, −37, 31 | 40 | ||||
| Middle occipital gyrus | R | 21 | 22, −74, 26 | 19 | 87 | 25, −78, 20 | 19 |
| Calcarine sulcus | R | 7 | 7, −89, 9 | 18 | |||
| Putamen | L | 13 | −18, 7, 4 | ||||
| Hearing nonsigners | |||||||
| Posterior inferior temporal gyrus | R | 503 | 51, −59, −2 | 37 | 508 | 51, −56, −2 | 37 |
| L | 303 | −47, −70, 4 | 37 | 323 | −47, −70, 4 | 37 | |
| Inferior/middle frontal gyrus | R | 440 | 47, 7, 37 | 44 | 636 | 43, 15, 26 | 44 |
| L | 220 | −43, 7, 31 | 44 | 156 | −43, 0, 48 | 6 | |
| Supramarginal gyrus | L | 11 | −36, −56, 42 | 40 | |||
| L | 10 | −51, −37, 48 | 40 | ||||
| Superior parietal lobule | L | 21 | −25, −44, 42 | 7 | 17 | −25, −48, 48 | 7 |
| Anterior superior temporal gyrus | L | 14 | −40, 22, −24 | 38 | |||
| Anterior cingulate | R | 305 | 7, 19, 42 | 32 | |||
| Calcarine sulcus/cuneus | L | 13 | −7, −93, 4 | 17 | 14 | −14, −93, −2 | 17 |
| Hippocampal gyrus | L | 12 | −11, −89, 9 | 17 | 9 | −14, −89, 15 | 18 |
| R | 17 | 7, −37, 4 | 18 | ||||
Voxel‐wise P‐value = 0.01; cluster‐wise P‐value = 0.005. Foci represent the most strongly activated voxel in each 3‐D cluster.
SMG, supramarginal gyrus.
ANOVA
Differences in responses (R) were inferred at each voxel using the model:
where H codes a particular condition or group and e is the residual error. Maps of the standardized coefficient (size of condition or group difference) (a1), were tested for significance against the null distribution of a1 (no effect of group membership or condition) generated by repeatedly refitting the above model at each voxel following randomization of group or condition membership (H). In some of our analyses the model was constrained in order to examine only positive BOLD responses, where the stimulus is followed by an increase in signal intensity peaking between 4 and 8 s. In this case significant deactivations were excluded from the analyses. In addition, the parameters (a0 and a1) in the observed data, and their distributions under the null hypothesis of no effect of group membership, were obtained by iteratively minimizing the sum of absolute deviations (rather than minimizing the sum of squares of deviations) between the data and the model with and without randomization, respectively. This fitting procedure was adopted to ensure that all observations were given equal weight rather than exaggerating the effects of outliers—a necessary step in analyzing the group sizes typically used in fMRI when normality assumptions are not tested at every voxel.
RESULTS
Behavioral Data
Due to technical problems during one day of data acquisition, behavioral data from one subject in each of the three groups could not be acquired.
Chance level performance was ∼10% on the single signs task and 20% on the sentence task. Mean performance by hearing nonsigners was within chance range on the single signs task: 5%, but above chance for the sentences task: 42%. Since the anomalous sentence always appeared near the end of the block, it is likely that nonsigners waited until near the end of block to make their button press response. This strategy would artificially inflate their behavioral performance on the sentence task, but not the single sign task, in which there were more items to choose from at the end of the block.
Mean performance by Deaf signers on each BSL task was high: single signs: 85%, sentences: 68%. Mean performance by hearing signers was high on the single sign task: 67%, but unexpectedly poor, though still above chance, on the sentences task: 38%. The poor performance of the hearing signers will be addressed in detail in the Discussion. However, due to this we do not report a combined ANOVA including Deaf and hearing signers.2 Rather, we report the data from these groups separately.
fMRI Data
Comparison of the signed list and sentence conditions with the baseline task revealed widespread cortical activation for each condition and within each group. Figure 1, Table I, and the descriptions below give a summary of these patterns before the more detailed contrasts are reported.
Figure 1.
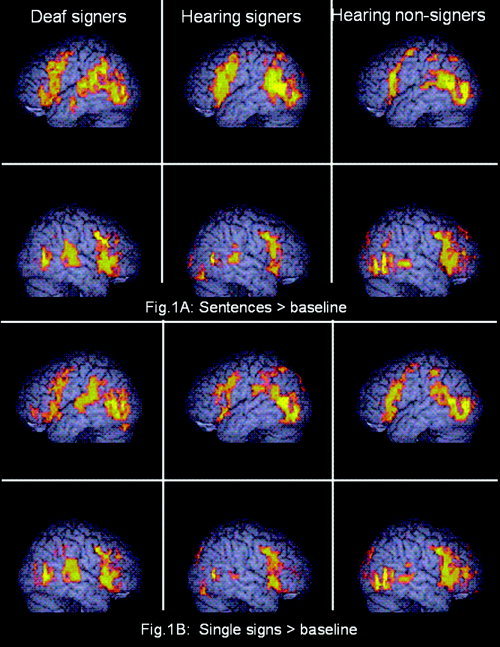
Significant activation in response to signed lists and BSL sentences in contrast to a static baseline task for each group (voxel‐wise P = 0.01; cluster‐wise P = 0.005). Activated voxels up to 4 mm beneath the surface of the cortex are displayed.
BSL sentences vs. baseline
The regions activated while watching BSL sentences in contrast to a still baseline task (Fig. 1A) were very similar to the patterns we have reported previously [MacSweeney et al., 2002b, 2004]. Extensive activation was observed in a bilateral frontotemporal network in all groups, including hearing nonsigners (see Fig. 1A, Table I). Activation within the inferior frontal gyri extended superiorly into the precentral gyri bilaterally. In both hearing groups the foci of the extensive bilateral temporal lobe activations were in the posterior inferior temporal gyri. These clusters of activation extended superiorly through the temporal lobe and activation was also observed in the inferior parietal lobule. In the Deaf group the focus of activation in the right hemisphere was also in the posterior inferior temporal gyrus. However, in the left hemisphere the focus of the posterior temporal activation was at the junction of the posterior superior temporal gyrus and the supramarginal gyrus in the inferior parietal lobule. Both hearing nonsigners and Deaf native signers showed significant activation in the anterior temporal lobes. In hearing nonsigners a very small cluster was activated, situated in the anterior portion of the left superior temporal gyrus (see Table I). In Deaf signers, activation within the left temporal lobe extended into the anterior portion of the left middle temporal gyrus (x = −61, y = −10, z = −18; see Fig. 1).
BSL single signs vs. baseline
The activation patterns observed during single sign perception were similar to those for sentences (see Table I). All groups recruited an extensive bilateral frontotemporal network. This included the inferior and middle frontal gyri extending into the precentral gyrus. The posterior inferior temporal gyrus was again the focus of the temporal lobe activation. In the left hemisphere this posterior activation incorporated the inferior parietal lobule in all groups. Anterior temporal activation was evident only in the Deaf group. This was situated in the left middle temporal gyrus, but was more posterior and superior to that observed during sentence perception (x = −63, y = −23, z = −5).
BSL Sentences Greater Than Single Signs
Deaf native signers
Deaf signers showed greater activation for signed sentences than signed lists in the left posterior superior temporal cortex (see Table II and Fig. 2). This activation extended from the fusiform gyrus, into the posterior inferior, middle and superior temporal gyri, and into the inferior parietal lobule. In addition, a small cluster of activation was identified in the right posterior middle temporal gyrus. Extensive significant activation was also observed in the left inferior frontal cortex, extending into the middle frontal gyrus. There were also very limited clusters of activation in the right inferior frontal gyrus and in the left cerebellum. There were no significant differences in activation within the anterior temporal lobes.
Table II.
Regions showing significantly greater activation during perception of BSL sentences than signed lists in each group
| L/R | Size | x, y, z | BA | |
|---|---|---|---|---|
| Deaf native signers | ||||
| Temporal and parietal cortex | ||||
| Fusiform gyrus | L | 7 | −40, −59, −13 | 37 |
| Inferior temporal gyrus | L | 9 | −36, −70, −2 | 19 |
| Middle temporal gyrus | L | 15 | −51, −52, −2 | 37 |
| L | 18 | −47, −48, 4 | 21 | |
| L | 35 | −47, −52, 9 | 21 | |
| Superior temporal gyrus | L | 41 | −36, −52, 15 | 22 |
| L | 17 | −47, −48, 20 | 22 | |
| Supramarginal gyrus | L | 23 | −43, −48, 26 | 39 |
| L | 17 | −43, −48, 31 | 40 | |
| Middle temporal gyrus | R | 10 | 51, −33, −2 | 21 |
| Frontal cortex | ||||
| Insula | L | 8 | −47, 7, 4 | |
| Inferior frontal gyrus | L | 10 | −51, 11, 9 | 44 |
| L | 8 | −36, 30, 15 | 45 | |
| L | 13 | −36, 15, 20 | 45 | |
| L | 11 | −36, 11, 26 | 44 | |
| L | 12 | −29, 7, 31 | 44 | |
| Middle frontal gyrus/ | L | 14 | −29, 0, 37 | 9/6 |
| Precentral gyrus | L | 10 | −43, 0, 42 | 9/6 |
| Inferior frontal gyrus | R | 7 | 54, 11, 20 | 44 |
| Hearing native signers | ||||
| Temporal and parietal cortex | ||||
| Fusiform gyrus | L | 7 | −43, −59, −13 | 19 |
| L | 8 | −32, −81, −7 | 19 | |
| Inferior temporal gyrus | L | 9 | −43, −48, −7 | 37 |
| L | 20 | −51, −56, −2 | 37 | |
| L | 47 | −43, −70, 4 | 37 | |
| Middle temporal gyrus | L | 39 | −36, −70, 9 | 37 |
| L | 37 | −40, −70, 15 | 39 | |
| Superior temporal gyrus | L | 11 | −47, −52, 20 | 22 |
| Middle temporal gyrus | R | 11 | 54, −33, −7 | 21 |
| R | 20 | 58, −44, −2 | 21 | |
| R | 38 | 47, −63, 4 | 37 | |
| Superior temporal gyrus | R | 9 | 58, −37, 9 | 22 |
| Supramarginal gyrus | R | 7 | 43, −67, 9 | 39 |
| Frontal cortex | ||||
| Precentral gyrus | L | 19 | −47, 7, 9 | 6 |
| Inferior frontal gyrus | L | 30 | −43, 7, 15 | 44 |
| L | 28 | −47, 4, 20 | 44 | |
| L | 11 | −40, 4, 31 | 44 | |
| Middle frontal gyrus | L | 31 | −29, 4, 26 | 6 |
| L | 11 | −40, 4, 37 | 9 | |
| Hearing non‐signers | ||||
| Occipital cortex | ||||
| Middle occipital gyrus | L | 30 | −32, −81, 4 | 19 |
| L | 42 | −43, −74, 9 | 19 | |
| Occipito‐temporal junction | L | 28 | −43, −67, 15 | 39 |
| Temporal and parietal cortex | ||||
| Middle temporal gyrus | R | 8 | 54, −37, −13 | 21 |
| R | 20 | 58, −41, −7 | 21 | |
| R | 24 | 58, −44, −2 | 21 | |
| R | 12 | 51, −37, 4 | 21/22 | |
| Hippocampal gyrus | R | 7 | 11, −41, 4 | 18 |
| Superior parietal lobule | R | 9 | 36, −48, 42 | 7 |
| L | 9 | −22, −56, 42 | 7 | |
| Frontal cortex | ||||
| Inferior frontal gyrus | R | 10 | 47, 7, 26 | 44 |
| R | 9 | 40, 4, 31 | 44 | |
| Middle frontal gyrus | R | 8 | 32, 44, 26 | 46 |
| R | 11 | 32, 41, 31 | 9 | |
| Precentral gyrus | R | 11 | 51, 4, 37 | 6 |
| L | 8 | −36, −4, 48 | 4 |
Voxel‐wise P = 0.01; cluster‐wise P = 0.005).
Three‐dimensional clusters have been deconstructed into 2‐D in order to increase the anatomical specificity. Therefore, foci represent the most strongly activated voxel within each cluster on each slice. Only clusters of more than six voxels are reported.
Figure 2.
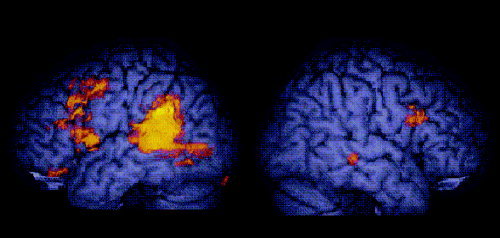
Greater activation for BSL sentences than signed lists in Deaf native signers (voxel‐wise P = 0.01; cluster‐wise P = 0.005). Activated voxels up to 15 mm beneath the surface of the cortex are displayed.
Hearing native signers
As in Deaf signers, hearing native signers also showed enhanced recruitment of a predominantly left‐lateralized frontotemporal network for BSL sentences when contrasted with signed lists. The location and extent of the left posterior superior temporal and left inferior frontal activation was very similar to that described for the Deaf group (see Table II). In contrast to the Deaf signers, however, hearing signers appeared to show much more extensive activation in the right posterior middle and superior temporal gyri. No differential activation as a function of linguistic input was observed in the anterior temporal lobes.
Hearing nonsigners
Hearing participants with no sign language knowledge also showed greater activation for sentences than single signs in posterior (occipitotemporal) and frontal regions (see Table II); however, these were somewhat different in location than those observed in the signing groups. Greater activation was observed for sentences than signs in the left middle occipital gyrus, extending in the occipitotemporal junction, and in the right posterior middle temporal gyrus. Differences within the frontal lobes were predominantly situated in the right hemisphere in inferior frontal gyrus and also in the more anterior middle frontal gyrus.
Exploring the Role of the Anterior Temporal Lobe: Deaf Native Signers Only
To explore the potential involvement of the anterior temporal cortex in BSL sentence processing in more detail, a region of interest approach was used. This was employed in Deaf native signers only since they were the only group who showed activation in this region when either task was contrasted with the baseline task.
Mean SSQ ratios were extracted for each Deaf participant from both the sentence and signed lists statistical maps (each in contrast to baseline) in a region of the anterior middle temporal gyrus in both hemispheres. These regions were derived by deconstructing the significantly activated 3D clusters, identified in the contrast of BSL sentences with the baseline task, into 2D foci of activation (see Table I). The coordinates of these regions were: left: x = −61, y = −15, z = −2 (number of voxels = 7); right: x = 54, y = −15, z = −13 (number of voxels = 6). Data from the single sign and sentence conditions were compared using a repeated measures t‐test. No significant differences were observed in either the left (t = −0.55, (9) P > 0.1) or the right hemisphere (t = −0.66, (9) P > 0.1).
Only those regions in which data was acquired from all subjects enter the analyses. Since the anterior temporal lobes are often susceptible to signal dropout, we examined the extent of data acquisition in this region in the Deaf group. In slices at, and inferior to, z = −18 mm [Talairach and Tournoux, 1988, coordinates] there was some evidence of dropout in lateral temporal regions (∼y = 0 to −15 mm), but there was no dropout of signal anterior to this. Data acquisition in slices superior to this was complete for all subjects. In previous studies of spoken sentence processing, it is at ∼z = −13 mm that sentence specific activations are reported [see, for example, Scott et al., 2000, when MNI coordinates are converted into Talairach coordinates]. Therefore, signal dropout does not appear to be a major contributor to the apparent lack of differential activation in this region in the current study.
Effect of BSL Knowledge: 2 (Hearing Signers/Hearing Nonsigners) × 2 (Sentences/Signs) ANOVA
To further explore the regions engaged in linguistic processing as opposed to visual gesture processing, we contrasted activation in hearing native signers with that observed in hearing nonsigners in a mixed‐model ANOVA,3 where the factors were BSL status (between participants) and linguistic domain (sentences/signs − within participants).
All reported effects are significant at a voxel‐wise P < 0.05 and a cluster‐level P < 0.01. This ensured that the cluster‐wise Type I error rate was less than one false‐positive cluster over the whole brain. Significant main effects of both group and condition were identified, but no interaction effect.
Main effect of BSL knowledge (group)
Hearing signers showed greater activation than nonsigners in the left inferior frontal gyrus and in the posterior portions of the left middle temporal gyrus (see Fig. 3). The focus of the frontal activation was situated at the junction of the inferior and middle frontal gyri (x = −36, y = 4, z = 31; number of voxels = 223), with activation extending medially into the anterior part of the insula. In the temporal lobe, activation extended from the left inferior temporal gyrus through the middle temporal gyrus and into the superior temporal gyrus (x = −47, y = −63, z = 9; number of voxels = 113). No differences were detected in anterior portions of the temporal lobe. Only one region showed significantly greater activation in hearing nonsigners than signers. This was situated in the posterior portion of the right inferior and middle temporal gyri (x = 54, y = −52, z = −2; number of voxels = 92).
Figure 3.
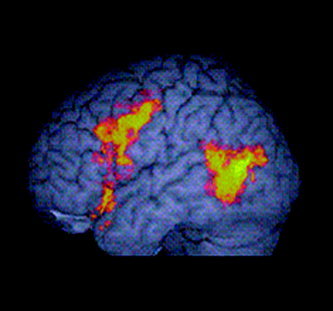
Main effect of BSL knowledge: hearing signers vs. hearing nonsigners. Greater activation in hearing native signers than hearing nonsigners across signed sentence and signed list conditions (voxel‐wise P = 0.05; cluster‐wise P = 0.01). Activated voxels up to 15 mm beneath the surface of the cortex are displayed.
Main effect of condition (sentences vs. signs) across hearing signers and nonsigners
Greater activation was identified for signed lists than sentences in the right posterior middle temporal gyrus (x = 36, y = −70, z = 15; number of voxels = 277). This cluster also extended medially to incorporate a large portion of the posterior cingulate. The left posterior middle temporal gyrus (x = −43, y = −59, z = 15; number of voxels = 143) was activated to a greater extent by signed sentences than signed lists. Although the interaction did not reach significance, the proximity of this main effect of condition (sentences > signs) to the region showing greater activation in hearing signers than nonsigners (see main effect of group), lends some support to the interpretation that the involvement of the left middle temporal gyrus in sentence processing was driven by the hearing signers.
DISCUSSION
Here we report the neural systems engaged during the perception of signed sentences and signed lists in native users of British Sign Language (BSL) and in BSL‐naïve individuals. In contrast to a baseline task, both types of BSL input engaged the middle and superior temporal gyri, focused around the occipitotemporal junction, bilaterally and also extensive portions of the prefrontal cortex bilaterally. This basic pattern was observed regardless of BSL knowledge and hearing status.
The primary aim of this study was to determine the neural system involved in processing signed sentences when contrasted with lists of single unrelated signs. Consistent with studies of spoken language, and with our predictions, signers engaged the left posterior middle and superior temporal gyri and the left inferior frontal gyrus to a greater extent when processing BSL sentences than lists of BSL signs. This pattern was not observed in hearing nonsigners. Moreover, these were the regions that showed greater activation in hearing signers than nonsigners during BSL perception. There was no evidence, however, for a specific role for the anterior temporal lobe in signed sentence processing.
It could be argued that this network is not specific to sentence processing, but rather reflects differences in the degree of lexical processing between conditions: lists consisted of 10 signs, whereas sentence blocks consisted of around 15 content signs. Future studies manipulating the rate of presentation of single signs are necessary to address this issue. However, given the striking similarity between the present data and those reported in analogous studies of spoken sentence processing, it seems unlikely that a difference in the demands on lexical processing could completely account for the differential activation we observed. The role of each of these areas outlined above in processing signed sentences will be discussed in turn.
Posterior Temporal Cortex
The involvement of the left posterior middle and superior temporal gyri in signed sentence processing was one of the robust findings of the present study. Despite the differences in signed sentence accuracy between Deaf and hearing signers, this region was activated to a greater extent for sentences than signs in both signing groups. In hearing nonsigners, by contrast, greater activation for sentences than signed lists was observed in more posterior portions of the left hemisphere in the middle occipital gyrus. In further support of the argument that the left posterior middle and superior temporal gyri are involved in processing the linguistic aspects of signed language, hearing signers showed greater activation in this region during sign processing than hearing nonsigners. The posterior parts of the left middle and superior temporal gyri have consistently been implicated in auditory sentence comprehension [Friederici et al., 2000; Humphries et al., 2001; Vandenberghe et al., 2002]. The fact that this posterior perisylvian region is also differentially activated by signed input depending on linguistic level of the stimuli and the sign language knowledge of the perceiver suggests that this area is involved in higher‐level language processing, independent of language modality [see also MacSweeney et al., 2004; Neville et al., 1998; Petitto et al., 2000], despite its proximity to auditory processing areas within the superior temporal cortex [Penhune et al., 1996].
There was some indication that the right posterior middle temporal gyrus may be more involved in processing signed sentences than signed lists. Deaf signers showed a very small focus of greater activation for sentences than signed lists in this region (10 voxels only), while in hearing signers differential activation was more extensive (see Table II). However, there is little reason to interpret this activation as being related to linguistic processing. First, hearing nonsigners also showed much greater activation of this area for sentences than signed lists. Second, in direct contrast of hearing signers and nonsigners it was the hearing nonsigners who showed significantly greater activation in the right posterior middle temporal gyrus. Nevertheless, it is interesting to consider the possible reasons for the enhanced engagement of this region by hearing nonsigners. Despite having no prior exposure to signed languages, hearing nonsigners may show some sensitivity to the different levels of structural complexity of a signed language, including its rhythmic and spatial aspects. Moreover, they may explicitly attend to these features more than signers when asked to make a judgment on such sentences. Further consideration of the neural systems recruited when sign‐naïve individuals perceive a signed language may prove to be interesting in its own right. When a hearing person listens to a foreign language there are usually some speech sounds, and perhaps also phonological, prosodic, and sentential features that are present in the perceiver's native language: speech is speech, however “foreign.” However, when a hearing nonsigner watches a signed language, this is not the case. This may be the only situation in which we can explore the response of the brain to structural language differences, where there has been no experience with the relevant language elements.
Inferior Frontal Cortex
All groups engaged the inferior frontal and precentral gyri bilaterally during perception of signed lists and sentences in contrast to the baseline task. The large extent of this activation in signers and the observation of significant activation in this region in hearing nonsigners is not unexpected [see MacSweeney et al., 2004]. Activation of motor and premotor cortex may reflect activation of the proposed “mirror neuron system” in this region [see Rizzolatti and Craighero, 2004, for review] during perception of the manual and facial gestures, whether or not they constitute sign language (see Emmorey [2005], for discussion of the role of prefrontal cortex in sign language processing). Importantly, however, this study also confirmed the key role the left inferior frontal gyrus plays in sign language processing and especially signed sentence processing. Both Deaf and hearing signing groups, but not hearing nonsigners, showed greater activation in the left inferior frontal gyrus during sentence than signed list processing. The focus of this enhanced activation was in the superior portion of the pars opercularis and the adjacent insula in both groups. Furthermore, the main effect of group indicated that hearing signers engaged this region to a greater extent than hearing nonsigners during BSL perception. Whether the involvement of this region can be partitioned into syntactic and other task‐related processes, as has been argued for spoken sentence processing [Friederici, 2004; Longoni et al., 2005], remains to be seen in future studies in which task demands and sentence complexity are manipulated.
Anterior Temporal Cortex
The left anterior temporal cortex has been implicated in numerous studies of sentence processing by hearing people. In the current study, fMRI data were successfully acquired within the anterior temporal cortex. Moreover, significant activation was detected in this region in hearing nonsigners during sentence perception and in Deaf signers during the perception of both BSL sentences and signed lists. However, anterior temporal activation did not differ between the sentence and signed list conditions in the Deaf group, nor between signers and nonsigners during BSL processing. These data, along with those from our previous study comparing BSL sentences with nonsense sentences [MacSweeney et al., 2004], do not provide support for a role for this region in processing signed sentences. A number of previous studies of spoken sentence processing have also called into question the importance of this region in processing sentences. Using PET, which is not susceptible to signal dropout in this area, Wong et al. [1999] failed to identify anterior temporal activation in hearing subjects listening to spoken sentences. Furthermore, Hagoort et al. [1999] reported no deficits in spoken or written sentence comprehension in epileptic patients in whom a portion of the left anterior temporal lobe had been removed. It is possible that sentence‐related activation in this region reported in previous neuroimaging studies [Scott et al., 2000; Narain et al., 2003; Humphries et al., 2001; Mazoyer et al., 1993; Friederici et al., 2000] is dependent on yet to be determined task and/or stimulus specific factors.
One such stimulus specific factor may be specific to signed languages. Single signs may not always be directly equivalent to their spoken word translations. Although all the stimuli in the lexical condition can be glossed as concrete nouns, many were morphemically complex and may be interpreted as a phrase or short sentence. For example, the sign BOOK4 may be interpreted as “two flat surfaces separate”; KNIFE may be interpreted as “to cut with a long thin implement.” In addition, one may argue that signed sentences are more temporally “compact” than spoken sentences. Although having a complex grammatical structure including inflections and some special moderators in the form of classifiers [see Emmorey, 2002], there are few signed equivalents of many of the independent function (closed class) words that contribute to syntax in many spoken languages (e.g., the, a, to). For example, a BSL translation of “A woman won the competition” is “WOMAN COMPETITION WON.” As a result, subtle differences between the neural systems involved in sentential and lexical processing may be harder to detect in signed than some spoken languages. Comparisons of signed languages with strongly inflected, morphologically dense spoken languages might prove to be a useful route for future research in this area.
Performance Differences Between Deaf and Hearing Native Signers
We had not anticipated the poor performance of hearing native signers on the signed sentence task. Given the impact of this on the interpretation of their data, this must be given careful consideration. All of the hearing‐signing participants had two Deaf parents from whom they had learned BSL as a native language. The majority of these participants (six of the nine) also used BSL in their professions as interpreters or communication workers. On a test of BSL comprehension conducted prior to the scan session, this group performed well and were equivalent to the Deaf native signers. It was on these grounds that we contrasted hearing signers and nonsigners and felt confident in interpreting the differences as being language‐related, since it is extremely unlikely that the hearing native signers did not process the BSL sentences fluently. What, then, could account for their relatively poor performance on the sentence task in the scanner?
One possibility is that hearing signers may be more reliant than Deaf signers on those mouthings derived from spoken language that are found in signed languages (see Sutton‐Spence and Woll [1999] for discussion of BSL, and Nadolske and Rosenstock [2004] for discussion of ASL). English mouthings were omitted from our stimuli to reduce the likelihood that hearing nonsigners would attempt to lipread the signer. The BSL sentences were easy to understand, as demonstrated by the Deaf signers; however, the lack of mouthed information may have led to the poor performance of hearing signers. Although plausible, this argument has little empirical support. Studies that have examined the location of eye‐gaze during sign language perception have shown that it is Deaf signers, not hearing signers, who tend to fixate at or around the location of the mouth [Twyford et al., in press]. Although eye‐tracking studies suggest that this interpretation is unlikely, we are currently conducting an fMRI study in which the different roles of the mouth in BSL are explored in Deaf and hearing native signers in order to address this issue further.
A more likely possibility is that the poor performance of hearing native signers is related to the specific characteristics of the task. The task was not a measure of sentence comprehension or language processing per se; rather, participants were required to detect the occurrence of a semantically anomalous sentence, which appeared only once in each of the five blocks. Six of the nine hearing signers were BSL interpreters or communication workers. Therefore, on a daily basis they systematically and frequently switched between and translated between English and BSL. The fact that these participants were skilled at online, automatic translation may lead to tendencies to “correct” or “repair” an incorrect or incomplete sentence. Thus, they may have missed, or overlooked, anomalous sentences presented in the scanner. Deaf native signers, in contrast, were likely to have come to the in‐scanner task focusing solely on BSL. Whether or not this reasoning is correct will be explored in future studies in which we manipulate the task used in the scanner.
Whatever the reason for the poor performance of the hearing signers, these data raise a concern we have addressed previously [MacSweeney et al., 2004]: In order to further our understanding of the neural systems that support sign language processing, it is vital that we take into account who we study. Hearing native signers differ from Deaf native signers not only in terms of hearing status but also in their “bilingual” status, which is very likely to have an impact on language processes and their underlying neural systems. In addition to these considerations, it appears to be vital to obtain an assessment of sign language proficiency from all participants, especially hearing signers, in future studies considering the neural systems involved in sign language processing.
In summary, we have shown that when compared to isolated lexical items, the comprehension of signed sentences engages a neural system very similar to that associated with spoken sentence processing. The main components of this system are the left inferior frontal gyrus and the left posterior middle and superior temporal gyri. Although the anterior temporal cortex has been specifically implicated in the processing of spoken sentences, this region was involved in processing both signed lists and sentences in the current study, with no evidence of differential activation. Thus, the role of this area in signed sentence processing is unclear. The challenge for the next phase of neuroimaging studies of sign language processing is to design tasks that can differentiate the different components of sentence processing, including syntactic processing, semantic elaboration, and prosody, and determine the effect of different tasks demands on these processes. The current study provides a starting point for the generation of hypotheses for these studies.
Supporting information
This article includes Supplementary Material, available online at http://www.interscience.wiley.com/jpages/1065-9471/suppmat .
Acknowledgements
M. MacSweeney is currently supported by an Advanced Training Research Fellowship from the Wellcome Trust. We thank Judith Jackson and Trudi Collier for their help with this study and all the Deaf and hearing participants.
English Translations of BSL Sentence Stimuli
The boy kicked the ball.
It's my birthday next Sunday.
Try to start the engine.
The man ate the house.*
The woman's hair is blonde.
The glass was full of wine.
The world cup 1998 is in France.
The house had four bedrooms.
I walked for five miles.
The book I read was an apple.*
I have a test next week.
Yesterday I bought a computer.
The book was too heavy to post.
The football is the woman's brother.*
It may snow this winter.
Paris is the capital of France.
The old woman cut the cake.
The orange lamp was broken.
I have two sisters and one brother.
The book climbed the tree.*
The woman gave out the ice cream.
The policeman caught the thief.
The battery in my alarm clock has run out.
The man ate the biscuit through his ear.*
I marked a pile of test papers.
*Denotes anomalous sentence.
English Translations of BSL Single Sign Stimuli
KITE, MOUSE, CAR, BOAT, DOOR, CUP, SHEEP, non‐sense sign, MOON, COMB
FISH, PEN, BRICK, MAN, SPOON, FOX, BAT, CAKE, non‐sense sign, DRESS
COW, BELT, FORK, ROAD, TRAIN, HAT, TREE, SUN, non‐sense sign, SNAKE
DRUM, CAT, BELL, LIGHT, BIRD, SHOE, WATCH, non‐sense sign, KNIFE, PIG
BED, BOOK, FLAG, PRAM, CHAIR, PLATE, COAT, KEY, non‐sense sign, BAG.
Footnotes
In line with convention, “deaf” is used to refer to an audiological condition and “Deaf” to refer to deaf people who use a signed language.
Given the fact that our behavioral measure reflects one response per block, rather than on a trial‐by‐trial basis, it was considered inappropriate to conduct this ANOVA while including performance as a covariate.
Contrasting deaf signers and hearing nonsigners would be inappropriate to address this question since these differ in both BSL knowledge and hearing status.
In line with convention, glosses of signs are written in capital letters.
REFERENCES
- Brammer MJ, Bullmore ET, Simmons A, Williams SC, Grasby PM, Howard RJ, Woodruff PW, Rabe‐Hesketh S (1997): Generic brain activation mapping in functional magnetic resonance imaging: a nonparametric approach. Magn Reson Imaging 15: 763–770. [DOI] [PubMed] [Google Scholar]
- Bullmore E, Brammer M, Williams S, Rabe‐Hesketh S, Janot N, David A, Mellers J, Howard R, Sham P (1996): Statistical methods of estimation and inference for functional MR image analysis. Magn Reson Imaging 35: 261–277. [DOI] [PubMed] [Google Scholar]
- Bullmore ET, Suckling J, Overmeyer S, Rabe‐Hesketh S, Taylor E, Brammer MJ (1999): Global, voxel and cluster tests, by theory and permutation, for a difference between two groups of structural MR images of the brain. IEEE Trans Med Imaging 18: 32–42. [DOI] [PubMed] [Google Scholar]
- Bullmore E, Long C, Suckling J, Fadili J, Calvert G, Zelaya F, Carpenter TA, Brammer M (2001): Colored noise and computational inference in neurophysiological (fMRI) time series analysis: resampling methods in time and wavelet domains. Hum Brain Mapp 12: 61–78. [DOI] [PMC free article] [PubMed] [Google Scholar]
- Corina DP (1998): Aphasia in users of signed languages In: Coppens P, Lebrun Y, Basso A, editor. Aphasia in atypical populations. Mahwah, NJ: Lawrence Erlbaum; p 261–310. [Google Scholar]
- Crinion JT, Lambon‐Ralph MA, Warburton EA, Howard D, Wise RJS (2003): Temporal lobe regions engaged during normal speech comprehension. Brain 126: 1193–1201. [DOI] [PubMed] [Google Scholar]
- Devlin JT, Russell RP, Davis MH, Price CJ, Moss HE, Matthews PM, Tyler LK (2000): Comparing PET and fMRI on a semantic task: applying fMRI to the temporal lobes. Neuroimage 11: 589–600. [DOI] [PubMed] [Google Scholar]
- Embick D, Marantz A, Miyashita Y, O'Neil W, Sakai KL (2000): A syntactic specialization for Broca's area. Proc Natl Acad Sci U S A 97: 6150–6154. [DOI] [PMC free article] [PubMed] [Google Scholar]
- Emmorey K (2002): Language, cognition, and the brain: insights from sign language research. Mahwah, NJ: Lawrence Erlbaum. [Google Scholar]
- Emmorey K (2005): The role of Broca's area in sign language In: Amunts K, Grodzinsky Y, editors. Broca's region. Oxford: Oxford University Press. [Google Scholar]
- Emmorey K, Grabowski T, McCullough S, Damasio H, Ponto LL, Hichwa RD, Bellugi U (2003): Neural systems underlying lexical retrieval for sign language. Neuropsychologia 41: 85–95. [DOI] [PubMed] [Google Scholar]
- Friederici AD (2004): The neural basis of syntactic processes In: Gazzaniga MS, editor. The cognitive neurosciences, 3rd ed. Cambridge, MA: MIT Press. [Google Scholar]
- Friederici AD, Meyer M, von Cramon DY (2000): Auditory language comprehension: An event‐related fMRI study on the processing of syntactic and lexical information. Brain Lang 74: 289–300. [DOI] [PubMed] [Google Scholar]
- Friman O, Borga M, Lundberg P, Knutsson H (2003): Adaptive analysis of fMRI data. Neuroimage 19: 837–845. [DOI] [PubMed] [Google Scholar]
- Friston KJ, Josephs O, Rees G, Turner R (1998): Nonlinear event‐related responses in fMRI. Magn Reson Med 39: 41–52. [DOI] [PubMed] [Google Scholar]
- Hagoort P, Ramsey NF, Rutten GJM, van Rijen PC (1999): The role of the left anterior temporal cortex in language processing. Brain Lang 69: 322–325. [Google Scholar]
- Humphries C, Willard K, Buchsbaum B, Hickok G (2001): Role of anterior temporal cortex in auditory sentence comprehension: an fMRI study. Neuroreport 12: 1749–1752. [DOI] [PubMed] [Google Scholar]
- Indefrey P, Cutler A (2004): Prelexical and lexical processing in listening In: Gazzaniga MS, editor. The cognitive neurosciences, 3rd ed. Cambridge, MA: MIT Press. [Google Scholar]
- Longoni F, Grande M, Hendrich V, Kastrau F, Huber W (2005): An fMRI study on conceptual, grammatical, and morpho‐phonological processing. Brain Cogn 57: 131–134. [DOI] [PubMed] [Google Scholar]
- MacSweeney M, Woll B, Campbell R, Calvert GA, McGuire PK, David AS, Simmons A, Brammer MJ (2002a): Neural correlates of British Sign Language comprehension: spatial correlates of topographic language. J Cogn Neurosci 14: 1064–1075. [DOI] [PubMed] [Google Scholar]
- MacSweeney M, Woll B, Campbell R, McGuire PK, David AS, Williams SCR, Suckling J, Calvert GA, Brammer MJ (2002b): Neural systems underlying British Sign Language and audiovisual English processing in native users. Brain 12: 1583–1593. [DOI] [PubMed] [Google Scholar]
- MacSweeney M, Campbell R, Woll B, Giampietro V, David AS, McGuire PK, Calvert GA, Brammer MJ (2004): Dissociating linguistic and non‐linguistic gestural communication in the brain. Neuroimage 22: 1605–1618. [DOI] [PubMed] [Google Scholar]
- Mazoyer BM, Tzourio N, Frak V, Syrota A, Murayama N, Levrier O, Salamon G, Dehaene S, Cohen L, Mehler J (1993): The cortical representation of speech. J Cogn Neurosci 5: 467–479. [DOI] [PubMed] [Google Scholar]
- Meyer M, Alter K, Friederici AD, Lohmann G, von Cramon DY (2002): FMRI reveals brain regions mediating slow prosodic modulations in spoken sentences. Hum Brain Mapp 17: 73–88. [DOI] [PMC free article] [PubMed] [Google Scholar]
- Mitchell RLC, Elliott R, Barry M, Cruttenden A, Woodruff PWR (2003): The neural response to emotional prosody, as revealed by functional magnetic resonance imaging. Neuropsychologia 41: 1410–1421. [DOI] [PubMed] [Google Scholar]
- Nadolske M, Rosenstock R (2004): A preliminary cross‐linguistic study of word pictures in ASL. Paper presented at the 26 Jahrestagung der Deutschen Gesellschaft für Sprachwissenschaft in Mainz 25–27 February.
- Narain C, Scott SK, Wise RJS, Rosen S, Leff A, Iversen SD, Matthews PM (2003): Defining a left‐lateralised response specific to intelligible speech using fMRI. Cereb Cortex 13: 1362–1368. [DOI] [PubMed] [Google Scholar]
- Neville HJ, Bavelier D, Corina D, Rauschecker J, Karni A, Lalwani A (1998): Cerebral organization for language in Deaf and hearing subjects: biological constraints and effects of experience. Proc Natl Acad Sci U S A 95: 922–929. [DOI] [PMC free article] [PubMed] [Google Scholar]
- Norris D, Wise R (2000): The study of prelexical and lexical processes in comprehension: psycholinguistics and functional neuroimaging In: Gazzaniga MS, editor. The new cognitive neurosciences. Cambridge, MA: MIT Press; p 867–880. [Google Scholar]
- Penhune VB, Zatorre RJ, MacDonald JD, Evans AC (1996): Interhemispheric anatomical differences in human primary auditory cortex: probabilistic mapping and volume measurement from magnetic resonance scans. Cereb Cortex 6: 661–672. [DOI] [PubMed] [Google Scholar]
- Pettito LA, Zatorre RJ, Gauna K, Nikelski EJ, Dostie D, Evans AC (2000): Speechlike cerebral activity in profoundly Deaf people processing signed languages: implications for the neural basis of human language. Proc Natl Acad Sci U S A 97: 13961–13966. [DOI] [PMC free article] [PubMed] [Google Scholar]
- Poizner H, Klima EM, Bellugi U (1987): What the hands reveal about the brain. Cambridge, MA: MIT Press. [Google Scholar]
- Price CJ, Wise RJS, Warburton EA, Moore CJ, Howard D, Patterson K, Frackowiak RSJ, Friston KJ (1996): Hearing and saying — the functional neuro‐anatomy of auditory word processing. Brain 119: 919–931. [DOI] [PubMed] [Google Scholar]
- Rizzolatti G, Craighero L (2004): The mirror‐neuron system. Annu Rev Neurosci 27: 169–192. [DOI] [PubMed] [Google Scholar]
- Schlosser MJ, Aoyagi N, Fulbright RK, Gore JC, McCarthy G (1998): Functional MRI studies of auditory comprehension. Hum Brain Mapp 6: 1–13. [DOI] [PMC free article] [PubMed] [Google Scholar]
- Scott SK, Blank CC, Rosen S, Wise RJ (2000): Identification of a pathway for intelligible speech in the left temporal lobe. Brain 23: 2400–2406. [DOI] [PMC free article] [PubMed] [Google Scholar]
- Stowe LA, Paans AMJ, Wijers AA, Zwarts F, Mulder G, Vaalburg W (1999): Sentence comprehension and word repetition: a positron emission tomography investigation. Psychophysiology 36: 786–801. [PubMed] [Google Scholar]
- Sutton‐Spence RL, Woll B (1999): The linguistics of British Sign Language. Cambridge, UK: Cambridge University Press. [Google Scholar]
- Talairach J, Tournoux P (1988): Co‐planar stereotaxic atlas of the human brain. New York: Thieme Medical. [Google Scholar]
- Twyford HE, Kyle JG, Dye M, Waters D, Canavan MA, Canagarajah CN, Agrafiotis D (in press): Watching the signs: eye‐gaze during sign language comprehension. J Deaf Stud Deaf Educ (in press). [Google Scholar]
- Vandenberghe R, Nobre AC, Price CJ (2002): The response of left temporal cortex to sentences. J Cogn Neurosci 14: 550–560. [DOI] [PubMed] [Google Scholar]
- Wong D, Miyamoto RT, Pisoni DB, Sehgal M, Hutchins GD (1999): PET imaging of cochlear‐implant and normal‐hearing subjects listening to speech and nonspeech. Hear Res 132: 34–42. [DOI] [PMC free article] [PubMed] [Google Scholar]
Associated Data
This section collects any data citations, data availability statements, or supplementary materials included in this article.
Supplementary Materials
This article includes Supplementary Material, available online at http://www.interscience.wiley.com/jpages/1065-9471/suppmat .