

Abstract
Recent reports on functional brain imaging in major depression have lead to an assumption that observed psychopathology might be related to an altered brain functional connectivity. Our hypothesis was that an increase in brain functional connectivity occurs in major depression. As a measure of functional connectivity, the electroencephalogram (EEG) structural synchrony approach was used in 12 medication‐free depressive outpatients and 10 control subjects. Differences in the number and strength of structurally synchronized EEG patterns were compared between groups. In depressive patients the number and strength of short cortex functional connections were significantly larger for the left than for the right hemisphere, while the number and strength of long functional connections were significantly larger for the right than for the left hemisphere. Some of the functional connections were positively correlated with the severity of depression, thus being predictive. These were short‐range anterior, posterior, and left hemisphere functional connections for the alpha frequency band and short‐range anterior functional connections for the theta frequency band. The topology of the most representative functional connections among all patients with major depression indicated that the right anterior and left posterior brain parts may discriminate depressive patients from healthy controls. The obtained data support our hypothesis that there is an increase in brain functional connectivity in major depression. This finding was interpreted within the semantic framework, where different specialization of left (monosemantic context) and right (polysemantic context) hemispheres is functionally insufficient in patients with depression. Hum Brain Mapp, 2007. © 2006 Wiley‐Liss, Inc.
Keywords: structural/operational synchrony, cortex areas, neuronal assembly, semantic framework, brain hemisphere, asymmetry, large‐scale cortical system, distributed property, metastability
INTRODUCTION
Convergent evidence from numerous neuroimaging and electrophysiological studies of major depression stresses a key role for the anterior asymmetry—the so‐called cognitive anterior model of depression [for review, see Davidson,1998]. This model suggests that individual differences in prefrontal asymmetry are most appropriately viewed as diatheses that bias a person's affective style, which in turn modulates the individual's vulnerability to develop depression. Indeed, relatively greater left frontal activity is associated with trait tendencies toward a general appetitive approach or a behavioral activation motivational system, and relatively greater right frontal activity is associated with trait tendencies toward a general avoidance or withdrawal system [Coan and Allen,2003]. Thus, frontal asymmetry (indexed by, e.g., resting electroencephalography (EEG) or magnetoencephalography (MEG)) may serve as an index of risk for a variety of emotion‐related disorders, including major depression and anxiety. However, the finding that formerly depressed but currently euthymic patients demonstrate relatively less left frontal activity than controls who have never been depressed suggests that the depression state might be unrelated to frontal asymmetry [Allen et al.,2004]. Even when such patients experience improvements in their clinical state over time, they still have relative left frontal hypoactivity [Allen et al.,1993; Coan and Allen,2004; Gotlib et al.,1998; Henriques and Davidson,1990].
The classical theory to explain major depression is the “monoamine hypothesis,” which proposes that depression is related to a deficit in monoamines (particularly norepinephrine and serotonin) at critical synapses [Delgado,2000; Moreno et al.,2000]. Although the monoamine hypothesis has been refuted in its most simple form [Stahl et al.,2003], there is one important aspect of the monoamine framework that is relevant to the reasoning of this article. Because serotonin is a widely distributed neurotransmitter in the central nervous system (CNS) [Mann,1999], a disturbance in serotonergic neurotransmission likely affects many different brain regions. Thus, major depression could generally be a disorder of disturbed cellular plasticity, leading to an inadequate relationship between multiple structures and functions of the brain [Kempermann and Kronenberg,2003], including dysregulation between the cortical and subcortical systems [Drevets,2003; Mayberg,2003]. This view is consistent with the modern concept of brain and mind disorders, where disease is considered a process with a change in the balance of autonomy and connectedness of different brain systems that sustain health [for review, see Fingelkurts et al.,2005a; see also Freeman,2003; Friston,2001; Kelso,1995]. Indeed, recent studies of nonlinear dynamic connectivity between brain regions reveal a loss of this dynamic balance in different brain disorders such as schizophrenia [Breakspear et al.,2003], Parkinson's disease [Silberstein et al., 2005], epilepsy [Le Van Quyen et al., 1999], and Alzheimer's disease [Stam et al.,2005]. Functional connectivity, which is defined as the temporal correlation between spatially remote neurophysiological events [Friston et al.,1993], is believed to serve as the mechanism for the coordination (or discoordination) of activity between different neural systems (dynamic cell assemblies across the cortex) [for review, see Fingelkurts et al.,2005b; Friston,2001]. According to recent interpretations, in the dynamic functional connectivity (large‐scale neuronal interactions) between such assemblies, the nonlinear interdependence is mostly reflected [for further discussion, see Breakspear and Terry,2002a; Stam et al.,2003]. The alteration in brain functional connectivity therefore might serve as a contributing factor to the disorganization syndrome (which has long been deemed a condition of impaired cognitive association) in many psychiatric and brain diseases [Dawson,2004; Haig et al.,2000].
In terms of these modern theories, a generally agreed view among the scientific community arose: the major depression might be a disorder with a distributed property of large‐scale cortical (and subcortical) systems with a number of functionally connected cortical regions, including the temporal, frontal, occipital, and parietal lobes [Damasio,1994; LeDoux,1996; Rolls,1999; see also Davidson,2004]. While the frontal cortex is clearly a significant component of the distributed system related to major depression, one should not view it as the only “location” of the complex neuronal processes associated with the depressive state. Rather, it appears that the affective brain systems are implemented in a particular network of functional relations, only part of which is frontal. Recent reports on functional brain imaging in depression have suggested that observed psychopathology might be related to altered or even impaired functional brain connectivity [Davidson et al.,2002]. Nevertheless, this issue has not yet been addressed explicitly.
Considerable differences are present in the functional connectivity between different regions of cortical tissue [Breakspear and Terry,2002a; Fingelkurts and Fingelkurts,2001; Kaplan and Shishkin,2000; Stam et al.,2003], and thus, patterns of functional connectivity that might distinguish between depressed patients and controls should be examined in addition to activation differences. There is little direct evidence in the literature that there should be altered functional connectivity in depressed subjects; however, some studies do give a hint. For example, reports that brain EEG complexity is lower in depressed patients than in controls [Nandrino et al.,1994; Pezard and Nandrino,2001] indirectly imply increased functional interdependence of brain processes reflected in the resting EEG of such patients. These data suggest that one may expect to find higher functional connectivity in a distributed cortex system(s) in depressed patients than in controls.
The aim of the present study was to explore and extend this hypothesis of functional connectivity reorganization during major depression using EEG frequency domain analysis. As a measure of functional connectivity, we used the EEG/MEG structural synchrony (SS) approach [Fingelkurts et al.,2003a,b,2004a,b; Kaplan et al.,1997,2005]. Structural EEG/MEG synchrony refers to a more general class of nonlinear interdependencies between dynamic systems in which rapid transients in one system can be directly mapped to a second system [Kaplan et al.,2005]. In general, this measure belongs to the class of methods estimating synchronization behavior between nonidentical (structurally nonequivalent) systems [for a detailed discussion on this and other classes of synchrony methods, see Boccaletti et al.,2002]. The main benefit of the SS method over the ones quantifying coherence, correlation, and phase synchronization is a conceptual one. Contrary to findings of previous EEG studies on functional connectivity, the SS measure is well suited to extract information about discrete brain operations from EEG recordings and to estimate the level of inherent synchrony of these operations appearing simultaneously and locally in different cortical areas [for further discussion, see Fingelkurts et al.,2005b]. It can therefore quantify a broader range of coordination phenomena, especially metastable and nonstatic nonlinear phenomena, which cannot be captured by phase synchronization‐based metrics [Hadjipapas et al.,2005]. Phenomenologically, this type of EEG structural synchrony corresponds to the operational synchrony process: transient synchronization of operations executed by distant neuronal assemblies [Fingelkurts and Fingelkurts,2003,2005]. At the EEG level, such brain operations are reflected in the form of quasi‐stationary segments in corresponding brain locations/sites [Kaplan,1998; Kaplan et al.,2005]. The segment sequences in different cortical locations have been shown to be synchronized [Fingelkurts et al.,2003a,b,2004a,b], forming short‐term metastable topological combinations underlying mental and cognitive states [for a complete argument, see Fingelkurts and Fingelkurts,2001,2004; Kaplan,1998; Kaplan et al.,2005]. In this metastable regime of brain dynamics, the interdependence of cortical areas is balanced between integrating and segregating activities [Kelso,1995; Bressler,2002] through a succession of global states determined by its coordination dynamics [Bressler and Kelso,2001] and abrupt state transitions [Fingelkurts and Fingelkurts,2001; Friston,2000]. This analysis provides a relevant level of description of nonlinear functionally connected cortical systems, which we believe would be altered in patients with major depression.
SUBJECTS AND METHODS
Subjects
Twelve medication‐free depressed outpatients (seven males, five females, mean age 43 ± 14 years, all right‐handed) participated in the study. All subjects underwent a Structured Diagnostic Interview (SCID) for DSM‐III‐R [First et al.,1994] and met the DSM‐III‐R criteria for a major depressive episode. All patients had a score of at least 18 on the 17‐item Hamilton Depression Rating Scale (HAM) [Hamilton,1960] at the time of the study procedure; the mean HAM score was 24 ± 4. The subjects were otherwise in good physical health, as determined by a physical examination and laboratory evaluation, including a complete blood count, glucose and hepatic enzyme measurements, and renal and thyroid analyses. Patients were excluded from the study if they had a current DSM‐III‐R axis I diagnosis other than major depression, a history of mania, a history of schizophrenia, alcohol or drug dependence within 5 years, or showed active signs of suicidal ideation. Before enrollment in the study, patients were allowed to have taken any antidepressants for no more than 2 weeks and not within 3 weeks of the day of registration.
Ten sex‐ and age‐matched nonsmoking healthy controls (five males, five females, mean age 42 ± 12 years, all right‐handed) also participated. Before inclusion, the control subjects underwent a medical examination and were screened for depression. Control subjects had no DSM‐III‐R axis I diagnosis in the SCID evaluation [First et al.,1994], and none had a significant medical illness. All were free from psychotropic medication, and none had a history of CNS disease. The mean HAM score was 0.5.
All participants gave written informed consent before enrolling and the study protocol was approved by the institutional (HUCH) Ethics Committee. The EEG recording was started 5 min after each subject adapted to the chamber.
Trial Design
Following electrode placement and instrument calibration, each subject was seated in a comfortable chair in a dimmed registration room and the experimental procedure was explained. To reduce muscle artifacts in the EEG signal, subjects were instructed to assume a comfortable position and to avoid movement. Subjects were instructed further to look straight ahead (although eyes were closed) and to avoid unnecessary eye movements. When subjects are awake and resting with their eyes closed, a physiological baseline of the human brain (the so‐called “resting state”) is observed [Gusnard and Raichle,2001]. This state is intrinsically constrained by the default functionality, which is spontaneous and virtually continuous and is crucial for normal human performance, despite largely operating in the background [Raichle and Gusnard,2005].
Subjects' behavior was observed on a TV monitor throughout the experiment. Subjects underwent EEG registration, 20 minutes in duration (eyes closed). The rationale for such a long EEG registration was the following: since the EEG parameters vary tremendously between different subjects [Burgess and Gruzelier,1997; Homan et al.,1987], a long EEG registration is required to improve the statistical consistency of data.
EEG Registration
All recordings were performed in a magnetically and electrically shielded room (Euroshield, Eura, Finland) in the BioMag Laboratory, Helsinki University Central Hospital. Spontaneous electrical brain activity was recorded with a 60‐channel EEG data acquisition system (Neuromag Vectorview, Helsinki, Finland) with a frequency band of 0.06–86 Hz (sampling rate 300 Hz). EEG recordings were done simultaneously with MEG; however, the MEG data are not presented in this report.
The EEG was recorded with an electrode cap according to the International 10/20 extended system, and the nose electrode was used as a reference. The impedance of recording electrodes was monitored for each subject with an impedance meter prior to data collection; this was always below 5 kΩ. Vertical and horizontal electro‐oculograms were recorded. Epochs containing artifacts due to eye movements, significant muscle activity, and movements on EEG channels were automatically rejected and rewritten. The presence of an adequate signal was determined by visually checking each raw signal on the computer screen after automatic rejection of artifacts.
Data Processing
A full EEG stream free from artifacts contained an 18 to 20‐minute continuous signal (eyes closed) for depressed and control subjects. EEG data were split into two distinct groups: “depressive” and “control.” Further, data processing was performed separately for each 1‐minute portion of the signal. Due to the technical requirements of the tools later used to process the data, EEGs from 20 electrodes (F7/8, Fz, F3/4, T3/4, C5/6, Cz, C3/4, T5/6, Pz, P3/4, Oz, O1/2) were analyzed with a converted sampling rate of 128 Hz.
After resampling and prior to the nonparametric adaptive segmentation procedure, each EEG signal was bandpass‐filtered (Butterworth filter of the sixth order) in the theta (5–7 Hz) and alpha (8–13 Hz) frequency bands. Phase shifts were eliminated by forward and backward filtering. These frequency bands were chosen because it has been well documented that resting alpha asymmetry determines one's risk for certain affective disorders, such as major depression and anxiety [for review, see Coan and Allen,2004; Davidson,2004], while cortical theta activity is considered to serve as a gating function on information processing in the limbic region, particularly in the anterior cingulated cortex (ACC) [Pizzagalli et al.,2003]. The ACC has been postulated to play an important role in the pathophysiology of depression [Davidson et al.,2002].
Adaptive‐Level EEG Segmentation
Each 1‐min EEG (n = 233 for depressives, n = 189 for controls) was segmented using the method for the rapid transition processes (RTP) identification in the EEG amplitude (RTPseg tool). RTPseg is an advanced clean reimplementation of SECTION tool [for details, see Fingelkurts et al.,2003a,b; Kaplan et al.,2005]. RTPseg algorithms overcome various numerical limitations that existed in its predecessor and modify and extend its functionality. Here we are highlighting only the most important aspects (Fig. 1). The RTPseg method is based on the automatic selection of level conditions in accordance with a given level of the probability of “false alerts” and carries out simultaneous screening of all EEG channels. RTPs are the markers of boundaries between quasi‐stationary segments in EEG.
Figure 1.
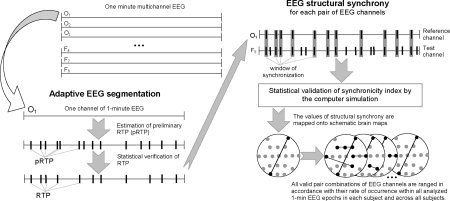
Schematic illustration of the steps in the methods used. Further explanations are provided in the text.
The following steps were taken to estimate RTPs: 1) Comparisons were made between ongoing EEG amplitude absolute values averaged in two windows (first window ≪ second window), both starting from the first data point. 2) If the absolute maximum of the averaged amplitude values in the small window is less or equal to the averaged amplitude values in the large window, then the hypothesis of EEG homogeneity is accepted. 3) If the absolute maximum of the averaged amplitude values in the small window exceeds the averaged amplitude values in the large window, according to the threshold of “false alerts”—first condition (the Student criteria)—its time instant becomes the preliminary estimate of the RTP. 4) A second condition must be fulfilled to eliminate “false alerts” associated with possible anomalous peaks in the amplitude; the five points of the digitized EEG following this preliminary RTP must have a statistically significant difference between averaged amplitude values in the small and large windows (Student's t‐test). 5) If these two criteria are met, then the preliminary RTP is assumed to be correct (Fig. 1). 6) Then each of the windows shifts by one data point from the actual RTP and the procedure is repeated.
With this technique, the sequence of RTPs with statistically proven (P < 0.05, Student's t‐test) time coordinates is determined for each EEG channel and for each 1‐min epoch individually. The theoretical concepts underlying this analysis are described elsewhere [Fingelkurts and Fingelkurts,2001,2005; Fingelkurts et al.,2005b; Kaplan,1998; Kaplan and Shishkin,2000].
Calculation of Structural Synchrony Index
The index of structural synchrony (ISS) was calculated through the estimation of synchronization of RTPs between different EEG channels (RTPsyn tool). RTPsyn is an advanced clean reimplementation of the JUMPSYN tool [for details, see Fingelkurts et al.,2005b; Kaplan et al.,1997,2005]. Its algorithms overcome various numerical limitations that existed in its predecessor and modify and extend its functionality. RTPsyn reveals functional (operational) interrelationships between cortical sites different from those measured by correlation, coherence, and phase methods. As the details of this technique is beyond the scope of this article, we will only concentrate on some essential aspects (Fig. 1). In brief, each RTP in the reference EEG channel (the channel with the minimal number of RTPs from any pair of EEG channels) was surrounded by a short “window” (ms). Any RTP from another (test) channel was considered to coincide if it fell within this window. The ISS for pairs of EEG channels can be estimated using this procedure [for details, see Fingelkurts et al.,2003a,b; Kaplan et al.,2005]:
- snw
total number of RTPs in all windows (window for synchronization, ms) in the test channel;
- slw
total length of EEG recording (in data points) inside all windows in the test channel;
- snr
total number of RTPs outside the windows (window for synchronization, ms) in the test channel;
- slr
total length of EEG recording (in data points) outside the windows in the test channel.
To arrive at a direct estimate at the 5% level of statistical significance (P < 0.05) of the ISS, computer simulation of RTPs synchronization was undertaken (Fig. 1) based on random shuffling of time segments marked by RTPs (500 independent trials). As a result of this procedure, the stochastic level of RTP coupling (ISSstoh), and the upper and lower thresholds of ISSstoh significance (5%) were calculated. The ISS tends toward zero, where there is no synchronization between the EEG segments, or has positive or negative values, where such synchronization exists. Positive values indicate “active” coupling of EEG segments (synchronization of EEG segments are observed significantly more often than expected by chance at P < 0.05, random shuffling, computer simulation), whereas negative values indicate “active” decoupling of segments (synchronization of EEG segments are observed significantly less than expected by chance at P < 0.05, random shuffling, computer simulation). From a qualitative perspective, the coupling of EEG segments corresponds to the phenomenon of synchronization of brain operations (or operational synchrony, OS) [Fingelkurts and Fingelkurts,2001,2004, Fingelkurts and Fingelkurts,2005].
Statistics
Differences in the number and strength of structurally synchronized (SS) EEG patterns between depressive and control groups were assessed using the Wilcoxon t‐test as in the majority of coherence studies [for overview, see Rappelsberger,1998; Weiss and Rappelsberger,2000]. All SS EEG pattern pairs were divided into nine categories (shortleft/right, shortanterior/posterior, longleft/right, longanterior/posterior, longinterhemispheric) separately for the theta and alpha frequency bands. Pairs of EEG electrodes, which have one or more electrodes between “members” of the pair, were classified as long‐range connections [according to Weiss and Rappelsberger,2000]. Since the absolute number of possible SS EEG pairs within each category was different, the proportion of each SS EEG pair was calculated.
Separate computer maps of the ISS values were created for each subject and for each 1‐minute EEG. The problem of multiple comparisons between maps cannot easily be overcome due to the large number of electrode pairs [Rappelsberger and Petsche,1988] in the SS maps. This problem is common to all studies that require multiple comparisons between maps [Razoumnikova,2000; Weiss and Rappelsberger,2000]. The comparisons that have been made should therefore be considered descriptive rather than confirmatory [Stein et al.,1999]. To ensure valid results, as we have in our previous work [Fingelkurts et al.,2003a,b,2004b], the SS EEG pairs were only considered relevant if they consistently appeared in most of the EEG epochs and subjects (85%–100%) in the same experimental group (“depressive” or “control”).
There are several potential methodological limitations of the approaches used in the present study that should be addressed: (1) the volume conduction, which is the main obstacle in interpreting EEG/MEG data in terms of brain connectivity; (2) the method of reshuffling EEG segments to generate full EEG recordings under the null hypothesis solves the problem of specifying a sampling distribution when the law of the time length of EEG segments is not known. But this method has an implicit assumption: the independence (or lack of autocorrelation) between the length of each segment (i.e., the length of segment n should not be correlated with the length of segment n−1). The presence of autocorrelation will lead to an excess of falsely described connections; (3) although being quite informative, the ISS will be dependent on the global density of RTPs in the 1‐minute epoch even under no real connectivity. Thus, although not crucial, it might be desirable to develop or improve the ISS to a normalized index; (4) each individual EEG recording was arbitrarily divided into 1‐min epochs, leading to sample sizes of n = 233 for depressives and n = 189 for controls. However, there are two potentially important issues here. First, are the different 1‐minute EEGs from the same individuals as different as 1‐minute EEGs from different individuals? If not true, then such EEGs cannot be considered a sample of independent observations, and the Wilcoxon test is not the best choice. Second, the division into 1‐min epochs is arbitrary; depending of the epoch length used, the degrees of freedom available to the Wilcoxon test will vary, as will probably the results as well; (5) only the connections present in more than 85% of the individually analyzed 1‐min EEGs were reported. A frequency higher than 85% will depend on the quality of the statistical test used to identify significant ISS, and on the potential effect of multiple comparisons.
In the Appendix we analyze these limitations and provide several considerations that argue against each of them.
RESULTS
Number of Structurally Synchronized EEG Pairs
Figure 2 (top row) illustrates the number of structurally synchronized (SS) EEGs registered from different cortical areas (estimated by an index of structural synchrony, ISS) in depressed and control subjects. One can see that the number of SS EEG pairs was significantly larger (P < 0.05) in patients with major depression than in healthy controls for all short functional connections. This was the case for both the alpha and theta frequency bands. However, long‐range SS EEG pairs had different behavior in the alpha and theta frequency bands. Thus, while for the alpha band the number of longposterior SS EEG pairs was larger in depressed patients than in controls, in the theta band the number of longleft and longanterior SS EEG pairs was lower in patients with major depression than in healthy controls (Fig. 2, top row).
Figure 2.
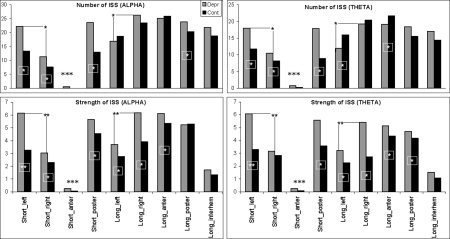
The number (top row) and strength (bottom row) of structurally synchronized (SS) EEG pairs (indexed by the index of structural synchrony) for each of the nine categories in “depressive” and “control” groups separately for the theta and alpha frequency bands. The x‐axis displays the labels of the categories for EEG pair connections. The y‐axis displays the percentage from the maximum number of the EEG pair connections within each category (top row), and displays the mean values of ISS for EEG pair connections within each category (bottom row). Depr, “depressive” group (n = 233 EEGs); Cont, “control” group (n = 189 EEGs). *P < 0.05, **P < 0.01, ***P < 0.001.
Noteworthy is the significantly low number of shortanterior SS EEG pairs in both depressed and control subjects for the alpha and beta frequency bands. Discussion of this lies, however, beyond the scope of the present article (which only explores the difference between depressive and healthy subjects).
Strength of Structurally Synchronized EEG Pairs
The strength of the SS EEG pairs can be estimated from the values of the ISS: the higher this value, the greater the strength. The main finding was the absence of negative ISS values in all combinations of EEG channels for the theta and alpha frequency bands.
Figure 2 (bottom row) illustrates the mean values of ISS for the nine SS EEG pair categories in patients with major depression and healthy controls, separately for the alpha and theta EEG frequency bands. The ISS values were significantly higher in depressed patients than in controls in virtually all categories (P < 0.01–0.001 for different categories), except the shortanterior and longinterhemispheric ones. This dependence was observed in both alpha and theta frequency bands (Fig. 2, bottom row).
Interestingly, in both frequency bands, identical dependence was found only in depressed patients: the number and strength of SS EEG pairs were significantly larger (P < 0.01–0.001) for the shortleft than for the shortright category, while they were significantly smaller (P < 0.01–0.001) for the longleft than the for longright category (Fig. 2).
Significantly low ISS values were observed for the shortanterior category in both depressed and control subjects for the alpha and beta frequency bands. However, discussion of this finding lies beyond the scope of this article.
Number and Strength of SS EEG Pairs vs. Depression Severity
Significant Spearman correlations were found for some SS EEG pair categories (Table I). Only short SS EEG pair categories (i.e. the shortanterior category for the theta frequency band, and the shortanterior, shortposterior, and shortleft categories for the alpha frequency band) were significantly correlated with major depression severity scores (assessed by HAM): the greater the number and strength of SS EEG pairs, the more severe the depression.
Table I.
Significant Spearman correlations between the number and strength of structurally synchronized EEG pairs and depression severity
| R | t(N‐2) | P | |
|---|---|---|---|
| ISS/Theta | |||
| Short‐Anter | 0.71 | 2.83 | < 0.02 |
| ISS/Alpha | |||
| Short‐Anter | 0.7 | 2.74 | < 0.03 |
| Short‐Poster | 0.7 | 2.54 | < 0.03 |
| Short‐Left | 0.67 | 2.54 | < 0.03 |
| Number/Theta | |||
| Short‐Anter | 0.65 | 2.42 | < 0.04 |
| Number/Alpha | |||
| Short‐Anter | 0.7 | 2.74 | < 0.03 |
| Short‐Poster | 0.7 | 2.78 | < 0.02 |
ISS, index of structural synchrony; Number, number of structurally synchronized EEG pairs.
Topology of EEG Structural Synchrony (Functional Connectivity)
To assess the principal topological picture of EEG SS, all pair combinations of EEG channels exhibiting statistically proven SS (P < 0.05) were ranked according to their rate of occurrence within all analyzed 1‐min EEG epochs for each subject and across all subjects. Only the most frequently found combinations (≥85% occurrence in all epochs and all subjects) were analyzed further.
Figure 3 displays these reliable and statistically significant (P < 0.05) ISS values mapped onto brain schemata as connecting lines between corresponding EEG sites in patients with major depression and control subjects for the theta and alpha frequency bands.
Figure 3.
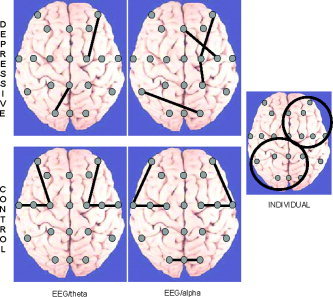
The stable statistically significant (P < 0.05) values of the index of structural synchrony (ISS) in the theta and alpha frequency bands for depressed and control subjects. The ISS values that occur in more than 85% of repetitions across all subjects and epochs (n = 233, EEGs for depressives; n = 189, EEGs for controls) are mapped onto schematic brain maps as connecting lines between the EEG channels involved. EEG labels: first level of electrodes from the top—F7, F8; second—F3, Fz, F4; third—T3, C5, C3, Cz, C4, C6, T4; fourth—T5, P3, Pz, P4, T6; fifth—O1, Oz, O2. The insert on the right shows the brain map of typical functional connections for individual depressed subjects. Two circles indicate the locations of functional connections found in individual subjects. [Color figure can be viewed in the online issue, which is available at www.interscience.wiley.com.]
Figure 3 indicates that maps of synchronized cortical areas (indexed by ISS) differed between the major depression and control groups. SS EEG pairs in control subjects were absolutely symmetrical for both the theta and alpha frequency bands. In depressive patients, by contrast, the SS EEG pairs were asymmetric: they were concentrated along the right anterior and left posterior brain areas (Fig. 3). Although theta and alpha activities had similar topographies of synchronized cortical areas, the alpha frequency band had more couplings in the right hemisphere.
If we consider individual data on SS EEG pairs in depressive patients, then the SS topography was identical for the most frequent SS combinations (see insert on the right‐hand side of Fig. 3). In all subjects with major depression, all individual SS EEG pairs were localized along the right anterior and left posterior brain areas.
DISCUSSION
Electrophysiological findings in the present study support our hypothesis that depressive patients indeed have a state of a strengthened functional connectivity of brain processes in distributed neuronal networks compared with healthy controls. The results were obtained from EEG recordings of medication‐free patients under resting conditions with their eyes closed. The use of EEG recordings during a resting state should be clarified, since such a state can be considered less controlled than evaluation conditions with specific cognitive activation tasks. A growing body of research has illustrated the important influence of resting (or prestimulus) EEG on the cognitive and electrophysiological consequences of stimulus presentation [Haig and Gordon,1998]. Resting‐state EEG data appear to have a rich nonstationary and nonlinear structure [Fingelkurts and Fingelkurts,2001; Kaplan,1998; Stam et al.,2003], presumably reflecting the current functional state of neuronal masses rather than a random process [Fingelkurts et al.,2003c; Livanov,1984] and the processing of an internal mental context (top‐down processing) [von Stein et al.,2000]. In addition, during resting EEG recording the confounding effects of visual scene, instructions, and task are avoided. The resting condition thus permits assessment of “pure” brain activity (with its momentary fluctuations) over a defined period [Koenig et al.,2002]. To investigate the EEG fluctuations/events, adaptive segmentation was applied (see Subjects and Methods). Using this approach, it becomes possible to parse each EEG location into a series of distinct segments which defined as time periods that remain relatively stable in the millisecond time‐scale and that are separated by rapid transitional periods [Fingelkurts and Fingelkurts,2001; Kaplan et al.,2005].
EEG segments have been proposed to correspond to basic blocks of information processing [Fingelkurts and Fingelkurts,2003,2005; Kaplan et al.,1997,2005], which are subserved by transient neuronal assemblies [Fingelkurts et al.,2004b; Kaplan and Borisov,2003]. Neuronal assembly is defined as a distributed group of neurons or neural masses for which correlated activity persists over substantial time intervals [Breakspear and Terry,2002b; Nunez,2000]. In the present study, the simultaneous activity of neuronal assemblies was assessed through synchronization of EEG segments registered from different cortical locations using the index of EEG structural synchrony (see Subjects and Methods).
Number and Strength of Cortical Functional Connections
In the present study we have provided evidence that the depressive state of patients under resting conditions results in a widespread and significant increase in inter‐area functional connectivity, mostly for short‐range distances, as well as a significant increase in the strength of such functional short‐ and also long‐range connections (Fig. 2). There is little direct evidence in the literature that there should be an increase in functional connectivity in depressed subjects. However, some recent reports indicate that EEG complexity is lower in depressed patients than in controls [Nandrino et al.,1994; Pezard and Nandrino,2001]. These findings indirectly imply increased functional interdependence of brain processes reflected in the resting EEG of depressed patients. Our data support this hypothesis. Another explanation can be found in the relations between serotonin and GABAergic signaling. Activation of serotonin signaling has been shown to suppress GABAergic inhibition [Feng et al.,2001]. Thus, in serotonin‐deficit diseases, such as major depression, GABAergic signaling in the cortex may be exaggerated. Since serotonin is a widely distributed neurotransmitter in the CNS [Mann,1999], a disturbance in serotonergic neurotransmission would likely lead to an increase in GABAergic signaling in many different brain regions. In our previous work with the GABAA agonist lorazepam, we demonstrated that an increase in GABAergic signaling does result in a corresponding increase in the number and strength of functional connections between many cortical areas, as measured by EEG structural synchrony [Fingelkurts et al.,2004a]. Our earlier findings are thus consistent with the results presented here. However, in the present study long‐range left and long‐range anterior functional connections within the theta domain were reduced in depressive patients compared with healthy controls, possibly indicating functional impairment in patients' limbic system and ACC, which have been shown to be related to theta activity in the human cortex [Pizzagalli et al.,2003].
A new and interesting aspect of the present study is the asymmetry in functional connections and in their strength, which was found in patients with major depression but not in healthy controls. The number and strength of short functional connections were significantly larger for the left than for the right hemisphere, while the number and strength of long functional connections were significantly larger for the right than for the left hemisphere (see Fig. 2). These findings allow a more specific interpretation of the results. These data may be interpreted within the recent framework of major depression being based on semantic context [Rotenberg,2004]. According to this framework, the left hemisphere (formal logical thinking) organizes any information (whether symbolic or iconic) in an unambiguous and strictly ordered monosemantic context, and this process in healthy subjects requires an additional activation of the brain cortex in order to restrict natural relationships between objects and events. Indeed, the left hemisphere has been shown to be biased toward the processing of close lexical semantic relationships and activates only closely related information or may even be restricted to the dominant meaning [Chiarello et al.,1990; Chiarello,1998]. Perhaps the short‐range functional connections in the left hemisphere cortex obtained here (Fig. 2, controls) may accompany such close relationships at the semantic level. Indeed, it has been proposed that mental representations and contents are coordinated by neuronal connections [Damasio,2000].
On the contrary, the right hemisphere organizes any information in the integral but ambiguous polysemantic context based on the simultaneous capture of numerous natural relationships between elements of information [for review, see Rotenberg,2004]. For example, the right hemisphere has been demonstrated to be able to produce a much broader network of associations than the left hemisphere [Beeman et al.,1994], and to immediately activate various meanings associated with a word [Coney and Evans,1999]. In healthy subjects, this process does not require any additional activation [Rotenberg and Arshavsky,1997]. Taking into consideration our data, one can speculate that the long‐range functional connections in the right hemisphere cortex (see Fig. 2, controls) may accompany such a polysemantic context. Additional convergent data supporting this view may be found in Pulvermüller [1999].
What happens to functional connectivity when the subject is in a depressive state? In such a state, neither hemisphere is able to deal with information in an appropriate way [Siegle,1999], and as a result, they become informationally activated or overloaded [Rotenberg,2004]. This may be interpreted as some level of functional insufficiency in both hemispheres during the depressive state. Such a view is supported by the finding of significant whole‐cortex hypometabolism in patients with major depression [Martinot et al.,1990]. We suggest that the unusual and significant increase in the number and strength of short‐range functional connections in the left hemisphere of depressive patients and the analogous increase in long‐range connections in the right hemisphere (Fig. 2, depressives) are signs of the adaptive compensation of the brain functional insufficiency in an attempt to achieve an adequate semantic context through a new metastable brain state [Fingelkurts et al.,2005a]. In the process of such overcompensation, connections between neuronal representations of negative affects and semantic concepts probably become strongly activated. This hypothesis found indirect confirmation within a semantic network model [Collins and Loftus,1975; LeDoux,2003] in which both semantic and affective features are represented as nodes in the network. It was found that people who are depressed suffer from strongly activated connections between negative affective nodes and multiple semantic concepts, creating feedback loops that maintain depressive affect and cognition [Fossati et al.,2003; Ingram,1984; Moore et al.,2001]. Increased functional connectivity in the brain may be a possible mechanism underlying the model's performance. Depressed individuals tend to see even positive information as negative because it becomes associated with personally relevant negative information [Siegle,1999]. Indeed, an automatic, unintentional use of negative social constructs in self‐perception was reported in depressed individuals [Bargh and Tota,1988]. This type of new metastable brain state bias may help to maintain the depressive state.
The question then arises, what core cortical areas are abnormally activated and functionally connected within a depressive state?
Topological Aspects of Functional Connectivity in Depressed Patients
The most representative and stable topological combinations of functionally synchronized areas were located in the right frontal and left parietal‐occipital cortex poles (Fig. 3). In the framework of the functional connectivity concept, “activity” is understood as the involvement of distributed neuronal assemblies in joint or cooperative performance [Fingelkurts and Fingelkurts,2001,2005; Kaplan and Shishkin,2000]. Stability of the functional topography in the activity of the theta and alpha frequency bands probably reflects the intrinsic spatial features of those neuronal assemblies, the mutual metastable activity of which was altered for maintenance of depressive brain states. Generally, the data presented here are supported indirectly by findings on brain complexity, with sad mood being shown to be a function of simultaneous activation of the left posterior and right anterior cortical areas [Sarbadhikari and Chakrabarty,2001]. Similar data were obtained from EEG mapping: in depression, the right anterior and left posterior cortical parts were hyperactivated [Strelets et al.,1996]. Tucker and Dawson [1984] reported also that the parietal and inferior temporal cortical regions were more activated (indexed by coherence measure) in the left hemisphere of depressive patients. Perhaps combined activation of right anterior and left posterior networks of functionally connected cortices (Fig. 3) could specifically discriminate depressive patients from healthy controls. In light of our discussion, such topography of representative functional connections in depressive patients may serve as a marker for the disordered neuronal representations and regulations of mood, emotion, and semantics that depressed individuals tend to hold [Fossati et al.,2003; Moore et al.,2001]. The alpha domain having more typical functional connections (mostly of a long‐range distance) than the theta band is also consistent with a semantic framework. It has been well documented that alpha synchrony is maximal in situations where cortical processes are not subject to exogenous stimuli but are driven by such free‐floating and spontaneous input as thoughts and mental images [Von Stein and Sarnthein,2000].
The most representative cortical areas involved in functional connectivity in depressed subjects, obtained in the present study, roughly correspond to cortices that are supposed to be responsible for modality‐specific sensory patterns, for implicit memories (autobiographical self), and for relations between categories and abstract concepts [Damasio,2000]. This distributed network for semantic and conceptual information seems to be significantly altered in depressed patients [Atchley et al.,2003] and represents a disordered metastable brain state [Fingelkurts et al.,2005a]. We suppose that the particular topography of typical functionally connected cortical areas that we found in depressive subjects (Fig. 3) reflects the convergence cortex zones that are simultaneously active, and which together are likely responsible for the depressive state. The small number of such typical functional connections (representative of all patients and the majority of analyzed 1‐min EEG epochs) obtained in the present study indicates the possibility of high interindividual variability in functional connections. Studies of larger numbers of more homogeneous patients under similar conditions are thus warranted.
Dependence of Depression Severity on the Number and Strength of Functional Connections
Our data also indicate that some of the functional connections are predictive of the severity of depression. We found that the greater the number and strength of short‐range anterior and posterior functional connections in depressive patients, the more severe their depressive state (Table I). The short‐range left functional connections were also related to the severity of depression. This was observed for the alpha frequency band. Alpha activity asymmetry in resting EEG has long been known to be associated with affect, emotions, and depressive states in patients [for review, see Cacioppo,2004; Coan and Allen,2004]. Most evidence for alpha activation asymmetry comes from studies of the alpha power spectrum. The higher the alpha power, the lower the brain activity. However, our previous study clearly showed that the periods of alpha desynchronization and synchronization do not mark episodes of “active work” and “rest state,” respectively, but rather are signs of switching in the dynamics of cortical operations, which are equally active but differ in their processing/operational architecture [Fingelkurts et al.,2004b]. Here, the search for simultaneous switches in the activity of local cortical neuronal assemblies is challenging [Kaplan and Shishkin,2000]. These synchronous changes in the operational activity of many brain areas constitute the essence of functional connectivity [Fingelkurts et al.,2005b], which is defined as the temporal correlation between spatially remote neurophysiological events [Friston et al.,1993]. Generally, results on brain connectivity within the alpha frequency domain in depressed patients are fragmentary and inconsistent: such research has mostly been conducted using coherence analysis, which has numerous limitations [see Fingelkurts et al.,2004a; Hadjipapas et al.,2005; Kaplan et al.,1997; Kaplan and Shishkin,2000]. However, the short‐range functional connections within the alpha band in the anterior, posterior, and left parts of the cortex, as described in the present study, are likely correlated with major depression and follow the expression of severity of this disorder.
In contrast to the alpha, within the theta frequency band only anterior short‐range functional connections appeared to be responsible for major depression severity, i.e., the number and strength of such connections were significantly correlated with the severity of the depressive state (Table I). This finding is possible to interpret in light of the fact that human cortical theta activity is mostly determined by the activity of limbic regions, the ACC in particular [Pizzagalli et al.,2003]. These brain regions in turn possess extensive connections with anterior cortical areas [Mayberg,1997]; thus, the anterior theta frequency domain should be indicative of the state of ACC and limbic regions. In this respect, increased functional connectivity within the theta frequency domain in the anterior cortex may be a sign of an adaptive, compensatory reaction to the decreased ACC activity and general insufficiency of the limbic system typically reported for depressed patients [Bench et al.,1992; Drevets et al.,1997; Ito et al.,1996; Mayberg et al.,1994]. Based on these findings, we may conclude that anterior short‐range functional connections within the theta frequency band seem to play an important role in the pathogenesis of major depression and in the manifestation of its severity.
Taken together, these data emphasize that although frontal areas are critical for distinguishing between depressed patients and controls, these frontal areas are part of a larger metastable network(s) of functionally connected neuronal assemblies, and other parts of this network(s) are also crucial for understanding how the brain implements emotional and motivational processes. A similar conclusion has been reached by most major neuroscientists in the field [Damasio,1994; LeDoux,1996; Rolls,1999; see also Davidson,2004].
CONCLUSIONS
The results of the present study support our hypothesis that an increase in brain functional connectivity occurs in major depression. However, this functional connectivity has certain peculiarities. The number and strength of short cortex functional connections were significantly larger for the left than for the right hemisphere, while the number and strength of long functional connections were significantly larger for the right than for the left hemisphere. These findings were interpreted within the semantic framework, where an observed increase in respected functional connections is adaptive, compensated, and is due to different specializations of the left (monosemantic context) and right (polysemantic context) hemispheres, both of which are functionally insufficient in patients with major depression. The ability to form an adequate semantic context means the ability to integrate both mono‐ and polysemantic contexts into a cohesive experience, thus helping subjects to experience themselves as “unity” integrated into interrelations with other humans and the world. This integration is the most important feature of the subject's mental life and emotional balance [Rotenberg,2004]. Distortion of such integration results in changes in adaptive compensative mechanisms, with an increase in functional connectivity being a particularly important one.
We also found that some of the functional connections were positively correlated with the severity of depression, thus being predictive. These were short‐range anterior, posterior, and left hemisphere functional connections for the alpha frequency band, and short‐range anterior functional connections for the theta frequency band. The greater the number and strength of these connections, the more severe the depressive state.
The topology of the most representative functional connections among all patients with major depression obtained in the present study indicate that right anterior and left posterior brain parts may discriminate depressive patients from healthy controls. According to our interpretation, the particular spatial distribution of these functional connections may reflect the metastable dysregulation between cortical and subcortical systems, and the disordered representation of semantics that depressed individuals tend to hold [Fossati et al.,2003; Moore et al.,2001]. Although our interpretations are supported by current results, they require further development.
Acknowledgements
The authors thank Carlos Neves (Computer Science specialist) for programming, technical, and IT support.
METHODOLOGICAL ASPECTS
Problem of Volume Conduction
Although it is often claimed that volume conduction is the main obstacle in interpreting EEG data in terms of brain connectivity, we have shown through modeling experiments that the values of the ISS are sensitive to the morpho‐functional organization of the cortex rather than to the volume conduction and reference electrode [for details, see Kaplan et al.,2005]. In fact, volume conduction should lead to spurious correlations that would be equally represented across all frequency bands and would be just as likely to be positive as negative. As our modeling experiments showed, the contribution of these spurious results to the overall picture seems likely to have been largely insignificant: 1) in contrast to coherencies that are largely redundant in neighboring channels [see Nolte et al.,2004], the ISS measure is not [Kaplan et al.,2005]; 2) adding noninteracting sources (e.g., noise) to EEG signals causes a decrease in the ISS measure instead of an increase, thus leading to an underestimation of ISS effects, rather than generating spurious ISS values [Fingelkurts,1998]. Given that actual correlations occurred with a much higher incidence than expected by chance, and due to the independence of ISS from the power spectrum of the EEG signal [Fingelkurts et al.,2003a; Kaplan and Shishkin,2000], we believe that the ISS measure can accurately reflect local and global cortical functional connectivity. The accuracy of topographic EEG mapping for determining local (immediately under the recording electrode) brain activity was established by Cook et al. [1998]. Giving further support to the interpretation that the electrophysiological differences reflect differences in brain functioning is that the measure employed in this study was specifically developed to measure dynamic interdependencies between rapid changes in time series [see Kaplan et al.,2005] and applied to test a specific hypothesis that such functional correlations are different in various functional states [Fingelkurts et al.,2003a,b,2004a,b; Kaplan and Shishkin,2000] and diseases [Borisov,2002; Fingelkurts,1998]. We therefore argue that the ISS measure is virtually unaffected by volume conduction and has construct validity in the present context.
Independence of the Lengths of EEG Segments
Figure 4 presents two samples of autocorrelation for lengths of EEG segments obtained from the occipital (O1) and frontal (F4) cortical areas during 20 min of EEG recording (for one subject). Even though a clear pattern of decreasing correlations with increasing lags (some small autocorrelation) is present, due to its small magnitude it is likely irrelevant. Note that with the exception of lag 0, which is always 1 by definition, all of the autocorrelations fall within the 95% confidence limit. Thus, we may conclude that adjacent lengths of EEG segments (defined by RTPs) do not correlate significantly. However, this result should be regarded as a very preliminary attempt, considering that, strictly speaking, using the autocorrelation function for this purpose is not correct since 1) The key assumption underlying such statistical analysis is the “stationarity” of the registered signal, while the EEG is a highly nonstationary signal [Kaplan and Shishkin,2000]; 2) The lengths of EEG segments (observations) are not equispaced; although the time variable is not used in the formula for autocorrelation, the assumption is that the observations are equispaced; 3) The sequence of EEG segment lengths does not strictly correspond to the time series. Nevertheless, the number of theoretical considerations (based on experimental results) supports the fact that different segments of EEG should be relatively independent: each of these quasi‐stationary segments is formed by a random stationary process with particular probabilistic characteristics that remain relatively constant within a segment and which changed abruptly from one segment to another [Lehmann et al.,1987; for review, see Fell et al.,2000; Kaplan and Shishkin,2000]. The transition from one segment to another reflects changes in the generator system state or changes in the activity of the two or more systems [Brodsky et al.,1999; see also Kaplan and Shishkin,2000]. Therefore, in either case we may conclude that adjacent lengths of EEG segments do not correlate.
Figure 4.
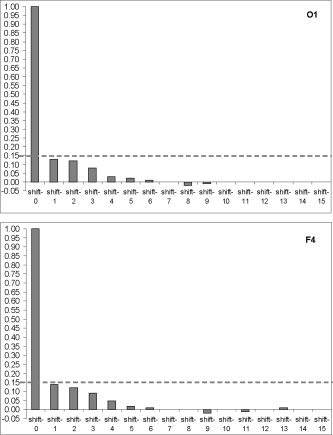
Two samples of autocorrelation for lengths of EEG segments obtained from occipital (O1) and frontal (F4) cortical areas during 20 min of EEG recording (one subject). y‐axis, Autocorrelation coefficients; x‐axis, Time shift/lag (1, 2, 3,…). Horizontal reference lines indicate the 95% confidence level.
Normalized Index of EEG Structural Synchrony
The normalized version of ISS is ISSn = (m windows – m residual) / [0.5*(m windows + m residual)]. Comparison of the ISS and ISSn values has shown that both indices lead to the same qualitative results (Fig. 5). The coefficient of correlation between these two indices equals 1 (P < 0.0001). This equality revealed an important feature of the synchronization index based on RTP coupling: the ISS measure is already normalized since the parameters m windows and m residual take into account the global density of RTPs. The only difference between ISS and ISSn measures is the much lower values for ISSn (Fig. 5). This is precisely why we prefer to use the ISS index: the higher values give more room for their variability, which is an important attribute of the index in practical experiments, when one needs to distinguish between two (or more) conditions.
Figure 5.
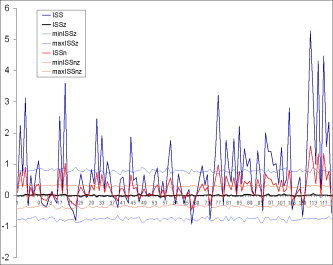
Schematic illustration of index of structural synchrony (ISS) and its normalized version (ISSn) with stochastic levels. As an example, the calculations of ISS and ISSn are shown for 16 EEG channels. The y‐axis displays the ISS and ISSn values found in the experiment. The x‐axis displays the 120 possible pair combinations for 16 EEG channels (1 = O1‐O2, 2 = O1‐P3, 3 = O1‐P4, 4 = O1‐T5, … 115 = F4‐Fz, 116 = F4‐F7, 117 = F4‐F8, 118 = FZ‐F7, 119 = FZ‐F8, 120 = F7‐F8). ISSz indicates the stochastic mean values of structural synchrony obtained during the computer simulations; min/max ISSz indicates the stochastic levels for ISSz; min/max ISSnz indicates the stochastic levels for ISSnz. [Color figure can be viewed in the online issue, which is available at www.interscience.wiley.com.]
One‐Minute EEG Epochs
Statistically, different epochs of ongoing EEG within one subject may be considered independent observations (imagine that we made 10 independent 1‐min EEG recordings) since they are not coupled to any particular internal physiological processes and/or external stimuli. Physiologically, the EEG epochs from the same subject are, naturally, more dependent than epochs from different subjects. This is the general problem of practically all EEG studies. However, the question is whether the difference in variability of EEGs from the same and between different subjects is significant. The most general parameter that describes EEG is its power spectrum. Unfortunately, the averaged power spectrum is prone to many limitations and presents at most a virtual estimate [see Fingelkurts et al.,2005a]. To assess the appropriateness of the general description of 1‐min EEG epochs, we calculated the probability‐classification profiles (PCP) of short‐term spectral patterns [method described in Fingelkurts et. al.,2003d] and compared them within and across subjects. To assess the stability of this measurement during each 1‐min EEG epoch within each subject and across subjects, we calculated the coefficient of variability (CV = standard deviation / mean) as a first measure of stability for averaged PCPs across all 1‐min EEGs separately for each channel for each subject and for all subjects together. Further, data were averaged across all EEG channels for each subject and for the group of all subjects. PCP was presented as the histogram of the relative presence of each spectral pattern type for a particular EEG [Fingelkurts et al.,2003d]. Analysis of all PCPs for all subjects revealed that EEGs of all subjects were dominated by delta‐theta activity (spectral pattern had dominant peaks at 2.5 and 3.5 Hz). The coefficient of variability demonstrated that this type of activity was stable 1) within each subject (CV ranged from 0.4–0.6 for different subjects) and 2) across the subjects (CV = 0.6). Although EEGs within subjects were somewhat more similar to each other than across subjects, the interindividual variability was only insignificantly higher, and was still relatively low. Thus, stability of EEGs within and between subjects was very similar. These facts justify the pulling of all data together and the analysis of all 1‐min EEGs in the common pool.
Furthermore, the division of the EEG into 1‐min intervals permitted us to obtain a relatively large number of analyzed epochs; it is important that an unbiased estimate of the synchronicity index is computed using enough data samples. Such an approach is justified because there are no fixed positions in the EEG, and we can therefore divide it into any number of epochs with a length appropriate for the particular experiment and analysis. In our previous research [Fingelkurts,1998; Appendix B in Fingelkurts et al.,2003a], we have shown that the reliable synchronicity profile already exists at 5‐s EEG intervals, and remains almost the same as for the whole 1‐min EEG. The main positive peaks of this 5‐s profile (which correspond to concrete EEG pair combinations) coincided precisely with a 1‐min profile, although many of them failed to reach the level of significance. The synchronicity profile for the 10‐s EEG interval was more stable, and the main peaks reached the level of statistical significance. The first, second, and third 20‐s intervals of the 1‐min EEG did not differ from each other significantly and strongly resembled the whole 1‐min EEG profile. These results showed that the functional relationships between EEG recordings are stable and not dependent on the analyzed epoch (beyond 5 s). The evidence becomes even stronger if we take into consideration the results of the analysis of the 20‐s EEG epoch, which was artificially constructed from 1‐s EEG intervals taken 20 times randomly from different 1‐min EEGs [see Appendix B in Fingelkurts et al.,2003a]. The synchronicity profile was practically identical to any other synchronicity profile of the 20‐s EEGs and almost the same as the profile of the 1‐min EEG. An increase of EEG epoch beyond the 1‐min interval did not lead to any changes in the synchronicity profile [Fingelkurts,1998]. Therefore, the results of the ISS measure do not significantly depend on the epoch of EEG analysis.
Most Frequently (≥85%) Found EEG Connections
Since in the present study 20 EEG derivations were used, then in total there should be (20*20‐20)/2 = 190 pairs of combinations of EEG electrodes. Thus, we can expect 190*0.05 = 9.5 false‐positives (on average) for each single 1‐min EEG analyzed under the null hypothesis (where 0.05 is the significance level). Based on these calculations, it seems rather improbable that a false‐positive connection will emerge by chance 85% of the time. Thus, the level of frequency higher than 85% is appropriate. However, this conclusion relies on the following assumptions: (1) the nominal 0.05 is correct (so it is crucial that no significant autocorrelation exists between the lengths of EEG segments), and (2) the 1‐min EEG epochs within individuals are as different as those between individuals. As shown above, these two assumptions are justified.
REFERENCES
- Allen JJ, Iacono WG, Depue RA, Arbisi P (1993): Regional electroencephalographic asymmetries in bipolar seasonal affective disorder before and after exposure to bright light. Biol Psychiatry 33: 642–646. [DOI] [PubMed] [Google Scholar]
- Allen JJB, Urry HL, Hitt SK, Coan JA (2004): The stability of resting frontal electroencephalographic asymmetry in depression. Psychophysiology 41: 269–280. [DOI] [PubMed] [Google Scholar]
- Atchley RA, Ilardi SS, Enloe A (2003): Hemispheric asymmetry in the processing of emotional content in word meanings: the effect of current and past depression. Brain Lang 84: 105–119. [DOI] [PubMed] [Google Scholar]
- Bargh JA, Tota ME (1988): Context‐dependent automatic processing in depression: accessibility of negative constructs with regard to self but not others. J Pers Soc Psychol 54: 925–939. [DOI] [PubMed] [Google Scholar]
- Beeman M, Friedman RB, Grafman J, Perez E, Diamond S, Lindsay MB (1994): Summation priming and coarse semantic coding in the right hemisphere. J Cogn Neurosci 6: 26–45. [DOI] [PubMed] [Google Scholar]
- Bench CJ, Friston KJ, Brown RG, Scott LC, Frackowiak RS, Dolan RJ (1992): The anatomy of melancholia—focal abnormalities of cerebral blood flowing major depression. Psychol Med 22: 607–615. [DOI] [PubMed] [Google Scholar]
- Boccaletti B, Kurths J, Osipov G, Valladares DL, Zhou CS (2002): The synchronization of chaotic systems. Phys Rep 366: 1–101. [Google Scholar]
- Borisov SV (2002): Studying of a phasic structure of the alpha activity of human EEG. PhD Thesis, Moscow State University (in Russian).
- Breakspear M, Terry JR (2002a): Topographic organization of nonlinear interdependence in multichannel human EEG. Neuroimage 16: 822–835. [DOI] [PubMed] [Google Scholar]
- Breakspear M, Terry JR (2002b): Detection and description of non‐linear interdependence in normal multichannel human EEG data. Clin Neurophysiol 113: 735–753. [DOI] [PubMed] [Google Scholar]
- Bressler SL (2002): Understanding cognition through large‐scale cortical networks. Curr Dir Psychol Sci 11: 58–61. [Google Scholar]
- Brodsky BE, Darkhovsky BS, Kaplan AYa, Shishkin SL (1999): A nonparametric method for the segmentation of the EEG. Comput Methods Programs Biomed 60: 93–106. [DOI] [PubMed] [Google Scholar]
- Burgess AP, Gruzelier J (1997): How reproducible is the topographical distribution of EEG amplitude? Int J Psychophysiol 26: 113–119. [DOI] [PubMed] [Google Scholar]
- Cacioppo JT (2004): Feelings and emotions: roles for electrophysiological markers. Biol Psychol 67: 235–243. [DOI] [PubMed] [Google Scholar]
- Chiarello C (1998): On codes of meaning and the meaning of codes: semantic access and retrieval within and between hemispheres In: Beeman M, Chiarello C, editors. Right hemisphere language comprehension: perspective from cognitive neuroscience. Matawah, NJ: Lawrence Erlbaum; p 141–160. [Google Scholar]
- Chiarello C, Burgess C, Richards L, Pollock A (1990): Semantic and associative priming in the cerebral hemispheres: some words do, some words don't … sometimes, some places. Brain Lang 38: 75–104. [DOI] [PubMed] [Google Scholar]
- Coan JA, Allen JJB (2003): The state and trait nature of frontal EEG asymmetry in emotion In: Hugdahl K, Davidson RJ, editors. The asymmetrical brain. Cambridge, MA: MIT Press; p 565–615. [Google Scholar]
- Coan JA, Allen JJB (2004): EEG asymmetry as a moderator and mediator of emotion. Biol Psychol 67: 7–49. [DOI] [PubMed] [Google Scholar]
- Collins A, Loftus E (1975): A spreading‐activation theory of semantic processing. Psychol Rev 82: 407–428. [Google Scholar]
- Coney J, Evans KD (1999)Hemispheric asymmetries in the resolution of lexical ambiguity. Neuropsychologia 38: 272–282. [DOI] [PubMed] [Google Scholar]
- Cook IA, O'Hara R, Uijtdehaage SH, Mandelkern M, Leuchter AF (1998): Assessing the accuracy of topographic EEG mapping for determining local brain function. Electroencephalogr Clin Neurophysiol 107: 408–414. [DOI] [PubMed] [Google Scholar]
- Damasio AR (1994): Descarte's error: emotion, reason, and the human brain. New York: Avon. [Google Scholar]
- Damasio AR (2000): The feeling of what happens. Body, emotion and the making of consciousness. London: Vintage. [Google Scholar]
- Davidson RJ (1998): Anterior electrophysiological asymmetries, emotion, and depression: conceptual and methodological conundrums. Psychophysiology 35: 607–614. [DOI] [PubMed] [Google Scholar]
- Davidson RJ (2004): What does the prefrontal cortex “do” in affect: perspectives on frontal EEG asymmetry research. Biol Psychol 67: 219–233. [DOI] [PubMed] [Google Scholar]
- Davidson RJ, Pizzagalli D, Nitschke JB, Putnam K (2002): Depression: perspectives from affective neuroscience. Annu Rev Psychol 53: 545–574. [DOI] [PubMed] [Google Scholar]
- Dawson KA (2004): Temporal organization of the brain: neurocognitive mechanisms and clinical implications. Brain Cogn 54: 75–94. [DOI] [PubMed] [Google Scholar]
- Drevets WC (2003): Neuroimaging abnormalities in the amygdala in mood disorders. Ann N Y Acad Sci 985: 420–444. [DOI] [PubMed] [Google Scholar]
- Drevets WC, Price JL, Simpson JR Jr, Todd RD, Reich T, Vannier M, Raichle ME (1997): Subgenual prefrontal cortex abnormalities in mood disorders. Nature 386: 824–827. [DOI] [PubMed] [Google Scholar]
- Fell J, Kaplan A, Darkhovsky B, Röschke J (2000): EEG analysis with nonlinear deterministic and stochastic methods: a combined strategy. Acta Neurobiol Exp 60: 87–108. [DOI] [PubMed] [Google Scholar]
- Feng J, Cai X, Zhao J, Yan Z (2001): Serotonin receptors modulate GABAA receptor channels through activation of anchored protein kinase C in prefrontal cortical neurons. J Neurosci 21: 6502–6511. [DOI] [PMC free article] [PubMed] [Google Scholar]
- Fingelkurts AnA (1998): Time‐spatial organization of human EEG segment's structure. PhD Dissertation, Moscow State University (in Russian).
- Fingelkurts AnA, Fingelkurts AlA (2001): Operational architectonics of the human brain biopotential field: towards solving the mind‐brain problem. Brain Mind 2: 261–296. [Google Scholar]
- Fingelkurts AnA, Fingelkurts AlA (2003): Operational architectonics of perception and cognition: a principle of self‐organized metastable brain states. VI. Parmenides Workshop, Institute of Medical Psychology; April 5–10, Elba/Italy: (invited full‐text contribution). [Google Scholar]
- Fingelkurts AnA, Fingelkurts AlA (2004): Making complexity simpler: multivariability and metastability in the brain. Int J Neurosci 114: 843–862. [DOI] [PubMed] [Google Scholar]
- Fingelkurts AnA, Fingelkurts AlA (2005): Mapping of the brain operational architectonics In: Chen FJ, editor. Focus on brain mapping research. New York: Nova Science; p 59–98. [Google Scholar]
- Fingelkurts AnA, Fingelkurts AlA, Krause C, Kaplan A, Borisov S, Sams M (2003a): Structural (operational) synchrony of EEG alpha activity during an auditory memory task. Neuroimage 20: 529–542. [DOI] [PubMed] [Google Scholar]
- Fingelkurts AnA, Fingelkurts AlA, Krause CM, Mottonen R, Sams M (2003b): Cortical operational synchrony during audio‐visual speech integration. Brain Lang 85: 297–312. [DOI] [PubMed] [Google Scholar]
- Fingelkurts AlA, Fingelkurts AnA, Krause CM, Kaplan AYa (2003c): Systematic rules underlying spectral pattern variability: Experimental results and a review of the evidences. Int J Neurosci 113: 1447–1473. [DOI] [PubMed] [Google Scholar]
- Fingelkurts AlA, Fingelkurts AnA, Kaplan AYa (2003d): The regularities of the discrete nature of multi‐variability of EEG spectral patterns. Int J Psychophysiol 47: 23–41. [DOI] [PubMed] [Google Scholar]
- Fingelkurts AnA, Fingelkurts AlA, Kivisaari R, Pekkonen E, Ilmoniemi RJ, Kahkonen S (2004a): Enhancement of GABA‐related signalling is associated with increase of functional connectivity in human cortex. Hum Brain Mapp 22: 27–39. [DOI] [PMC free article] [PubMed] [Google Scholar]
- Fingelkurts AnA, Fingelkurts AlA, Kivisaari R, Pekkonen E, Ilmoniemi RJ, Kahkonen S (2004b) Local and remote functional connectivity of neocortex under the inhibition influence. Neuroimage 22: 1390–1406. [DOI] [PubMed] [Google Scholar]
- Fingelkurts AnA, Fingelkurts AlA, Kahkonen S (2005a): New perspectives in pharmaco‐electroencephalography. Prog Neuropsychopharmacol Biol Psychiatry 29: 193–199. [DOI] [PubMed] [Google Scholar]
- Fingelkurts AnA, Fingelkurts AlA, Kahkonen S (2005b): Functional connectivity in the brain — is it an elusive concept? Neurosci Biobehav Rev 28: 827–836. [DOI] [PubMed] [Google Scholar]
- First MB, Spitzer RL, Gibbon M (1994): Structured clinical interview for DSM‐IV Axis I (SCID I) (v. 2.0). Biometrics Research Department, New York State Psychiatric Institute, 1994. [Google Scholar]
- Fossati P, Guillaume leB, Ergis AM, Allilaire JF (2003): Qualitative analysis of verbal fluency in depression. Psychiatry Res 117: 17–24. [DOI] [PubMed] [Google Scholar]
- Freeman WJ (2003): Neurodynamic models of brain in psychiatry. Neuropsychopharmacology 28: 54–63. [DOI] [PubMed] [Google Scholar]
- Friston KJ (2000): The labile brain. III. Transients and spatio‐temporal receptive fields. Philos Trans R Soc Lond B Biol Sci 355: 253–265. [DOI] [PMC free article] [PubMed] [Google Scholar]
- Friston KJ (2001): The labile brain. I. Neuronal transients and nonlinear coupling. Philos Trans R Soc Lond B 355: 215–236. [DOI] [PMC free article] [PubMed] [Google Scholar]
- Friston KJ, Frith CD, Liddle PF, Frackowiak RSJ (1993): Functional connectivity: the principal component analysis of large (PET) data sets. J Cereb Blood Flow Metab 13: 5–14. [DOI] [PubMed] [Google Scholar]
- Gotlib IH, Ranganath C, Rosenfeld JP (1998): Frontal EEG alpha asymmetry, depression, and cognitive functioning. Cogn Emot 12: 449–478. [Google Scholar]
- Gusnard DA, Raichle ME (2001): Searching for a baseline: functional imaging and the resting human brain. Nat Rev Neurosci 2: 685–694. [DOI] [PubMed] [Google Scholar]
- Hadjipapas A, Hillebrand A, Holliday IE, Singh KD, Barnes GR (2005): Assessing interactions of linear and nonlinear neuronal sources using MEG beamformers: a proof of concept. Clin Neurophysiol 116: 1300–1313. [DOI] [PubMed] [Google Scholar]
- Haig A, Gordon E (1998): Prestimulus EEG alpha phase synchronicity influences N100 amplitude and reaction time. Psychophysiology 35: 591–595. [DOI] [PubMed] [Google Scholar]
- Haig AR, Gordon E, De Pascalis V, Meares RA, Bahramali H, Harris A (2000): Gamma activity in schizophrenia: evidence of impaired network binding? Clin Neurophysiol 111: 1461–1468. [DOI] [PubMed] [Google Scholar]
- Hamilton M (1960): A rating scale for depression. J Neurol Neurosurg Psychiatry 23: 56–62. [DOI] [PMC free article] [PubMed] [Google Scholar]
- Henriques JB, Davidson RJ (1990): Regional brain electrical asymmetries discriminate between previously depressed and healthy control subjects. J Abnorm Psychol 99: 22–31. [DOI] [PubMed] [Google Scholar]
- Homan RW, Herman J, Purdy P (1987): Cerebral location of international 10–20 system electrode placement. Electroencephalogr Clin Neurophysiol 66: 376–382. [DOI] [PubMed] [Google Scholar]
- Ingram R (1984): Towards an information processing analysis of depression. Cogn Ther Res 8: 443–478. [Google Scholar]
- Ito H, Kawashima R, Awata S, Ono S, Sato K, Goto R, Koyama M, Sato M, Fukuda H (1996): Hypoperfusion in the limbic system and prefrontal cortex in depression: SPECT with anatomic standardization technique. J Nucl Med 37: 410–414. [PubMed] [Google Scholar]
- Kaplan AYa (1998): Nonstationary EEG: methodological and experimental analysis. Usp Physiol Nayk (Success in Physiological Sciences) 29: 35–55 (in Russian). [PubMed] [Google Scholar]
- Kaplan AYa, Borisov SV (2003): Dynamic properties of segmental characteristics of EEG alpha activity in rest conditions and during cognitive load. Zh Vyssh Nerv Deiat Im IP Pavlova (IP Pavlov J Higher Nervous Activity) 53: 22–32 (in Russian). [PubMed] [Google Scholar]
- Kaplan AYa, Shishkin SL (2000): Application of the change‐point analysis to the investigation of the brain's electrical activity In: Brodsky BE, Darkhovsky BS, editors. Nonparametric statistical diagnosis: problems and methods. Dordrecht: Kluwer; p 333–388. [Google Scholar]
- Kaplan AYa, Fingelkurts AlA, Fingelkurts AnA, Darkhovsky BS (1997): Topological mapping of sharp reorganization synchrony in multichannel EEG. Am J END Tech 37: 265–275. [Google Scholar]
- Kaplan AYa, Fingelkurts AnA, Fingelkurts AlA, Borisov SV, Darkhovsky BS (2005): Nonstationary nature of the brain activity as revealed by EEG/MEG: methodological, practical and conceptual challenges. Signal Process 85: 2190–2212. [Google Scholar]
- Kelso JAS (1995): Review of dynamic patterns: the self‐organization of brain and behavior. Cambridge, MA: MIT Press. [Google Scholar]
- Kempermann G, Kronenberg G (2003): Depressed new neurons — adult hippocampal neurogenesis and a cellular plasticity hypothesis of major depression. Biol Psychiatry 54: 499–503. [DOI] [PubMed] [Google Scholar]
- Koenig T, Prichep L, Lehmann D, Sosa PV, Braeker E, Kleinlogel H, Isenhart R, John ER (2002): Millisecond by millisecond, year by year: normative EEG microstates and developmental stages. Neuroimage 16: 41–48. [DOI] [PubMed] [Google Scholar]
- LeDoux JE (1996): The Emotional Brain. New York: Simon and Schuster. [Google Scholar]
- LeDoux JE (2003): The self: clues from the brain. Ann N Y Acad Sci 1001: 295–304. [DOI] [PubMed] [Google Scholar]
- Lehmann D, Ozaki H, Pal I (1987): EEG alpha map series: brain microstates by space‐oriented adaptive segmentation. Electroencephalogr Clin Neurophysiol 67: 271–288. [DOI] [PubMed] [Google Scholar]
- Livanov MN (1984): Electroencephalogram rhythms and their functional significance. Zh Vyssh Nerv Deiat Im IP Pavlova (IP Pavlov J Higher Nervous Activity) 34: 613–626 (in Russian). [PubMed] [Google Scholar]
- Mann JJ (1999): Role of the serotonergic system in the pathogenesis of major depression and suicidal behavior. Neuropsychopharmacology 21: 99S–105S. [DOI] [PubMed] [Google Scholar]
- Martinot JL, Hardy P, Feline A, Huret JD, Mazoyer B, Attar‐Levy D, Pappata S, Syrota A (1990): Left prefrontal glucose hypometabolism in the depressed state: a confirmation. Am J Psychiatry 147: 1313–1317. [DOI] [PubMed] [Google Scholar]
- Mayberg HS (1997): Limbic‐cortical dysregulation: a proposed model of depression. J Neuropsychiatry Clin Neurosci 9: 471–481. [DOI] [PubMed] [Google Scholar]
- Mayberg HS (2003): Positron emission tomography imaging in depression: a neural systems perspective. Neuroimag Clin N Am 13: 805–815. [DOI] [PubMed] [Google Scholar]
- Mayberg HS, Lewis PJ, Regenold W, Wagner HN Jr (1994): Paralimbic hypoperfusion in unipolar depression. J Nucl Med 35: 929–934. [PubMed] [Google Scholar]
- Moore BJ, Singh KD, Kinderman P, Bentall RP, Morriss RK, Roberts N (2001): Neuroanatomical basis of semantic processing in relation to personality descriptors of self: an fMRI study in healthy subjects. Poster HBM 2001; Brighton, UK. [Google Scholar]
- Moreno FA, Heninger GR, McGahuey CA, Delgado PL (2000): Tryptophan depletion and risk of depression relapse: a prospective study of tryptophan depletion as a potential predictor of depressive episodes. Biol Psychiatry 48: 327–329. [DOI] [PubMed] [Google Scholar]
- Nandrino JL, Pezard L, Martinerie J, el Massioui F, Renault B, Jouvent R, Allilaire JF, Widlocher D (1994): Decrease of complexity in EEG as a symptom of depression. Neuroreport 5: 528–530. [DOI] [PubMed] [Google Scholar]
- Nolte G, Bai O, Wheaton L, Mari Z, Vorbach S, Hallett M (2004): Identifying true brain interaction from EEG data using the imaginary part of coherency. Clin Neurophysiol 115: 2292–2307. [DOI] [PubMed] [Google Scholar]
- Nunez PL (2000): Toward a quantitative description of large‐scale neocortical dynamic function and EEG. Behav Brain Sci 23: 371–437. [DOI] [PubMed] [Google Scholar]
- Pezard L, Nandrino JL (2001): Dynamic paradigm in psychopathology: “chaos theory,” from physics to psychiatry. Encephale 27: 260–268. [PubMed] [Google Scholar]
- Pizzagalli DA, Oakes TR, Davidson RJ (2003): Coupling of theta activity and glucose metabolism in the human rostral anterior cingulate cortex: an EEG/PET study of normal and depressed subjects. Psychophysiology 40: 939–949. [DOI] [PubMed] [Google Scholar]
- Pulvermüller F (1999): Words in the brain's language. Behav Brain Sci 22: 253–336. [PubMed] [Google Scholar]
- Raichle ME, Gusnard DA (2005): Intrinsic brain activity sets the stage for expression of motivated behavior. J Comp Neurol 493: 167–176. [DOI] [PubMed] [Google Scholar]
- Rappelsberger P (1998): Probability mapping of power and coherence: technical aspects In: Petsche H, Etlinger S, editors. EEG and thinking. Wien: Österreichische Akademie der Wissenschaften; p 63–78. [Google Scholar]
- Rappelsberger P, Petsche H (1988): Probability mapping: power and coherence analysis of cognitive processes. Brain Topogr 1: 46–54. [DOI] [PubMed] [Google Scholar]
- Razoumnikova OM (2000): Functional organization of different brain areas during convergent and divergent thinking: an EEG investigation. Cogn Brain Res 10: 11–18. [DOI] [PubMed] [Google Scholar]
- Rolls ET (1999): The Brain and Emotion. New York: Oxford University Press. [Google Scholar]
- Rotenberg VS (2004): The peculiarity of the right‐hemisphere function in depression: solving the paradoxes. Prog Neuropsychophar Biol Psychiatry 28: 1–13. [DOI] [PubMed] [Google Scholar]
- Rotenberg VS, Arshavsky VV (1997) Right and left brain hemisphere activation in the representatives of two different cultures. Homeostasis 38: 49–57. [Google Scholar]
- Sarbadhikari SN, Chakrabarty K (2001): Chaos in the brain: a short review alluding to epilepsy, depression, exercise and lateralization. Med Eng Phys 23: 445–455. [DOI] [PubMed] [Google Scholar]
- Siegle GJ (1999): A neural network model of attention biases in depression In: Reggia J, Ruppin E, editors. Disorders of brain, behavior, and cognition: the neurocomputational perspective. New York: Elsevier; p 415–441. [Google Scholar]
- Stahl SM, Zhang L, Damatarca C, Grady M (2003): Brain circuits determine destiny in depression: a novel approach to the psychopharmacology of wakefulness, fatigue, and executive dysfunction in major depressive disorder. J Clin Psychiatry 64: 6–17. [PubMed] [Google Scholar]
- Stam CJ, Breakspear M, van Cappellen van Walsum AM, van Dijk BW (2003): Nonlinear synchronization in EEG and whole‐head MEG recordings of healthy subjects. Hum Brain Mapp 19: 63–78. [DOI] [PMC free article] [PubMed] [Google Scholar]
- Stam CJ, Montez T, Jones BF, Rombouts SA, van der Made Y, Pijnenburg YA, Scheltens P (2005): Disturbed fluctuations of resting state EEG synchronization in Alzheimer's disease. Clin Neurophysiol 116: 708–715. [DOI] [PubMed] [Google Scholar]
- Stein AV, Rappelsberger P, Sarnthein J, Petsche H (1999): Synchronization between temporal and parietal cortex during multimodal object processing in man. Cereb Cortex 9: 137–150. [DOI] [PubMed] [Google Scholar]
- Strelets VB, Ivanitskii AM, Ivanitskii GA, Artseulova OK, Novototskii‐Vlasov VIu, Golikova ZhV (1996): The disordered organization of the cortical processes in depression. Zh Vyssh Nerv Deiat Im IP Pavlova (IP Pavlov J Higher Nervous Activity) 46: 274–281 (in Russian). [PubMed] [Google Scholar]
- Tucker DM, Dawson SL (1984): Asymmetric EEG power and coherence as method actors generated emotions. Biol Psychol 19: 63–75. [DOI] [PubMed] [Google Scholar]
- Von Stein A, Sarnthein J (2000): Different frequencies for different scales of cortical integration: from local gamma to long‐range alpha/theta synchronization. Int J Psychophysiol 38: 301–313. [DOI] [PubMed] [Google Scholar]
- Weiss S, Rappelsberger P (2000): Long‐range EEG synchronization during word encoding correlates with successful memory performance. Brain Res Cogn Brain Res 9: 299–312. [DOI] [PubMed] [Google Scholar]