

Abstract
Polymicrogyrias (PMG) are cortical malformations resulting from developmental abnormalities. In animal models PMG has been associated with abnormal anatomy, function, and organization. The purpose of this study was to describe the function and organization of human polymicrogyric cortex using functional magnetic resonance imaging. Three patients with epilepsy and bilateral parasagittal occipital polymicrogyri were studied. They all had normal vision as tested by Humphrey visual field perimetry. The functional organization of the visual cortex was reconstructed using phase‐encoded retinotopic mapping analysis. This method sequentially stimulates each point in the visual field along the axes of a polar‐coordinate system, thereby reconstructing the representation of the visual field on the cortex. We found normal cortical responses and organization of early visual areas (V1, V2, and V3/VP). The locations of these visual areas overlapped substantially with the PMG. In five out of six hemispheres the reconstructed primary visual cortex completely fell within polymicrogyric areas. Our results suggest that human polymicrogyric cortex is not only organized in a normal fashion, but is also actively involved in processing of visual information and contributes to normal visual perception. Hum Brain Mapp 2007. © 2007 Wiley‐Liss, Inc.
Keywords: malformations of cortical development, functional magnetic resonance imaging (fMRI), retinotopic mapping, vision, visual cortex, V1
INTRODUCTION
Malformations of cortical development are important causes of severe, childhood‐onset epilepsy and may be associated with developmental delay. They can arise from abnormalities in various stages of embryogenesis and are increasingly diagnosed through advanced MRI techniques [Barkovich et al., 1995]. Polymicrogyrias (PMG) are a group of malformations resulting from a disorder in neuronal cortical organization related to intrauterine insults or genetic factors [Guerrini, 2005]. The unlayered type consists of a single layer of unlaminated neurons often present along the lips of schizencephalies, while the four‐layered type exhibits intracortical laminar necrosis in place of layers 4 and 5 [Barkovich et al., 1995]. On MRI, PMG is characterized by multiple small convolutions separated by shallow and enlarged sulci that are isointense to normal cortex [Barkovich et al., 1995]. Clinical manifestations vary most closely with the extent of malformation, and unilateral as well as bilateral syndromes are described [Guerrini et al., 2003].
In animal models, PMG can be induced by neocortical freeze lesions made transcrannially within 2 days after birth. These induced PMG mimic morphological and clinical aspects of human four‐layered PMG [Humphreys et al., 1991]. Animal studies have demonstrated that PMG may show variable responses to stimulation in terms of activation and organization. Some studies have shown reduced activations with sensory stimulation [Schwindt et al., 2004], while other studies showed a disruption of cortical organization in the somatosensory cortex [Jacobs et al., 1999b; Rosen et al., 2001] and a disruption of retinotopic organization following lesions in the immature occipital cortex [Restrepo et al., 2003].
Functional responses elicited by sensory stimulation can be detected in human PMG using functional magnetic resonance imaging (fMRI) and evoked potential magnetoencephalography (MEG) techniques [Burneo et al., 2004; Innocenti et al., 2001; Ishitobi et al., 2005; Janszky et al., 2003; Paetau et al., 2004]. These functional responses may exhibit abnormal profiles [Ishitobi et al., 2005; Paetau et al., 2004] and their locations may be displaced relative to gross morphological features [Ishitobi et al., 2005; Paetau et al., 2004]. In summary, abnormal anatomy, function, and organization in PMG cortex have been suggested. In addition, a displacement of some functional responses due to the presence of PMG has been proposed. Currently, it has not been established whether the functional organization of these response sites is preserved. Therefore, the purpose of this study was to assess the cortical organization of visual cortex in three patients with epilepsy with bilateral parasagittal occipital PMG.
The functional organization of visual cortex can be precisely determined [within ∼1 mm; Engel et al., 1997] in vivo with fMRI using phase‐encoded retinotopic mapping methodology [DeYoe et al., 1996; Dumoulin et al., 2003; Engel et al., 1997; Sereno et al., 1995; Warnking et al., 2002]. The phase‐encoded retinotopic method sequentially stimulates each point in the visual field along the axes of a polar‐coordinate system [Engel et al., 1994], thereby reconstructing the representation of the visual field on the cortex [Sereno et al., 1995]. By reconstructing the entire visual representation without assuming a particular a priori layout of the visual field, this technique allows a detailed analysis of the pathological visual system [Baseler et al., 1999, 2002; Morland et al., 2001; Sunness et al., 2004]. We used an automatic volumetric phase‐encoded retinotopic mapping procedure that has been validated using simulations and comparisons with surface‐based technologies and is now routinely applied in healthy subjects [Dumoulin et al., 2003]. This methodology has been compared with cytoarchitectonic analysis of the human visual cortex, revealing a good correspondence of functional‐ and anatomical‐derived segregations of visual areas [Wohlschläger et al., 2005].
METHODS
Patients
We studied three male patients with bilateral occipital parasagittal PMG (mean age 33 years, range of 21–44 years) and pharmacologically intractable epilepsy (Table I). Deficits were present on neurological examination only in patient 2 who had a right hemiparesis as well as borderline intellectual functioning. Humphrey perimetry was used to test visual fields in all three subjects and found to be normal in each case. All three had multiple seizure types, with focal as well as generalized events. Complex‐partial seizures in patients 1 and 3 consisted of lack of awareness without any preceding aura, whereas patient 2 had simple motor seizures involving his right hand. None had visual symptoms associated with seizures. Precise localization of epileptogenic cortex using intracranial EEG was not obtained in any of our patients because they were not considered surgical candidates. Interictal epileptic discharges were only noted on EEG in patients 1 and 3, and discharges always involved wide areas of the scalp that were either lobar (entire temporal lobe in patient 1) or multilobar (temporal and pariental lobes in patient 3). In addition, video‐EEG recordings of seizures were obtained for patient 3, and in each event the ictal onset was again poorly localizing.
Table 1.
Demographic, clinical, electrophysiological and neuroimaging data of patients with polymicrogyria
| Patient/age (yr)/gender | Age at seizure onset (yr) | Seizure types | Examination/neuropsychology | Visual fields | EEG | MRI |
|---|---|---|---|---|---|---|
| 1/21/M | 14 | CPS, SG | Normal exam/average IQ | Normal | I: Bil. temporal, independent, R>L | Bil. occipital and insular polymicrogyria; Bil. peri‐ventricular nodular heterotopias posteriorly |
| 2/44/M | 10 | SPS, SG | Mild right‐sided hemiatrophy and paresis/mild‐moderately deficient IQ | Normal | I: normal | Bil.parieto‐occipital and L perisylvian polymicrogyria |
| 3/34/M | 10 | CPS, SG | Normal exam/neuropsychology not performed | Normal | I. R tempero‐parietal; II. bilateral tempero‐parietal | Bil. mesial occipital lobe polymicrogyri with heterotopic gray matter extending from involved cortex to occipital horns; small L supra‐vermian lipoma |
M, male; CPS, complex partial seizures; SG, secondary generalized seizures; I, interictal epileptic abnormalities; II, seizure onset; Bil., bilateral; R, right; L, left; SPS, simple partial seizures.
The three patients had been seizure‐free for at least 48‐h prior to the fMRI experiments. All studies were performed with written the informed consent of the patients and were approved by the Montréal Neurological Institute Research Ethics Committee. Malformations of cortical development consisted of bilateral occipital PMG in all patients, including the calcarine cortex (see Fig. 1). PMG extended anteriorly to involve perisylvian cortex in patient 2. Patients 1 and 3 had in addition subcortical heterotpic nodules.
Figure 1.
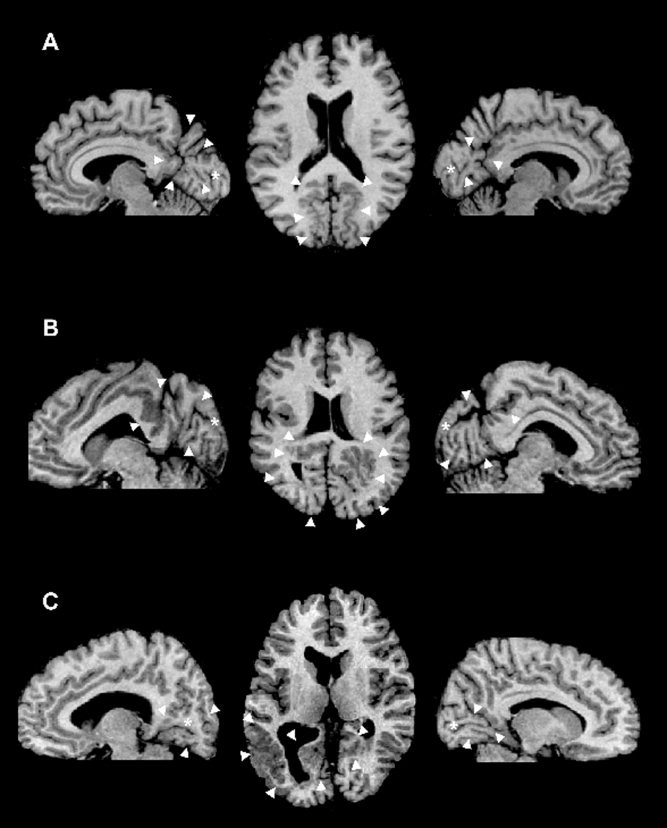
Representative T1‐weighted axial MRI of patient 1 (A), 2 (B), and 3 (C). The arrowheads point to the areas of PMG. On the sagittal images, the asterisk shows the location of the calcarine sulcus. Right is right on the image.
Visual Stimuli
The visual stimuli were generated in the MatLab programming environment using the PsychToobox [Brainard, 1997; Pelli, 1997] on a Macintosh G4 Powerbook, and displayed on a LCD projector (NEC Multisync MT820). The total visual display subtended 30°.
The patients were instructed to focus on a fixation dot in the center of the stimulus. This fixation dot randomly changed during the scan to an arrow pointing to either left or right. When this occurred the patients indicated the direction of the arrow by means of a mouse‐press. The subject's performances were on average 99% correct. This task ensured fixation of the patients and controlled their attention.
Standard stimuli were used to create polar‐angle and eccentricity maps of the visual cortex [Dumoulin et al., 2003; Engel et al., 1994; Sereno et al., 1995]. Wedge and annulus sections of a radial dynamic checkerboard were used for the phase‐encoded retinotopic mapping, which rotated (clockwise and anticlockwise) and expanded/contracted, respectively. Both stimuli completed a full cycle in 20 time frames giving a total of 6 cycles per scanning run. Each check in the checkerboard was filled with a random color, which was changed at a frequency of 8 Hz. The wedge subtended 80°.
Magnetic Resonance Imaging
The magnetic resonance images were acquired with a Siemens Sonata 1.5 T MRI. The experiments were conducted with the patients lying on their back with a surface‐coil (circularly polarized, receive only) centered over their occipital poles. The head position was fixed by means of a foam head‐rest.
Multislice T2*‐weighted gradient echo (GE) echo‐planar imaging (EPI) functional MR images (TR/TE = 3000/51 ms, flip angle = 90°, number of slices = 25 (contiguous), slice thickness = 4 mm) were acquired using a surface‐coil (receive only) with a 64 × 64 acquisition matrix and a 256 × 256 mm rectangular field of view. The slices were taken orthogonal to the calcarine sulcus and covered the entire occipital lobes. One hundred and twenty‐eight measurements (time frames) were acquired. Eight fMRI scans were performed in each session. T1‐weighted anatomical MR images (aMRI) were acquired prior to the commencement of the functional scans using the surface coil. This aMRI used a 3D GE sequence (TR = 22 ms, TE = 9.2 ms, flip angle = 30°, 256 × 256 mm rFOV) and yielded 80 sagittal images with a thickness of 2 mm. After the fMRI session T1‐weighted aMRI images were acquired with a head‐coil, also with a 3D GE sequence, yielding 160 sagittal images with isotropic voxel size of 1 mm3.
Processing of Anatomical Images
The aMRI scans were corrected for intensity nonuniformity [Sled et al., 1998] and automatically registered [Collins et al., 1994] in a stereotaxic space [Talairach and Tournoux, 1988]. The surface‐coil aMRI, taken with the functional images, was first coregistered with the head‐coil aMRI, thereby allowing an alignment of the functional data with a head‐coil aMRI and was subsequently registered into a stereotaxic space. This alignment was performed with an automated script combining correction for the intensity gradient in the surface‐coil aMRI [Sled et al., 1998] and intrasubject registration [Collins et al., 1994]. A validation of this method was described in a previous study [Dumoulin et al., 2000]. The aMRIs were classified into gray‐matter, white‐matter, and CSF [Zijdenbos et al., 2002], after which two cortical surfaces were automatically reconstructed at the inner and outer edge of the cortex [MacDonald et al., 2000]. The surface‐normals of the cortical models were smoothed to produce an “unfolded” model of the cortical sheet [MacDonald et al., 2000].
The areas of PMG were segmented manually in all patients on the high‐resolution 3D T1‐weighted MRI by an expert observer. Cortical areas were considered as PMG in the presence of multiple small convolutions separated by shallow and enlarged sulci producing the appearance of a rather thick cortical ribbon, with variably irregular outer surface or gray‐white matter junction. Microscopically, PMG may be characterized either by unlayered PMG (thin unlayered band of gray matter interrupted by branching tissue from the molecular layer with a central blood vessel) fusing of adjacent molecular layers or by four‐layered PMG, i.e. comprised of outer molecular layer, followed by two neuronal layers separated by a paucicellular band with myelinated fibers. This distinction could not be done in our patients because it cannot currently be achieved in vivo using MRI. Moreover, no histology was available because none of our patients underwent epilepsy surgery.
Processing of Funcional Data and Identification of Visual Areas
The first 8 timeframes of each functional run were discarded due to start‐up magnetization transients in the data. All remaining timeframes were blurred with an isotropic 3D Gaussian kernel (full‐width‐half‐maximum = 6 mm) to attenuate high‐frequency noise. The functional scans were corrected for subject motion within and between fMRI scan [Collins et al., 1994].
Early visual cortical areas were identified using volumetric phase‐encoded retinotopic mapping. The method and validations are published in our previous study [COBRA package; Dumoulin et al., 2003]. Briefly, the phase maps were created by taking the phase of the fundamental frequency (i.e., 6 cycles/scan) of the fMRI response. The phases of the fundamental frequency varied as a function of polar angle when the stimulus was the rotating wedge and as a function of eccentricity when subjects viewed expanding or contracting annuli. T‐statistical maps were created using a Spearman rank order test for each voxel, where the phase of the design matrix is taken from the corresponding phase map. By combining eccentricity and polar‐angle phase‐maps with the anatomical MRI, the visual field signs (VFS) of different visual areas could be segmented. To create a weighted map of the VFS computation, the VFS map was multiplied by the t‐statistical map. The absolute values in the resulting t‐statistical weighted VFS maps (tVFS) indicate statistical certainty of the VFS computation. Before this multiplication all values below 0 were set to 0 in the t‐statistical map to prevent VFS reversals. The statistical significance was set to t‐values of 4.7 corresponding to a P‐value of 0.05 corrected for multiple comparisons [Worsley et al., 1996]. Neighboring visual areas could be identified due to opposite field signs; i.e. V1, V2, V3/VP [Dumoulin et al., 2003; Sereno et al., 1994, 1995].
Thus this method enabled us to reveal the cortical topography of the visual field on the cortex by allowing a description of the cortical organization in terms of cortical area layout and neuronal arrangement within the areas.
RESULTS
Significant (P > 0.05) activations were observed in PMG cortex in all six hemispheres (3 patients). An example of the signal modulation induced by our stimulus paradigm in a voxel within the PMG is shown in Figure 2. The six stimulus cycles can be clearly distinguished, without temporal smoothing, in the fMRI data.
Figure 2.
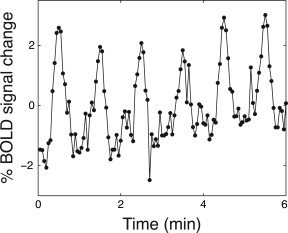
An example of a fMRI time intensity curve from one voxel in polymicrogyric cortex (patient 2). No temporal filtering was performed. Activity in PMG were modulated by the stimulus paradigm (P < 0.01 corrected for multiple comparisons, 6 stimulus cycles).
The next step of the analysis reconstructs the retinotopic layout of the visual field on the cortex [Dumoulin et al., 2003]. Figure 3 shows the VFS weighted by the corresponding t‐statistical image of the six hemispheres. Thus, the absolute tVFS value reflects the t‐statistical value whereas the sign reveals the VFS. The absolute tVFS values reveal statistically significant activation in PMG [|t| > 5, corresponding to P < 0.05, corrected for multiple comparisons; Worsley et al., 1996].
Figure 3.
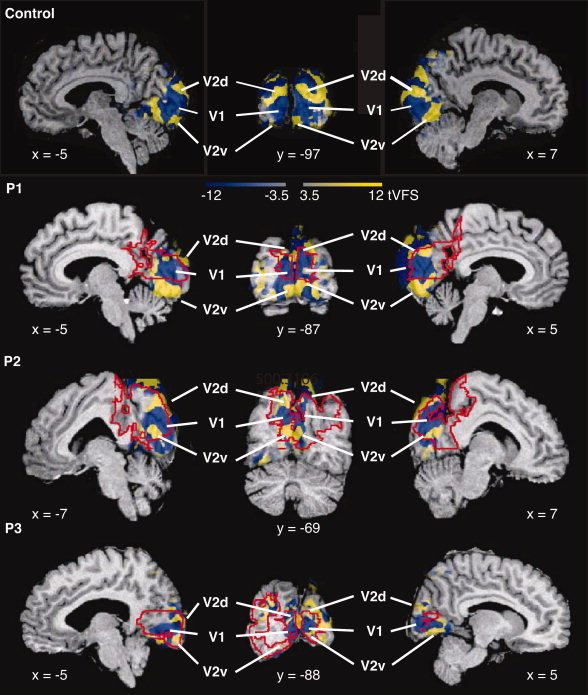
VFS maps are shown overlaid on the corresponding anatomical images for a control subject and the three patients in a stereotaxic space, weighted by the corresponding t‐statistical maps (tVFS). For each patient two sagittal slices through each hemisphere and a coronal slice are shown. Stereotaxic coordinates are indicated next to the slices. Blue and yellow correspond to opposite field signs, mirror and nonmirror image, respectively. The color intensity (both blue and yellow) reflect the t‐statistical value (|t| = 4.7 corresponds to P = 0.05, corrected for multiple comparisons). Different visual areas can be identified and are labeled in the volumes. Polymicrogyric cortex is delineated by red lines. [Color figure can be viewed in the online issue, which is available at www.interscience.wiley.com.]
Neighboring areas with different field signs can be distinguished, and the visual areas can be identified based on (1) their field sign, (2) what part of the visual field is represented, and (3) their relative organization. In all patients, a large region of negative (mirror image) representation of the visual field is present in the medial occipital lobe, around which regions with opposite field signs can be distinguished corresponding to the known layout of areas V1 and V2. Figure 3 shows the locations of V1 and V2 in each hemisphere. The VFS pattern is identical to that found in healthy subjects [Dumoulin et al., 2003; Sereno et al., 1994, 1995; Wohlschläger et al., 2005]. The layout corresponds to the known layout of areas V1 and V2 of healthy subjects [Amunts et al., 2000; Clarke and Miklossy, 1990; DeYoe et al., 1996; Dumoulin et al., 2003; Engel et al., 1997; Fox et al., 1987; Gilissen and Zilles, 1996; Gilissen et al., 1995; Hasnain et al., 1998, 2001; Holmes, 1945; Horton and Hoyt, 1991; Rademacher et al., 1993; Sereno et al., 1995; Stensaas et al., 1974; Tootell et al., 1997; Warnking et al., 2002; Wohlschläger et al., 2005; Wong and Sharpe, 1999]. Polymicrogyric cortex is delineated by red lines. From this figure it is apparent that for each hemisphere of each patient a large portion of the PMG overlaps with the tVFS maps.
The tVFS maps were also plotted on folded and unfolded cortical surfaces (see Fig. 4). These surfaces do not necessarily reconstruct all details of the PMG. This representation is done for visualization purposes only, since unlike other retinotopic mapping methods, our analysis does not depend on the cortical surfaces [Dumoulin et al., 2003]. Nevertheless, the surfaces provide a direct view of the cortical sheet not easily revealed in 3D volumes. Besides tVFS maps, the polar‐angle phase maps are shown in identical views. The colors of the phase maps correspond to the locations in the visual field as shown in the insets; the intensities of colors in the phase‐maps are also weighted by the t‐statistical maps in a scale identical to that of the tVFS maps. The black lines are the borders of visual areas as derived from the tVFS maps.
Figure 4.
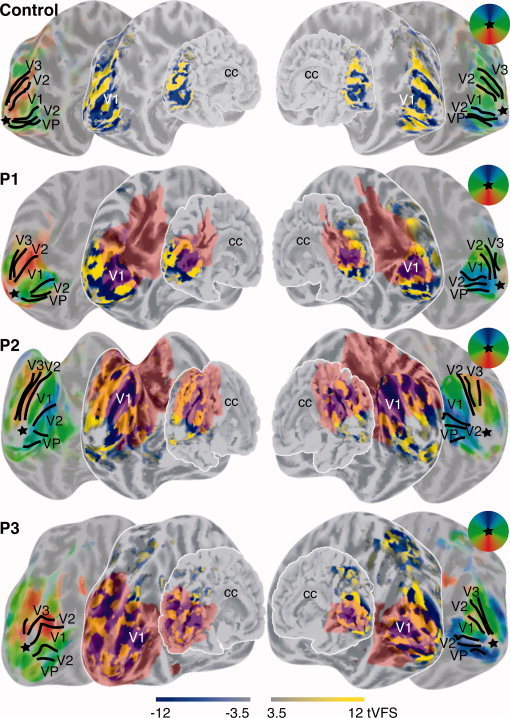
tVFS images are shown for a control subject and the three patients overlaid on their corresponding folded and unfolded cortical surfaces. All surfaces are viewed from a medio‐posterior viewpoint. Sulci are colored darker gray then the gyri. The corpus callosum (cc) is labeled to facilitate orientation on the surfaces. Besides surfaces overlaid with the tVFS maps, the same surfaces are shown overlaid with colored polar‐angle phase maps in identical views. Thus, all left and right surfaces are shown in identical views but contain different information. The visual fields reflected by the colors of the polar‐angle map are indicated in the circular window. The intensity of the phase maps is weighted by the t‐statistical maps identical to the tVFS maps. The black lines indicate borders between visual areas derived from the tVFS maps. The star indicates the approximate cortical representation of the fovea. [Color figure can be viewed in the online issue, which is available at www.interscience.wiley.com.]
The surface based representation reveals the characteristic alternation of VFS, which is in accordance with the known layout of the visual areas. A large negative field sign representation is surrounded by a region of positive field sign, corresponding to visual areas V1 and V2. Bordering V2 lays V3/VP with a negative field sign [Dumoulin et al., 2003; Sereno et al., 1995]. The representations of the polar‐angle maps provide results similar to those of DeYoe et al. [1996] and Engel et al. [1997], where on these kinds of representations the borders of the visual areas are identified. These maps reveal a gradual alternation of the representation of the polar‐angle axis of the visual field. The borders on the phase maps in Figure 4 are derived from the corresponding tVFS maps and fall at the horizontal and vertical meridia, as they are known to occur. Polymicrogyric cortex is shown in red on all surfaces except the ones displaying of the polar‐angle maps. The labeling of PMG in the polar‐angle maps has been left out since the colored PMG overlays interfered with the visualization of the color alternation of the polar‐angle maps. The surface views of the polar‐angle maps are identical as the neighboring surfaces on which the PMG are delineated.
Both the VFS patterns and polar‐angle maps on the cortical surfaces are in accordance with previous studies [DeYoe et al., 1996; Dumoulin et al., 2003; Engel et al., 1997; Sereno et al., 1995; Tootell et al., 1997; Warnking et al., 2002]. In all patients and hemispheres visual area V1, V2, V3/VP could be identified. The cortical organization, both within and between areas, follows the known cortical layout, even though substantial overlap between the areas and PMG exist. Except for one hemisphere, primary visual cortices are located in their entirety in PMG.
DISCUSSION
In this study we assessed the cortical organization and visual function in three patients with epilepsy and occipital PMG using fMRI with phase‐encoded retinotopic mapping methodology. Our results showed stimulus‐driven fMRI modulation in the PMG. The finding that signals can be elicted from PMG is consistent with previous functional imaging studies of visual system in animals [Schwindt et al., 2004] and humans [Burneo et al., 2004; Innocenti et al., 2001; Janszky et al., 2003; Paetau et al., 2004].
Using the phase‐encoded retinotopic mapping methodology for the first time in patients with PMG, we were able to assess the functional organization of the visual cortex in term of cortical area layout and the neuronal arrangement within the areas. Our findings point to a normal cortical organization of early visual areas, V1, V2, and V3/VP, within PMG.
The intrinsic organization and layout of the cortical areas as shown in Figures 3 and 4 are consistent with normal cortical topography of visual areas derived in human subjects using fMRI [DeYoe et al., 1996; Dumoulin et al., 2003; Engel et al., 1997; Sereno et al., 1995; Tootell et al., 1997; Warnking et al., 2002] and positron emission tomography [Fox et al., 1987; Hasnain et al., 1998, 2001]. Our results are also consistent with those obtained from human lesion studies [Holmes, 1945; Horton and Hoyt, 1991; Wong and Sharpe, 1999] and human mylo and cytoarchitectonic studies [Amunts et al., 2000; Clarke and Miklossy, 1990; Gilissen and Zilles, 1996; Gilissen et al., 1995; Rademacher et al., 1993].
In all but one hemisphere and within our stimulus range, we found that primary visual cortex (V1) overlapped completely with the PMG. Primary visual cortex is essential for normal visual perception, and any nonfunctional regions of V1 lead to visual scotomas (blind spots) in corresponding retinotopic locations of the visual field [Holmes, 1945], whereas local lesions in higher visual areas lead to more complex visual deficits, but not necessarily to scotomas. These visual scotomas, but not necessarily more complex visual deficits, can be detected using Humphrey perimetry [Wall, 2004; Wong and Sharpe, 2000]. All three patients in our study displayed normal visual function as shown by Humphrey perimetry field analyzer. This is consistent with studies reporting predominantly normal visual function in patients with parieto‐occipital PMG [Guerrini et al., 1997; Zesiger et al., 2002]. Therefore, our results suggest that human polymicrogyric cortex, or at least area V1 in PMG, is actively involved in the processing of visual information and contributes to normal visual perception.
Gross Anatomical Morphology
In our patients the gross anatomical morphology of the occipital lobe was distorted (see Fig. 1). V1 is typically found within the calcarine sulcus [Gilissen and Zilles, 1996; Rademacher et al., 1993; Stensaas et al., 1974]. The calcarine sulcus is a large anterior‐posteriorly oriented sulcus located roughly halfway the medial wall of the occipital lobe [Ono et al., 1990]. In patient 2, the calcarine sulcus extended onto the dorsal side of the occipital lobe, whereas in patient 3, it was located ventromedially (see Fig. 1, 3, and 4). Even though this particular variation of the calcarine sulcus may still fall within normal bounds [Amunts et al., 2000; Dumoulin et al., 2003; Wohlschläger et al., 2005], the observation that the site of visual cortex in PMG may be shifted with regard to gross anatomical features is consistent with previous studies localizing somatosensory, auditory, and visual cortex, where these localizations were shifted with respect to gross morphological anatomy [Janszky et al., 2003; Paetau et al., 2004]. Using PET and MEG source localization, a shift of motor [Richardson et al., 1998], visual [Richardson et al., 1998], and somatosensory activation [Burneo et al., 2004] has also been described relative to normal anatomy in other malformations of cortical development. Our results indicate that, although there may be a shift in the overall location of visual cortical areas, the intrinsic organization and function can still be preserved.
Functional and Morphological Properties of PMG
Previous functional studies using MEG in patients with PMG have reported abnormal signals elicited by sensory stimulation from polymicrogyric cortex [Ishitobi et al., 2005; Paetau et al., 2004]. These abnormal MEG signals consisted primarily of reduced [Ishitobi et al., 2005; Paetau et al., 2004], but also of giant MEG activity [Ishitobi et al., 2005] in response to sensory stimulation. The MEG signal is influenced by the cortical morphology [Hillebrand and Barnes, 2002], the abnormal gyrification in PMG may create tangential sources on opposing sulcal walls. When these sources are active simultaneously and synchronously, they create opposing tangential dipoles, the field pattern of which will mostly cancel each other out [Ahlfors et al., 1999; Srinivasan, 1999]. Thus, inferring abnormal function from MEG studies is problematic due to the large alterations in cortical anatomy. On the other hand, because the source of signal origin and spatio‐temporal resolutions of the fMRI and MEG differ, it is possible that the abnormal MEG and normal fMRI signals reflect distinct aspects of neuronal functioning in PMG.
BOLD fMRI on the other hand relies on hemodynamic signals and may be susceptible to vascular anomalies associated with PMG. Furthermore, retinotopic mapping methods rely on both the anatomical and functional information. Therefore, anatomical malformations could distort retinotopic maps of an otherwise normal functional organization. Although we cannot exclude any of these distortions, we do not believe that they play a significant role in our data, primarily, because we were able to reconstruct normal functional organization. More specifically, in order to prevent aliased signals due to the resolution differences of the anatomical and functional data, the anatomical data was resampled to the resolution of the functional data — thereby limiting the occurrence of aliased retinotopic volumetric maps [Dumoulin et al., 2003] but decreasing their resolution (∼6 fwhm).
The normal functional organization in our PMG patients is in contrast to animal studies where functional organization has been found to be disrupted by the presence of PMG in somatosensory cortex [Jacobs et al., 1999b; Rosen et al., 2001]. Several explanations may be provided for this apparent discrepancy. The animal model for PMG is produced by neocortical freeze lesions made within 48 h of birth in rat pups, creating hypoxic‐ischemic lesions similar to those in human PMG. Since the mechanism through which the PMG is created in animals is dissimilar to the pathogenic origins of the human form of the disease, the microgyral organization may also be different, with perhaps neuronal organization being less disrupted in our patients compared to that observed in animal models of PMG. In addition, different type of cortices may undergo differential pattern of neuronal organization, and a comparison of retinotopic organization in animal models of PMG would be more suitable. However, to our knowledge, there have been no such studies yet (for a study showing disruption of visual cortical organization by lesions during cortical development in ferrets see, Restrepo et al., 2003]. On the other hand, the spatial resolution of our in vivo fMRI images is poorer than the in vitro stained section methods used in animal studies. Thus, subtle disruptions of the retinotopic organization may have gone unrecognized in our patients.
In PMG organization of cortical layers is disrupted [Barkovich et al., 1995] and the formation of microgyri may be related to focal loss of certain lamina [Jacobs et al., 1999a]. Given the profoundly abnormal cortical morphology in our patients, it is surprising to find intact visual function and organization within PMG, and this suggests either a considerable redundancy in cortical visual circuitry or a significant plasticity of the polymicrogyric cortex involved in the processing of visual inputs. These findings are in line with our previous observation in patients with subcortical band heteropia showing that the abnormally layered subcortical band may sustain normal sensorimotor function [Jirsch et al., 2006]. While visual organization remains intact in our PMG patients, it is less clear whether these grossly abnormal occipital areas are involved in the genesis of these patients' seizures as intracranial EEG studies were not performed. Although polymicrogyric cortex has been shown to be intrinsically epileptogenic [Bast et al., 2005; Jacobs et al., 1999a], but this may be limited to only small fractions of a lesion that often spans several lobes [Kobayashi et al., 2005]. The absence of occipital discharges on scalp EEG or visual features in the semiology of seizures is similar to other series [Guerrini et al., 1997; Kuzniecky et al., 1997], and our normal functional data may further suggest that cortex separate from primary visual areas may be most important in the generation of these patients' attacks.
SUMMARY AND PRACTICAL CONSIDERATIONS
Normal visual function and cortical organization were observed in three patients with bilateral occipital PMG. More specifically, primary visual cortex (V1) was localized within PMG and normal visual function was described by Humphrey perimetry tests. Because nonfunctional regions in V1 result in blind spots in the visual field [Holmes, 1945], these results suggest that PMG cortex is actively contributing to visual perception. As suggested by other functional studies [Burneo et al., 2004; Janszky et al., 2003; Jirsch et al., 2006; Paetau et al., 2004; Richardson et al., 1998], the evaluation of cortical function and organization may be relevant when considering surgery in patients with malformations of cortical development.
Acknowledgements
The authors wish to thank Neda Bernasconi for her help in various stages of the project and the patients who took part in this study.
REFERENCES
- Ahlfors SP,Simpson GV,Dale AM,Belliveau JW,Liu AK,Korvenoja A,Virtanen J,Huotilainen M,Tootell RBH,Aronen HJ,Ilmoniemi RJ ( 1999): Spatiotemporal activity of a cortical network for processing visual motion revealed by MEG and fMRI. J Neurophysiol 82: 2545–2555. [DOI] [PubMed] [Google Scholar]
- Amunts K,Malikovic A,Mohlberg H,Schormann T,Zilles K ( 2000): Brodmann's areas 17 and 18 brought into stereotaxic space—Where and how variable? Neuroimage 11: 66–84. [DOI] [PubMed] [Google Scholar]
- Barkovich AJ,Rowley HA,Bollen AW ( 1995): Correlation of prenatal events with the development of polymicrogyria. Am J Neuroradiol 16: 822–827. [PMC free article] [PubMed] [Google Scholar]
- Baseler HA,Morland AB,Wandell BA ( 1999): Topographic organization of human visual areas in the absence of input from primary cortex. J Neurosci 19: 2619–2627. [DOI] [PMC free article] [PubMed] [Google Scholar]
- Baseler HA,Brewer AA,Sharpe LT,Morland AB,Jägle H,Wandell BA ( 2002): Reorganization of human cortical maps caused by inherited photoreceptor abnormalities. Nat Neurosci 5: 364–370. [DOI] [PubMed] [Google Scholar]
- Bast T,Ramantani G,Boppel T,Metzke T,Özkan Ö,Stippich C,Seitz A,Rupp A,Rating D,Scherg M ( 2005): Source analysis of interictal spikes in polymicrogyria: Loss of relevant cortical fissures requires simultaneous EEG to avoid MEG misinterpretation. Neuroimage 25: 1232–1241. [DOI] [PubMed] [Google Scholar]
- Brainard DH ( 1997): The psychophysics toolbox. Spat Vis 10: 433–436. [PubMed] [Google Scholar]
- Burneo JG,Kuzniecky RI,Bebin M,Knowlton RC ( 2004): Cortical reorganization in malformations of cortical development: A magnetoencephalographic study. Neurology 63: 1818–1824. [DOI] [PubMed] [Google Scholar]
- Clarke S,Miklossy J ( 1990): Occipital cortex in man: Organization of callosal connections, related myelo‐ and cytoarchitecture, and putative boundaries of functional visual areas. J Comp Neurol 298: 188–214. [DOI] [PubMed] [Google Scholar]
- Collins DL,Neelin P,Peters TM,Evans AC ( 1994): Automatic 3D intersubject registration of MR volumetric data in standardized Talairach space. J Comput Assist Tomogr 18: 192–205. [PubMed] [Google Scholar]
- DeYoe EA,Carman GJ,Bandettini P,Glickman S,Wieser J,Cox R,Miller D,Neitz J ( 1996): Mapping striate and extrastriate visual areas in human cerebral cortex. Proc Natl Acad Sci USA 93: 2382–2386. [DOI] [PMC free article] [PubMed] [Google Scholar]
- Dumoulin SO,Bittar RG,Kabani NJ,Baker CL Jr,Le Goualher G,Pike GB,Evans AC ( 2000): A new anatomical landmark for reliable identification of human area V5/MT: A quantitative analysis of sulcal patterning. Cereb Cortex 10: 454–463. [DOI] [PubMed] [Google Scholar]
- Dumoulin SO,Hoge RD,Baker CL Jr,Hess RF,Achtman RL,Evans AC ( 2003): Automatic volumetric segmentation of human visual retinotopic cortex. Neuroimage 18: 576–587. [DOI] [PubMed] [Google Scholar]
- Engel SA,Rumelhart DE,Wandell BA,Lee AT,Glover GH,Chichilnisky EJ,Shadlen MN ( 1994): FMRI of human visual cortex. Nature 369: 525. [DOI] [PubMed] [Google Scholar]
- Engel SA,Glover GH,Wandell BA ( 1997): Retinotopic organization in human visual cortex and the spatial precision of functional MRI. Cereb Cortex 7: 181–192. [DOI] [PubMed] [Google Scholar]
- Fox PT,Miezin FM,Allman JM,Van Essen DC,Raichle ME ( 1987): Retinotopic organization of human visual cortex mapped with positron‐ emission tomography. J Neurosci 7: 913–922. [DOI] [PMC free article] [PubMed] [Google Scholar]
- Gilissen E,Zilles K ( 1996): The calcarine sulcus as an estimate of the total volume of the human striate cortex: A morphometric study of reliability and intersubject variability. J Brain Res 37: 57–66. [PubMed] [Google Scholar]
- Gilissen E,Iba‐Zizen MT,Stievenart JL,Lopez A,Trad M,Cabanis EA,Zilles K ( 1995): Is the length of the calcarine sulcus associated with the size of the human visual cortex? A morphometric study with magnetic resonance tomograpy. J Brain Res 36: 451–459. [PubMed] [Google Scholar]
- Guerrini R ( 2005): Genetic malformations of the cerebral cortex and epilepsy. Epilepsia 46: 32–37. [DOI] [PubMed] [Google Scholar]
- Guerrini R,Dubeaua F,O Dulac M,Barkovich AJ,Kuzniecky SR,Fett SC,Jones‐Gotman M,Canapicchi R,Cross H,Fish D,Bonanni P,Jambaqut I,Andermann F ( 1997): Bilateral parasagittal parietooccipital polymicrogyria and epilepsy. Ann Neurol 41: 65–73. [DOI] [PubMed] [Google Scholar]
- Guerrini R,Sicca F,Parmeggiani L ( 2003): Epilepsy and malformations of the cerebral cortex. Epileptic Disord 5: 9–26. [PubMed] [Google Scholar]
- Hasnain MK,Fox PT,Woldorff MG ( 1998): Intersubject variability of functional areas in the human visual cortex. Hum Brain Mapp 6: 301–315. [DOI] [PMC free article] [PubMed] [Google Scholar]
- Hasnain MK,Fox PT,Woldorff MG ( 2001): Structure‐function spatial covariance in the human visual cortex. Cereb Cortex 11: 702–716. [DOI] [PubMed] [Google Scholar]
- Hillebrand A,Barnes GR ( 2002): A quantitative assessment of the sensitivity of whole‐head MEG to activity in the adult human cortex. Neuroimage 16: 638–650. [DOI] [PubMed] [Google Scholar]
- Holmes G ( 1945): The organization of the visual cortex in man. Proc R Soc Lond 132: 348–361. [Google Scholar]
- Horton JC,Hoyt WF ( 1991): Quadrantic visual field defects: A hallmark of lesions in extrastriate (V2/V3) cortex. Brain 1114: 1703–1718. [DOI] [PubMed] [Google Scholar]
- Humphreys P,Rosen GD,Press DM,Sherman GF,Galaburda AM ( 1991): Freezing lesions of the developing rat brain: A model for cerebrocortical microgyria. J Neuropathol Exp Neurol 50: 145–160. [DOI] [PubMed] [Google Scholar]
- Innocenti GM,Maeder P,Knyazeva MG,Fornari E,Deonna T ( 2001): Functional activation of microgyric visual cortex in a human. Ann Neurol 50: 672–676. [DOI] [PubMed] [Google Scholar]
- Ishitobi M,Nakasato N,Yoshimoto T,Iinuma K ( 2005): Abnormal primary somatosensory function in unilateral polymicrogyria: An MEG study. Brain Dev 27: 22–29. [DOI] [PubMed] [Google Scholar]
- Jacobs KM,Kharazia VN,Prince DA ( 1999a): Mechanisms underlying epileptogenesis in cortical malformations. Epilepsy Res 36: 165–188. [DOI] [PubMed] [Google Scholar]
- Jacobs KM,Mogensen M,Warren E,Prince DA ( 1999b): Experimental microgyri disrupt the barrel field pattern in rat somatosensory cortex. Cereb Cortex 7: 733–744. [DOI] [PubMed] [Google Scholar]
- Janszky J,Ebner A,Kruse B,Mertens M,Jokeit H,Seitz RJ,Witte OW,Tuxhorn I,Woermann FG ( 2003): Functional organization of the brain with malformations of cortical development. Ann Neurol 53: 759–767. [DOI] [PubMed] [Google Scholar]
- Jirsch JD,Bernasconi N,Villani F,Vitali P,Avanzini G,Bernasconi A ( 2006): Sensorimotor organization in double cortex syndrome. Hum Brain Mapp 27: 535–543. [DOI] [PMC free article] [PubMed] [Google Scholar]
- Kobayashi E,Bagshaw AP,Jansen A,Andermann F,Andermann E,Gotman J,Dubeau F ( 2005): Intrinsic epileptogenicity in polymicrogyric cortex suggested by EEG‐fMRI BOLD responses. Neurology 64: 1263–1266. [DOI] [PubMed] [Google Scholar]
- Kuzniecky R,Gilliam F,Morawetz R,Faught E,Palmer C,Black L ( 1997): Occipital lobe developmental malformations and epilepsy: Clinical spectrum, treatment, and outcome. Epilepsia 38: 175–181. [DOI] [PubMed] [Google Scholar]
- MacDonald D,Kabani N,Avis D,Evans AC ( 2000): Automated 3‐D extraction of inner and outer surfaces of cerebral cortex from MRI. Neuroimage 12: 340–356. [DOI] [PubMed] [Google Scholar]
- Morland AB,Baseler HA,Hoffmann MB,Sharpe LT,Wandell BA ( 2001): Abnormal retinotopic representations in human visual cortex revealed by fMRI. Acta Psychol 107: 229–247. [DOI] [PubMed] [Google Scholar]
- Ono M,Kubic S,Abernethey CD ( 1990): Atas of the Cerebral Sulci. Stuttgart: Thieme. [Google Scholar]
- Paetau R,Saraneva J,Salonen O,Valanne L,Ignatius J,Salenius S ( 2004): Electromagnetic function of polymicrogyric cortex in congenital bilateral perisylvian syndrome. J Neurol Neurosurg Psychiatry 75: 717–722. [DOI] [PMC free article] [PubMed] [Google Scholar]
- Pelli DG ( 1997): The Videotoolbox software for visual psychophysics: Transforming numbers into movies. Spat Vis 10: 437–442. [PubMed] [Google Scholar]
- Rademacher J,Caviness VS Jr,Steinmetz H,Galaburda AM ( 1993): Topographical variations of the human primairy cortices: Implications for neuroimaging, brain mapping, and neurobiology. Cereb Cortex 3: 313–329. [DOI] [PubMed] [Google Scholar]
- Restrepo CE,Manger PR,Spenger C,Innocenti GM ( 2003): Immature cortex lesions alter retinotopic maps and interhemispheric connections. Ann Neurol 54: 51–65. [DOI] [PubMed] [Google Scholar]
- Richardson MP,Koepp MJ,Brooks DJ,Coull JT,Grasby P,Fish DR,Duncan JS ( 1998): Cerebral activation in malformations of cortical development. Brain 121: 1295–1304. [DOI] [PubMed] [Google Scholar]
- Rosen GD,Windzio H,Galaburda A ( 2001): Unilateral induced neocortical malformation and the formation of ipsilateral and contralateral barrel fields. Neuroscience 103: 931–939. [DOI] [PubMed] [Google Scholar]
- Schwindt W,Burke M,ÊHeiko J,Luhmann FP,Hoehn M ( 2004): Functional magnetic resonance imaging and somatosensory evoked potentials in rats with a neonatally induced freeze lesion of the somatosensory cortex. J Cereb Blood Flow Metab 24: 1409–1418. [DOI] [PubMed] [Google Scholar]
- Sereno MI,McDonald CT,Allman JM ( 1994): Analysis of retinotopic maps in extrastriate cortex. Cereb Cortex 4: 601–620. [DOI] [PubMed] [Google Scholar]
- Sereno MI,Dale AM,Reppas JB,Kwong KK,Belliveau JW,Brady TJ,Rosen BR,Tootell RBH ( 1995): Borders of multiple visual areas in humans revealed by functional magnetic resonance imaging. Science 268: 889–893. [DOI] [PubMed] [Google Scholar]
- Sled JG,Zijdenbos AP,Evans AC ( 1998): A non‐parametric method for automatic correction of intensity non‐uniformity in MRI data. IEEE Trans Med Imag 17: 87–97. [DOI] [PubMed] [Google Scholar]
- Srinivasan R ( 1999): Methods to improve the spatial resolution of EEG. Int J Bioelectromagn 1: 102–111. [Google Scholar]
- Stensaas SS,Eddington DK,Dobelle WH ( 1974): The topography and variability of the primairy visual cortex in man. J Neurosurg 40: 747–755. [DOI] [PubMed] [Google Scholar]
- Sunness JS,Liu T,Yantis S ( 2004): Retinotopic mapping of the visual cortex using functional magnetic resonance imaging in a patient with central scotomas from atrophic macular degeneration. Ophthalmology 111: 1595–1598. [DOI] [PubMed] [Google Scholar]
- Talairach J,Tournoux P ( 1988): Co‐Planar Stereotaxic Atlas of the Human Brain. New York: Thieme. [Google Scholar]
- Tootell RBH,Mendola JD,Hadjikhani NK,Ledden PJ,Liu AK,Reppas JB,Sereno MI,Dale AM ( 1997): Functional analysis of V3A and related areas in human visual cortex. J Neurosci 17: 7060–7078. [DOI] [PMC free article] [PubMed] [Google Scholar]
- Wall M ( 2004): What's new in perimetry. J Neuro‐Ophthalmol 24: 46–55. [DOI] [PubMed] [Google Scholar]
- Warnking J,Dojat M,Guérin‐Dugué A,Delon‐Martin C,Olympieff S,Richard N,Chehikian A,Segebart C ( 2002): fMRI retinotopic mapping—Step by step. Neuroimage 17: 1665–1683. [DOI] [PubMed] [Google Scholar]
- Wohlschläger AM,Specht K,Lie C,Mohlberg H,Wohlschläger A,Bente K,Pietrzyk U,Stöcker T,Zilles K,Amunts K,Fink GR ( 2005): Linking retinotopic fMRI mapping and anatomical probability maps of human occipital areas V1 and V2. Neuroimage 26: 73–82. [DOI] [PubMed] [Google Scholar]
- Wong AMF,Sharpe JA ( 1999): Representation of the visual field in the human occipital cortex—A magnetic resonance imaging and perimetric correlation. Arch Ophthal 117: 208–217. [DOI] [PubMed] [Google Scholar]
- Wong AMF,Sharpe JA ( 2000): A comparison of tangent screen, Goldmann, and Humphrey perimetry in the detection and localization of occipital lesions. Ophthalmol 107: 527–544. [DOI] [PubMed] [Google Scholar]
- Worsley KJ,Marrett S,Neelin P,Vandal AC,Friston KJ,Evans AC ( 1996): A unified statistical approach for determining significant signals in images of cerebral activation. Hum Brain Mapp 4: 58–73. [DOI] [PubMed] [Google Scholar]
- Zesiger P,Kiper D,Maeder P,Deonna T,Innocenti GM ( 2002): Preserved visual function in a case of occipitoparietal microgyria. Ann Neurol 52: 492–498. [DOI] [PubMed] [Google Scholar]
- Zijdenbos AP,Forghani R,Evans AC ( 2002): Automatic pipeline analysis of 3D MRI data for clinical trials: Application to multiple sclerosis. IEEE Trans Med Imag 21: 1280–1291. [DOI] [PubMed] [Google Scholar]