

Abstract
Brain activation in studies using blood oxygenation level dependent (BOLD) FMRI is associated with an increase in T2* weighted signal between baseline and an active condition. This BOLD technique is often applied to study differences in brain activation between patients and healthy controls. However, the baseline T2* signal itself may also be different between groups, as shown in the hippocampus in Alzheimer's disease using the resting oxygen or ROXY approach (Small et al. [2002]: Ann Neurol 51:290–295). In the current study, we analyzed whole brain, voxel‐wise T2* weighted signal of averaged baseline scans of a BOLD FMRI experiment in 41 healthy elderly controls and 46 patients with mild cognitive impairment or Alzheimer's disease. In each subject, T2* weighted images were normalized to the CSF signal of the same image. Additionally, gray matter probability maps of high‐resolution structural scans were also compared between groups to assess atrophy. T2* signal was decreased in dementia in the hippocampus, insula/putamen, posterior and middle cingulate cortex, and parietal cortex. Most of these regions also showed decreased gray matter, except insula/putamen. Hippocampal and posterior cingulate gray matter differences were significantly larger than T2* differences. Therefore, decreased T2* signal in most regions are likely to be caused by gray matter atrophy, although decreased metabolism or perhaps iron deposition are also factors that may contribute. We conclude that in FMRI studies of dementia, not only the dynamic BOLD signal (activation and deactivation) but also the average baseline signal is diminished in certain regions. The method we applied may also be used in task‐related BOLD FMRI and add to the understanding of the mechanism of task‐related group differences. Hum Brain Mapp, 2007. © 2007 Wiley‐Liss, Inc.
INTRODUCTION
In few years time, FMRI has become the most commonly applied methodology to image brain activation. The majority of FMRI studies apply T2* weighted imaging, sensitive to blood oxygenation level dependent (BOLD) contrast [Ogawa et al., 1990]. Usually, the BOLD signals during at least two conditions are compared: a reference condition and a condition of activation. Increasing regional brain activation between conditions is associated with increasing BOLD signal.
FMRI is often applied to study group differences in brain activation, for example, differences between patients and healthy controls. In these studies, group differences between T2* signal changes between two conditions, often activation versus reference, are analyzed. However, the reference (or rest) T2* signal itself may also be different in certain regions. Recent BOLD FMRI data support the view that resting state FMRI data (that is, BOLD signal time courses during a resting state) contain much more information than would be expected when the temporal BOLD variations during resting state would simply be noise. Structured network activity is observed when time series of resting state data are analyzed [Beckmann et al., 2005; De Luca et al., 2005; Fox et al., 2005; Greicius et al., 2003; Laufs et al., 2003]. The reference signal in task‐related FMRI may reflect ongoing cognitive processes during presumed “rest” (absence of overt activity) [Gusnard and Raichle, 2001; Stark and Squire, 2001].
Besides network activity during resting state, other factors can also affect the signal. Of importance for studies of neurodegenerative diseases (i.e., dementia) is that atrophy also can affect the resting T2* signal: a change in the ratio of gray matter volume and CSF within a voxel changes the T2* signal. Further, in Parkinson's disease, the putaminal body has hypointense signal on T2 weighted MR images, thought to be because of an increase in iron deposition [Drayer et al., 1986a, b]. Region of interest analyses of hippocampal regions showed that the resting state T2* signal was diminished in AD in the hippocampus [Small et al., 2002]. The authors argued that this was caused by diminished metabolism, causing decreased resting BOLD signal [Small et al., 2002]. These hippocampal ROI analyses have not been extended to whole brain analyses. Whole brain, static (hence no time series) resting state T2* signal analyses in dementia is the topic of the current study.
Whatever the exact underlying cause for a specific population, different T2* weighted signal in the reference image has implications for BOLD activation studies when group x condition interactions are analyzed. Interpretation of the presence or absence of these interactions in the context of resting state (or reference condition) differences will further our understanding of disease‐related changes in brain activation.
Previously, we reported on altered activation and deactivation in early dementia [Rombouts et al., 2005a, b]. In the current study, we reanalyzed these data and determined the average rest whole brain static T2* weighted signal in each subject of the same dataset. We aimed to determine whether there are any regions with an altered baseline T2* weighted signal in dementia, and how these relate to atrophy.
METHODS
Subject Recruitment
Patients were recruited at the Alzheimer Center of the VU University Medical Center, Amsterdam, the Netherlands. MCI patients were diagnosed using criteria for amnestic MCI [Petersen et al., 2001], with mini mental state examination (MMSE) scores >25 [Folstein et al., 1975], and clinical dementia rating (CDR) scale scores of 0.5 [Morris, 1993]. Twenty‐eight MCI patients were included (age 74.0 ± 7.5 years and range 54–84 years; MMSE 26.9 ± 1.2; 8 male, 20 female; average education 2.2 ± 0.6 on a discrete scale with three levels: low = 1, middle = 2, and high = 3; three patients were left‐handed).
AD patients were diagnosed using NINCDS‐ADRDA criteria [McKhann et al., 1984], with MMSE scores >18 and CDR < 2. These values correspond to what is known as mild AD. Eighteen AD patients were included (age 74.1 ± 8.0 years and range 55–83 years; MMSE 22.5 ± 2.2; 11 male, 7 female, and education 1.7 ± 0.6; one patient was left‐handed). Forty‐one healthy controls (age 63.1 ± 5.2 years and range 50–75 years; MMSE 29.0 ± 0.9; 28 male, 13 female, and education 2.1 ± 0.7; two were left‐handed) were also included. The research was performed in compliance with the Code of Ethics of the World Medical Association (Declaration of Helsinki). The experiment was approved by the Medical Ethics Committee of the VU University Medical Center, Amsterdam. All subjects provided informed consent, patients under supervision of a lawful caregiver if necessary. Subjects were excluded if they had any significant medical, neurological, or psychiatric illness, or if they were taking medication or other substances known to influence cerebral function. In this study, only patients were included whose diagnosis had remained unaltered during a 6 month follow‐up. In this study, two groups were analyzed: all control versus all patients.
MR Acquisition
Imaging was carried out on a 1.5 T Sonata MR scanner (Siemens, Erlangen, Germany), using a standard circularly polarized head coil with foam padding to restrict head motion. For T2* weighted imaging, an echo planar imaging (EPI) sequence was used (echo time 60 ms, flip angle 90°, repetition time 2100 ms, matrix 64 × 64, field of view 192 × 192 mm2), to obtain 21 transverse slices (5 mm thickness and 1‐mm interslice gap). The EPI sequence was repeated many times as part of a longer activation paradigm (data not shown). For the current study, the first five T2* weighted volumes were deleted. Only the next 10 whole brain T2* weighted scans acquired during the 21 s fixation period at the beginning of the face encoding paradigm were used [Rombouts et al., 2005b]. A T1‐weighted structural MRI‐scan was also acquired (MPRAGE, inversion time: 950 ms and TR = 2700 ms; TE = 3.97 ms; flip angle = 8°, 160 coronal slices, 1 × 1 × 1.5 mm3 voxels).
Data Analysis
Image analysis was carried out using FSL 3.2 (FMRIB's Software Library, http://www.fmrib.ox.ac.uk/fsl [Smith et al., 2004]). EPI scans were first corrected for motion [Jenkinson et al., 2002]. Of both EPI scans and the structural scan, non‐brain structures were removed [BET, Smith, 2002]. In each subject, the 10 EPI scans during fixation (control condition) were then averaged to create the static BOLD reference state image. This image was registered to the structural image in each subject separately using affine registration [FLIRT, Jenkinson et al., 2002]. Structural images of each subject were segmented into gray matter, white matter, and CSF [Zhang et al., 2001]. Average CSF signal in the EPI image was determined as follows. Voxels in the segmented structural image with the very highest probability of being classified as CSF, and located in the lateral ventricles were considered CSF. This approach decreases the possibility of including unwanted signal of other compartments than CSF. Since the EPI scan was registered to the structural scan, the EPI signal in those CSF regions was averaged to obtain the average CSF signal on the EPI scans. Next, in each subject, a normalized EPI scan was calculated by dividing each voxel's signal by this average CSF signal. With this approach of normalization, we assumed that the absolute MR signal of CSF in the T2* weighted scan is identical in patients and controls. Thus, all CSF signal variation in the T2* weighted images is assumed to result from variation between subjects in the total gain in the receive pathway of the MR scanner. Next, both these normalized EPI images and the gray matter probability (GMP) images were put in standard space after registering each subject's structural image to the MNI 152 standard space (average T1 brain image constructed from 152 normal subjects at the Montreal Neurological Institute, Montreal, QC, Canada) by using affine registration [FLIRT, Jenkinson et al., 2002]. In standard space, all images were spatially smoothed using FWHM = 8 mm.
First, normalized EPI signal was compared voxel‐wise using FSL with a two sample t test (P < 0.001) without age and gender as covariates. Although age was different between groups and should be corrected for in the statistical model, we first aimed to show differences in EPI signal with the most sensitive analysis. Of each region that was significantly different between patients and controls on the normalized EPI images, both EPI and GMP signal was averaged, giving T2* and GMP variables. These two variables per region were then further analyzed using a GLM testing for group differences per region, both without and with age and gender as covariates. Further, it was tested whether one variable showed a significantly larger group difference than the other. Hence, of all regions that turned out to have different T2* weighted signal without including age and gender as covariates, we also analyzed whether these differences were present on GMP maps (and which difference was greater than the other). Additionally, all was reanalyzed with age and gender as covariates.
RESULTS
Patients showed increased T2* signal near the ventricles in the whole brain voxel‐wise analysis without covariates (Fig. 1). This is because CSF has highest signal intensity on T2* weighted scans, and ventricles are enlarged in patients. The presence of both ischemia and white matter lesions, which occur more often in dementia than in healthy aging, may also contribute to the enhanced T2* signal in those regions.
Figure 1.
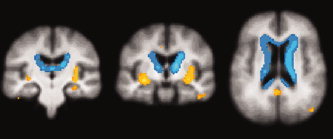
Coronal and transverse sections showing significant signal differences of static BOLD EPI images between controls and patients, projected on the average structural scan of all subjects (P < 0.001, uncorrected). In blue: signal decreases in healthy controls; in orange/yellow: signal increases in healthy controls. Signal decreases are located at the borders of ventricles. Signal increases are located in left hippocampus (image on the left), insula/putamen bilateral (image on left and in middle) and posterior cingulate cortex/precuneus (image on the right).
Compared to controls, patients showed decreased T2* signal in the left hippocampus, middle and posterior cingulate cortex/precuneus, left and right insula/putamen, and left parietal cortex (Fig. 1).
In these six regions, both T2* signal and GMP variables were averaged and analyzed further. In all regions, except the bilateral insula/putamen, patients also had decreased GMP when compared with controls (Table I). In two of these regions (left hippocampus and posterior cingulate cortex), the group differences were significantly greater for GMP than T2*.
Including age and gender as covariates showed that only the T2* variable in the posterior cingulate/precuneus was no longer significantly different between patients and controls (P = 0.08), all other differences and interactions remained significant (Table I).
Table 1.
Z‐scores of between‐group comparisons of regions with a decreased T2* weighted signal in patients compared to healthy controls.
| No covariates | With covariates age and gender | Interaction | |||
|---|---|---|---|---|---|
| T2* | GMP | T2* | GMP | ||
| Left hippocampus | 3.6 | 6.8 | 2.0 | 5.1 | Yes, GMP larger group difference |
| Post cingulate / precuneus | 3.6 | 6.2 | 1.7 ∧ | 4.0 | Yes, GMP larger group difference |
| Mid cingulate | 3.8 | 3.0 | 2.4 | 2.2 | No |
| Left insula / putamen | 4.8 | 1.0 ∧ | 2.9 | 2.1 | No |
| Right insula / putamen | 4.8 | 1.6 ∧ | 2.7 | 1.7 ∧ | No |
| Left parietal | 4.6 | 5.4 | 3.4 | 3.9 | No |
Z‐scores are shown for group differences using a general linear model with and without age and gender as covariates.
T2*: signal of normalized static BOLD‐sensitive images.
GMP: grey matter probability maps based on structural T1‐weighted high resolution scan.
Interaction: testing whether one variable (T2* / GMP) showed a significantly larger group difference than the other (GMP / T2*).
∧: not significantly different between groups (p<0.05)
DISCUSSION
We introduced a method to compare whole brain, voxel‐wise T2* weighted signal of an averaged “fixation state” scan between groups on images commonly used for task‐related FMRI. This was done by creating T2* weighted images, which were normalized to the CSF signal of the same image. We also compared these T2* group differences to GMP group differences. We found decreased T2* signal in dementia in the hippocampus, insula/putamen, posterior and middle cingulate cortex, and parietal cortex. Most of these regions also showed decreased GMP, except insula/putamen. Hippocampal and posterior cingulate GMP differences were significantly larger than T2* differences. Therefore, most T2* differences are likely to be caused by GM atrophy, although decreased metabolism, or perhaps iron deposition are also factors that may contribute. Furthermore, it should be noted that reduced GMP is not a direct indicator of atrophy. Differences in anatomic variability, in accuracy of segmentation and registration to standard space of patients' and controls' images may also contribute to the observed GMP differences.
Small et al. analyzed individual hippocampal subregions using regions of interest on T2* weighted, high resolution scans in young and elderly cases (the resting oxygen or ROXY approach, [Small et al., 2002]). It was found that signal of two specific hippocampal subregions declined normally with age, and one subregion showed pathological decline. The authors further showed that the ROXY signal in the entorhinal cortex correlated with memory decline, suggesting that ROXY signal of this region might be an early marker of AD. Here, we also compared resting T2* weighted signal and for the first time, this was analyzed throughout the whole brain. Although at lower spatial resolution, we also found T2* signal decrease in the hippocampus. The spatial resolution used in the current study and the applied group averaging did not allow to determine the exact subregion. However, because of the whole brain approach, we also found that other regions than the hippocampus had decreased T2* weighted signal. Posterior cingulate cortex and precuneus also had a decreased T2* weighted signal. Reduced activity in these regions in early AD is a common finding using PET and SPECT scanning [Johnson et al., 1998; Matsuda, 2001; Minoshima et al., 1997]. Gray matter loss in these regions has also been shown using MRI [Karas et al., 2003, 2004]. In the current study, insula/putamen also had diminished T2* signal. These regions are not commonly found to have diminished activity in dementia with any scanning technique, although insular atrophy has been shown in early AD using MRI [Karas et al., 2003, 2004].
In the study of Small et al., the signal changes could not have been caused by atrophy because of the high resolution ROI analysis. The authors argued that this was caused by diminished metabolism, causing decreased resting BOLD signal [Small et al., 2000, 2002]. In our current study, atrophy could also have affected the resting BOLD signal: if the gray matter/CSF ratio within a voxel changes, the T2* weighted signal in that voxel will also change. There may also be factors that cause T2* change, which are not caused by BOLD signal or atrophy. In Parkinson's disease, hypointensity of the putaminal body has often been described [Drayer et al., 1986a, b]. It has been suggested that the underlying cause is increased local iron depositioning in Parkinson's disease [Drayer et al., 1986a, b]. Although, to our knowledge, there is no evidence that this also occurs in dementia, it could also (partly) explain the diminished T2* weighted signal in the current study, with perhaps an increased likelihood in the putamen/insula.
We cannot exclude that more regions of decreased T2* signal are present in gray matter. CSF has high signal on T2* weighted images. Partial volume effects can mask or even increase the signal in atrophic regions with (therefore invisible) decreased T2* signal in gray matter. To further analyze this, T2* images should be accurately be segmented into gray, white matter, and CSF. With the current spatial resolution, it was impossible to get a very accurate segmentation. For this, high resolution T2* weighted images would be needed.
We conclude that in FMRI studies of dementia, not only the dynamic BOLD signal (activation, deactivation, or resting state connectivity), but also the static signal is diminished in certain regions. We have discussed the possible underlying mechanisms. This technique may provide an easy to apply, whole brain imaging method to study early changes in dementia, as previously shown for the hippocampal region [Small et al., 2002]. Further, it may be used in task‐related BOLD FMRI and add to the understanding of the mechanism of task‐related group differences.
REFERENCES
- Beckmann CF,DeLuca M,Devlin JT,Smith SM ( 2005): Investigations into resting‐state connectivity using independent component analysis. Philos Trans R Soc Lond B Biol Sci 360: 1001–1013. [DOI] [PMC free article] [PubMed] [Google Scholar]
- De Luca M,Beckmann CF,De Stefano N,Matthews PM,Smith SM ( 2005): fMRI resting state networks define distinct modes of long‐distance interactions in the human brain. Neuroimage 29: 1359–1367. [DOI] [PubMed] [Google Scholar]
- Drayer B,Burger P,Darwin R,Riederer S,Herfkens R,Johnson GA ( 1986a): MRI of brain iron. AJR Am J Roentgenol 147: 103–110. [DOI] [PubMed] [Google Scholar]
- Drayer BP,Olanow W,Burger P,Johnson GA,Herfkens R,Riederer S ( 1986b): Parkinson plus syndrome: Diagnosis using high field MR imaging of brain iron. Radiology 159: 493–498. [DOI] [PubMed] [Google Scholar]
- Folstein MF,Folstein SE,McHugh PR ( 1975): “Mini‐mental state.” A practical method for grading the cognitive state of patients for the clinician. J Psychiatr Res 12: 189–198. [DOI] [PubMed] [Google Scholar]
- Fox MD,Snyder AZ,Vincent JL,Corbetta M,Van Essen DC,Raichle ME ( 2005): The human brain is intrinsically organized into dynamic, anticorrelated functional networks. Proc Natl Acad Sci USA 102: 9673–9678. [DOI] [PMC free article] [PubMed] [Google Scholar]
- Greicius MD,Krasnow B,Reiss AL,Menon V ( 2003): Functional connectivity in the resting brain: A network analysis of the default mode hypothesis. Proc Natl Acad Sci USA 100: 253–258. [DOI] [PMC free article] [PubMed] [Google Scholar]
- Gusnard DA,Raichle ME ( 2001): Searching for a baseline: functional imaging and the resting human brain. Nat Rev Neurosci 2: 685–694. [DOI] [PubMed] [Google Scholar]
- Jenkinson M,Bannister P,Brady M,Smith S ( 2002): Improved optimization for the robust and accurate linear registration and motion correction of brain images. Neuroimage 17: 825–841. [DOI] [PubMed] [Google Scholar]
- Johnson KA,Jones K,Holman BL,Becker JA,Spiers PA,Satlin A,Albert MS ( 1998): Preclinical prediction of Alzheimer's disease using SPECT. Neurology 50: 1563–1571. [DOI] [PubMed] [Google Scholar]
- Karas GB,Burton EJ,Rombouts SA,van Schijndel RA,O'Brien JT,Scheltens P,McKeith IG,Williams D,Ballard C,Barkhof F ( 2003): A comprehensive study of gray matter loss in patients with Alzheimer's disease using optimized voxel‐based morphometry. Neuroimage 18: 895–907. [DOI] [PubMed] [Google Scholar]
- Karas GB,Scheltens P,Rombouts SA,Visser PJ,van Schijndel RA,Fox NC,Barkhof F ( 2004): Global and local gray matter loss in mild cognitive impairment and Alzheimer's disease. Neuroimage 23: 708–716. [DOI] [PubMed] [Google Scholar]
- Laufs H,Krakow K,Sterzer P,Eger E,Beyerle A,Salek‐Haddadi A,Kleinschmidt A ( 2003): Electroencephalographic signatures of attentional and cognitive default modes in spontaneous brain activity fluctuations at rest. Proc Natl Acad Sci USA 100: 11053–11058. [DOI] [PMC free article] [PubMed] [Google Scholar]
- Matsuda H ( 2001): Cerebral blood flow and metabolic abnormalities in Alzheimer's disease. Ann Nucl Med 15: 85–92. [DOI] [PubMed] [Google Scholar]
- McKhann G,Drachman D,Folstein M,Katzman R,Price D,Stadlan EM ( 1984): Clinical diagnosis of Alzheimer's disease: Report of the NINCDS‐ADRDA Work Group under the auspices of Department of Health and Human Services Task Force on Alzheimer's Disease. Neurology 34: 939–944. [DOI] [PubMed] [Google Scholar]
- Minoshima S,Giordani B,Berent S,Frey KA,Foster NL,Kuhl DE ( 1997): Metabolic reduction in the posterior cingulate cortex in very early Alzheimer's disease. Ann Neurol 42: 85–94. [DOI] [PubMed] [Google Scholar]
- Morris JC ( 1993): The clinical dementia rating (CDR): current version and scoring rules. Neurology 43: 2412–2414. [DOI] [PubMed] [Google Scholar]
- Ogawa S,Lee TM,Kay AR,Tank DW ( 1990): Brain magnetic resonance imaging with contrast dependent on blood oxygenation. Proc Natl Acad Sci USA 87: 9868–9872. [DOI] [PMC free article] [PubMed] [Google Scholar]
- Petersen RC,Stevens JC,Ganguli M,Tangalos EG,Cummings JL,Dekosky ST ( 2001): Practice parameter: Early detection of dementia: Mild cognitive impairment (an evidence‐based review)—Report of the Quality Standards Subcommittee of the American Academy of Neurology. Neurology 56: 1133–1142. [DOI] [PubMed] [Google Scholar]
- Rombouts SA,Barkhof F,Goekoop R,Stam CJ,Scheltens P ( 2005a): Altered resting state networks in mild cognitive impairment and mild Alzheimer's disease: An fMRI study. Hum Brain Mapp 26: 231–239. [DOI] [PMC free article] [PubMed] [Google Scholar]
- Rombouts SA,Goekoop R,Stam CJ,Barkhof F,Scheltens P ( 2005b): Delayed rather than decreased BOLD response as a marker for early Alzheimer's disease. Neuroimage 26: 1078–1085. [DOI] [PubMed] [Google Scholar]
- Small SA,Wu EX,Bartsch D,Perera GM,Lacefield CO,DeLaPaz R,Mayeux R,Stern Y,Kandel ER ( 2000): Imaging physiologic dysfunction of individual hippocampal subregions in humans and genetically modified mice. Neuron 28: 653–664. [DOI] [PubMed] [Google Scholar]
- Small SA,Tsai WY,DeLaPaz R,Mayeux R,Stern Y ( 2002): Imaging hippocampal function across the human life span: Is memory decline normal or not? Ann Neurol 51: 290–295. [DOI] [PubMed] [Google Scholar]
- Smith SM ( 2002): Fast robust automated brain extraction. Hum Brain Mapp 17: 143–155. [DOI] [PMC free article] [PubMed] [Google Scholar]
- Smith SM,Jenkinson M,Woolrich MW,Beckmann CF,Behrens TE,Johansen‐Berg H,Bannister PR,De Luca M,Drobnjak I,Flitney DE,Niazy RK,Saunders J,Vickers J,Zhang Y,De Stefano N,Brady JM,Matthews PM ( 2004): Advances in functional and structural MR image analysis and implementation as FSL. Neuroimage 23( Suppl 1): S208–S219. [DOI] [PubMed] [Google Scholar]
- Stark CEL,Squire LR ( 2001): When zero is not zero: The problem of ambiguous baseline conditions in fMRI. Proc Natl Acad Sci USA 98: 12760–12765. [DOI] [PMC free article] [PubMed] [Google Scholar]
- Zhang Y,Brady M,Smith S ( 2001): Segmentation of brain MR images through a hidden Markov random field model and the expectation‐maximization algorithm. IEEE Trans Med Imaging 20:45–57. [DOI] [PubMed] [Google Scholar]