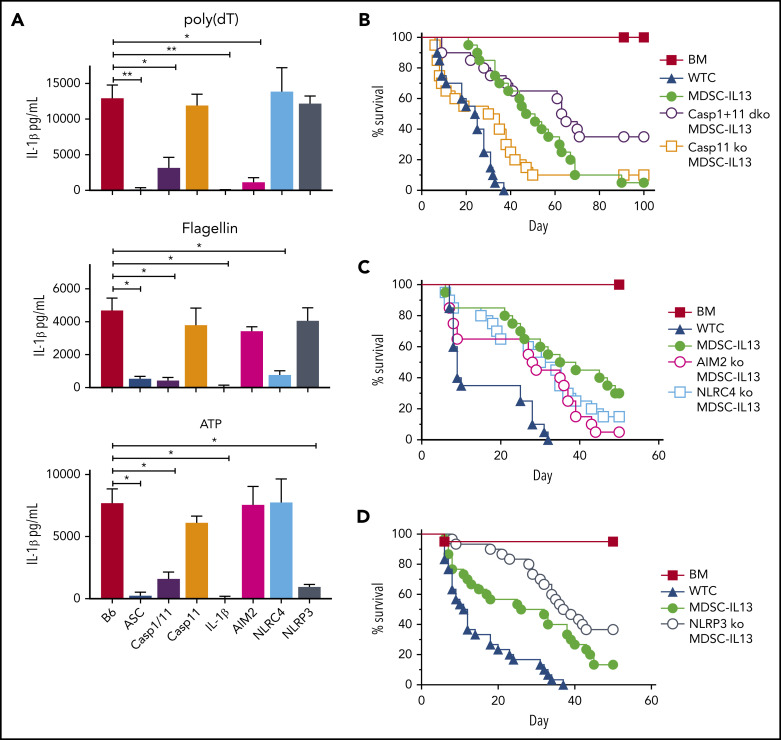
Figure 2.
MDSC-IL13s responsive to inflammasome induction. MDSC-IL13s were generated from WT (B6), ASC KO, caspase-1/-11 dKO, caspase-11 KO, IL-1β KO, AIM2 KO, NLRC4 KO, or NLRP3 KO donors and then challenged with LPS (0.2 µg/ml) for 3 hours followed by poly(dT) (0.8 µg/mL), flagellin (0.12 µg/mL), or ATP (2 mM), as indicated. (A) One hour after full inflammasome induction, culture supernatants were analyzed for IL-1β by ELISA. Data represent 3 replicate cultures and 2 independent experiments. (B) Kaplan-Meier survival curve for Balb/c-recipient GVHD mice given BM, BM plus 2e6 CD25-depleted whole T cells (WTCs), and BM plus WTCs with MDSC-IL13s (M13) or caspase-1/-11 dKO MDSC-IL13s. WTCS vs M13, P < .0001; WTCS vs caspase-1/-11 dKO, P < .0001; M13 vs caspase-1/-11 dKO, P = .0389. Data represent combination of 2 independent experiments, n = 20 per group. (C) Same as in panel B, using AIM2 KO or NLRC4 KO MDSC-IL13s. WTCs vs all M13 groups, P < .003; M13 vs AIM2 KO or NLRC4 KO P = not significant. Data represent 2 independent pooled experiments, n = 20 per group. (D) Same as in panel B, using NLRP3 KO MDSC-IL13s. WTCs vs M13, P = .0001; WTCs vs NLRP3 KO, P < .0001; M13 vs NLRP3 KO, P = .0250. Data are representative of 3 independent pooled experiments, n = 30 per group. *P < .05, **P < .01.

