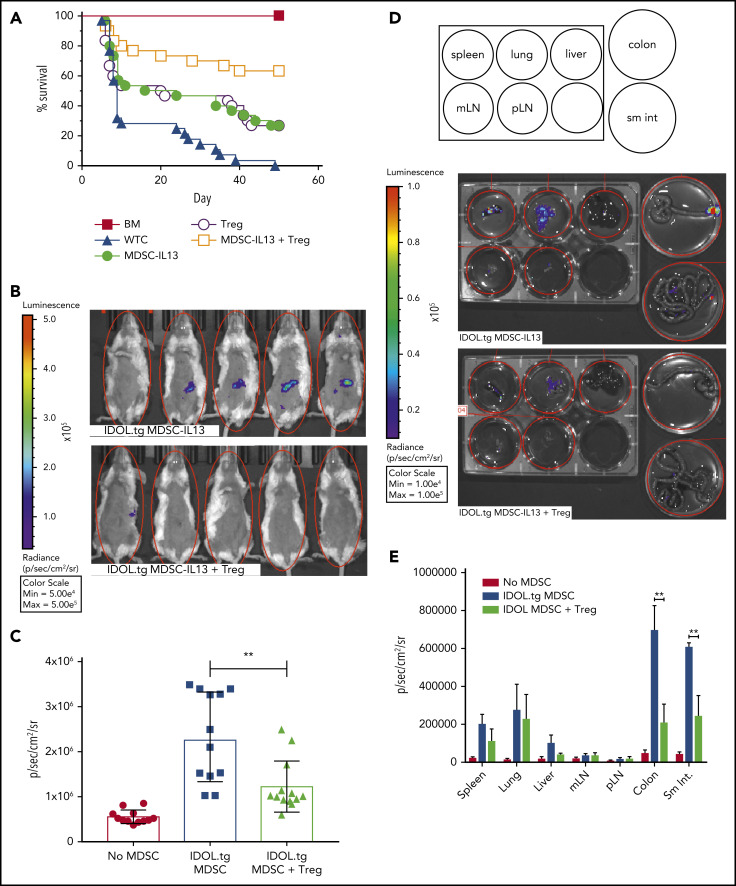
Figure 6.
Regulatory T cells promote enhanced survival by protecting MDSC-IL13 function. (A) Kaplan-Meier survival curve of Balb/c GVHD mice given MDSC-IL13s (6e6) and/or freshly isolated regulatory T cells (2e6). Whole T cells (WTCs) vs M13, P = .0022; WTCs vs Tregs, P = .0083; WTCs vs M13 plus Tregs, P < .0001; M13 vs Tregs, P = not significant; M13 vs M13 plus Tregs, P = .0064; Tregs vs M13 plus Tregs, P = .0047. Data are a combination of 3 independent experiments, n = 30 per group. (B) GVHD animals were treated as in panel A with MDSC-IL13s from IDOL-transgenic donors with or without Tregs. On day 5, animals were shaved and given 3 mg of D-luciferin intraperitoneally; BLI was performed after 5 minutes. (C) Summary BLI data, day 5, indicating the radiance values for the region of interest shown in Figure 6B. No MDSCs vs IDOL MDSCs, P < .0001; no MDSCs vs IDOL plus Tregs, P = .0006; IDOL vs IDOL plus Tregs, P = .0022. Data are from n ≥ 12 per group, representative of 2 independent experiments. (D) After whole-body imaging, animals were euthanized and organs explanted to dishes containing D-luciferin in solution for imaging as indicated. (E) Day 5 summary data of organ explants, n = 5 per group. **P < .01. mLN, mesenteric lymph node; pLN, peripheral LN; sm int, small intestine.

