Abstract
Here we present a detailed biophysical model of how brain electrical and vascular dynamics are generated within a basic cortical unit. The model was obtained from coupling a canonical neuronal mass and an expandable vasculature. In this proposal, we address several aspects related to electroencephalographic and functional magnetic resonance imaging data fusion: (1) the impact of the cerebral architecture (at different physical levels) on the observations; (2) the physiology involved in electrovascular coupling; and (3) energetic considerations to gain a better understanding of how the glucose budget is used during neuronal activity. The model has three components. The first is the canonical neural mass model of three subpopulations of neurons that respond to incoming excitatory synaptic inputs. The generation of the membrane potentials in the somas of these neurons and the electric currents flowing in the neuropil are modeled by this component. The second and third components model the electrovascular coupling and the dynamics of vascular states in an extended balloon approach, respectively. In the first part we describe, in some detail, the biophysical model and establish its face validity using simulations of visually evoked responses under different flickering frequencies and luminous contrasts. In a second part, a recursive optimization algorithm is developed and used to make statistical inferences about this forward/generative model from actual data. Hum. Brain Mapping 2006. © 2006 Wiley‐Liss, Inc.
Keywords: cerebral architecture, electrovascular coupling, brain energetic substrates, multicompartment models of neurons
INTRODUCTION
The assumption of functional specialization at the level of cortical neuronal assemblies (sometimes referred to as modules, Gazzaniga [2000]) constitutes the foundation of modern cognitive neuroscience. In humans, studies of basic mechanisms for segregation (i.e., activation maps) and integration (i.e., effective connectivity graphs) of such modules have been made possible by the use of noninvasive functional neuroimaging techniques such as electroencephalography (EEG) and functional magnetic resonance imaging (fMRI). By binding EEG and fMRI data we are able to overcome the limitations that these techniques present in terms of their ability to localize a single functional module in space and time, and at the same time maximize the potential of both [Makeig et al.,2002]. This is the chief motivation for developing concurrent EEG and fMRI data recording systems [Goldman et al.,2000; Salek‐Haddadi et al.,2003]. In order to properly integrate EEG and fMRI modalities, forward/generative models that characterize the physiological mechanisms underpinning the relationship between the neuronal activity and data must be invoked. Several approaches have been proposed over the last decade [Almeida and Stetter,2002; Arbib et al.,1995; Aubert and Costalat,2002; Deco et al.,2004; Friston et al.,2000,2003; Husain et al.,2004; Riera et al.,2005; Tagamets and Horwitz,1998, etc.]; however, there are some critical aspects that have only been partially discussed in these previous works. They are: (1) How does the cerebral architecture influence observations?, (2) What is the nature of the nonlinear electrovascular coupling?, and (3) How does the brain allocate energy for excitation and inhibition? We will directly or indirectly address all three of these issues in this article.
Cerebral Architecture and Observations
It is well accepted that EEG signals reflect the summation of small, but synchronized, extracellular electric currents mainly flowing along the apical trunk of large layer V pyramidal cells (PCs) arranged in parallel [Niedermeyer and Lopes da Silva,1999]. The resulting large‐scale extracellular electric current constitutes a mesoscopic phenomenon (i.e., the primary current density, PCD). Hence, the fluctuations of PCD during neuronal activity originate due to the unbalanced extracellular ionic gradient taking place between cortical layers I and V, which are rich in apical and basal dendrites of the layer V PCs, respectively [Nunez,1981]. Additionally, we now know that electrotonic forces among different compartments of the layer V PC mainly govern this ionic imbalance. These forces are the result of diversely located excitatory synaptic currents distributed along its dendrite trees. In order to characterize these electrotonic forces in a compartmental model of the layer V PC the inhibitory effect of GABAergic interneurons (INs) on its soma must also be included.
Conversely, the blood oxygenation level‐dependent (BOLD) signal, a mesoscopic phenomena in fMRI, has a vascular‐metabolic cause, thought to be more closely related to temporal fluctuations in the concentration of deoxy hemoglobin (dHb, a paramagnetic molecule) within a small volume (voxel) containing a large number of postcapillary venules. These venules can be stretched out during an increase in the cerebral blood flow (CBF), producing a reduction in the effective content of dHb within the voxel. The BOLD effect has been accurately replicated using the balloon approach, which has its foundation in the mechanically compelling representation of an expandable venule [Buxton et al.,1998] and the standard Windkessel theory [Mandeville et al.,1999]. The balloon approach, as originally proposed, includes a passive oxygen extraction effect occurring at the level of capillaries, although Zheng et al. [2002] generalized it to account for a vascular‐metabolic crosstalk by introducing a dynamic relationship between neuronal activation and the oxygen extraction fraction.
Electrovascular Coupling
Even though the BOLD signal has been misinterpreted as a locus of increased energy utilization [see Attwell and Iadecola,2002, for a critical discussion], the main BOLD effect quite clearly reflects, as yet beyond our understanding, a sizeable departure of the CBF from the resting states locked to the stimulus. Recent results indicate that BOLD signal fluctuations mainly correlate with the induced local field potentials [Kim et al.,2004; Logothetis et al.,2001; Logothetis,2003]. It is known that several electrovascular control mechanisms coexist within the functionally organized vascular networks [Harrison et al.,2002]. Although the existence of a parallel electrical network for global vascular control has been conjectured since the early discovery of perivascular structures (e.g., smooth muscle bands at the arterioles and plastic strips at the precapillary branching points, which could be both stimulated by cholinergic fibers from the basal forebrain [Attwell and Iadecola,2002]), the regulatory role of local nitric oxide (NO) release (closely coupled with CBF variations) has only recently come to be recognized as the principal mechanism for vascular control. Unfortunately, how this mechanism is triggered during neuronal activity remains a mystery.
In a pioneering work, Arbib et al. [1995] introduced a theoretical model for CBF triggering to test the hypothesis that inhibitory synapses can also produce a metabolic response. Arbib et al. [1995] proposed a relationship between the absolute value of integrated synaptic activity (i.e., a quantity that mixes up excitatory and inhibitory effects) and regional changes in CBF. Tagamets and Horwitz [1998] used this idea in an extended model containing canonical local circuits for multiple brain regions to give a neuronal substrate and a computational framework to neuroimaging data. Based on similar ideas, more complete models were developed in later studies [Almeida and Stetter,2002; Aubert and Costalat,2002]. Some authors recommended using the hemodynamic response function in this context to incorporate some nonlinear features of the BOLD effect [Deco et al.,2004; Husain et al.,2004]. Alternatively, Friston et al. [2000] introduced a blood flow‐inducing signal into the balloon approach relating neuronal activity and CBF. Stochastic driven forces were included by Riera et al. [2004a] at the level of the vascular states of this modified balloon approach. In order to distinguish the driving and modulatory effects among interacting neuronal masses, Friston et al. [2003] used a new differential equation to describe the neuronal activity, establishing a more ambitious link between these two brain substrates. Recently, Riera et al. [2004b] suggested a model of two coupled dynamics (i.e., fast electrical and slow vascular responses) interacting unidirectionally (i.e., from electrical to vascular). In this last model, the electrical and vascular responses were approached using two autoregressive equations, with exogenous inputs, linked by a static nonlinear coupling function. In order to examine effective connectivity between brain areas, Riera et al. [2005] fitted the model to mesostates in certain regions of interest obtained from concurrent EEG and fMRI recordings during an experiment of motor coordination.
Even with all these previous achievements, the basic activation mechanisms of the vascular response need to be modeled in more detail. There is, for example, still no explanation of the nonlinear relationships between the neuronal activity and the vascular reaction reported in animals [Devor et al.,2003; Hewson‐Stoate et al.,2005; Jones et al.,2004; Sheth et al.,2004]. In addition, the dose–response curves (e.g., stimulus frequency and contrast) found in both event‐related potentials and event‐related BOLD signals using visual experimental paradigms in humans [Galia et al.,2002; Singh et al.,2003; Zaletel et al.,2004] have not been discussed in the context of the previous theoretical models. Also, no good reason has been offered for the correlation observed between dc‐EEG and CBF [Vanhatalo et al.,2003].
Glucose Budget
Magistretti et al. [1999] claimed that ∼80% of the energy supplied to the brain is used to fuel both glutamate uptake from the synapses and glutamine formation in the astrocytes by a nonoxidative glucose mechanism. This claim has brought about an effervescent discussion regarding: 1) whether inhibitory synapses contribute to the metabolic (e.g., positron emission tomography, PET) and/or hemodynamic (e.g., fMRI) signals, and 2) the role played by mitochondrial oxidative metabolism used for the reestablishment of transmembrane ionic gradients, which could also trigger vascular changes in the course of neuronal activation. These fundamental problems are not yet completely understood. Contradictory results have been presented in several articles discussing the metabolic demand of the inhibitions [Caesar et al.,2003; Tagamets and Horwitz,2001; Waldvogel et al.,2000] and at the same time it has been recently proven that glucose (maybe after being transformed into lactate inside the astrocytes) is oxidized in a phase preceding the astrocytic glycolysis [Kasischke et al.,2004].
Rhythmic brain activity is due to strong competition (via inhibitions) and cooperation (via excitations) within local micronetworks (e.g., self‐sustained oscillations in the reticular thalamic nucleus of cat [Bazhenov et al.,1999], oscillations in Ferrer visual cortex layer II/III [Tucker and Katz,2003], theta oscillations in the rat hippocampus [Buzsaki,2002]) or between different neuronal assemblies (e.g., thalamocortical interactions can explain oscillatory activity during sleep or anesthesia [Steriade,2001]). In this sense, inhibitions play an important role in driving the synchronization [Beierlein et al.,2000; Markram et al.,2004]. The alarming negative correlations found between the power of the oscillatory alpha EEG activity and the vascular/metabolic response [Goldman et al.,2002; Sadato et al.,1998] could be a sign of an incomplete comprehension of the energetic substrates of neuronal inhibitions. As a consequence, it is not yet clear how the BOLD signal correlates with neuronal oscillatory activity (e.g., delta and gamma band activity can easily be observed at the scale of local field potentials [Leopold et al.,2003; Salek‐Haddadi et al.,2003]).
This lack of understanding of the interactions among several physiological (e.g., electric, metabolic and hemodynamic) processes at the level of neuronal masses, as well as with regard to their relationships to measurements, has been an obstacle to closing the gap that exists between functional neuroimaging and computational neurobiology.
In the present article a local electrovascular coupling (LEVC) model to explain concurrent EEG and fMRI recordings caused by neuronal computations in the neocortex is proposed. The model combines three coupled dynamic systems that describe the temporal courses of electrical and vascular states in a cortical unit. The first dynamic system explains the temporal variations in the membrane potentials at the somas of neurons belonging to a canonical neuronal mass of the cortex. This dynamic system also characterizes the fluctuations of the electric currents flowing in the neuropil, perpendicular to the cortical surface, as a result of the changes in these membrane potentials. A mechanism for vascular triggering is modeled by a second dynamic system. The third dynamic system describes vascular changes through an extended balloon approach.
The proposed canonical neuronal mass (see Fig. 1) contains three neuronal subpopulations, schematically represented by two GABAergic INs coupled with a layer V PC. The model encapsulates the basic architectural attributes of the neocortex at different levels (e.g., synapses diversities, neuronal geometries, multilayer printed wiring board). The output of the circuit is from axonal fibers of the layer V PCs and three classes of excitatory inputs at different cortical layers are introduced to differentiate connections with other neuronal masses. A three‐compartment model is proposed to characterize the electrotonic interactions in the layer V PC, while it is assumed that only one compartment can be used in the case of GABAergic INs. A nonlinear phase is introduced, which relates the size of the induced current in the postsynaptic neuron to the membrane potential in the soma of the presynaptic neuron. In this study the authors assume that the metabolic deficit in each neuron is well correlated with the capacitive energy stored across its whole membrane surface. This capacitive energy summarizes all types of transmembrane ionic currents (e.g., chemical‐gated channels at the synapses, electric‐gated channels, and passive leakage). The concentration of NO in the cortical unit represents a new vascular state in our model. The contribution of each neuron to that concentration is given by a neuron‐type dependent nonlinear function of the transmembrane capacitive current flowing across the whole cell surface. The sign of this transmembrane capacitive current will reflect inward and outward currents; hence, these nonlinear functions should be symmetric around zero and they must also include a saturation phenomenon in the synthesis of NO. The total concentration of NO within a cortical unit is obtained by a weighted sum of the contributions of the three different types of neurons. Finally, the vascular changes are triggered by a delayed and lowpass‐filtered version of NO concentration. This idea was inspired by the work of Arbib et al. [1995], who proposed the synaptic current as a candidate responsible for triggering vascular changes. However, in our model other types of ionic currents are also included. The electrical and vascular states of the model are related to mesostates obtained directly from data by two observation equations [Riera et al.,2005].
Figure 1.
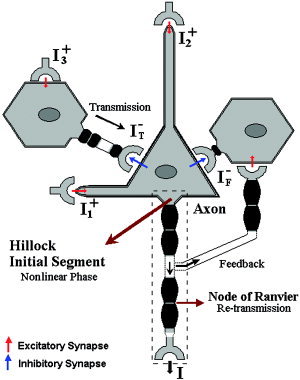
Illustration of the canonical neuronal mass model. This basic model of a cortical unit comprises three neurons: two GABAergic INs (Transmission and Feedback) and a layer V PC. The synaptic inputs are all excitatory I , I , and I , and they reach the cortical unit at different layers. The nonlinear phase occurs at the somatic hillock (initial segment of the axon). Red and blue arrows represent the excitatory and inhibitory synapses, respectively. The action potentials retransmit instantaneously via the nodes of Ranvier.
The remainder of this article is organized as follows. In the Theory section, the theoretical aspects of the LEVC model and the observation equations are presented in detail. In the Simulation Study section, two sets of simulations are presented: in the first simulation the consequences of including stochastic driven forces (i.e., to characterize population and diffusion random effects) are evaluated, and in the second simulation a possible explanation of the dose–response curves (i.e., stimulus frequency and contrast) and of the dc‐EEG and CBF correlation is provided. Finally, in the Discussion the novelty, advantages, and limitations of the model are discussed.
THEORY
Canonical Neuronal Mass
While performing multipurpose functions, the neocortex operates as a circuit of high complexity that at different levels preserves an exclusive modular organization [Breakspear and Stam,2005]. This hierarchical order can be observed at the cellular level, where the excitatory and inhibitory postsynaptic potentials are decodified in the dendritic trees, which accurately filter them in space and time to finally produce an integrated electrotonic reflection at the soma. For example, the dense and apparent haphazard grove of dendrites in the layer V PC exhibits a certain degree of specialization by discerning excitatory inputs coming from the apical and basal paths [Lytton and Sejnowski,1991; Major et al.,1994; Mel and Schiller,2004; Traub et al.,2005], which, in a second phase, merge with the mostly inhibitory contributions from several types of GABAergic INs that mainly project their axons into the neighborhood of the soma [Bacci et al.,2003; Tamas et al.,1998].
In the same way, the neurons at the level of micronetworks are organized following particular wiring diagrams that exhibit multiple loops with excitatory/inhibitory elements. Illustrations of such loops can be found, for instance, in Callaway [1998] for the primary visual cortex of a macaque monkey or in a recent computational detailed model proposed by Traub et al. [2005] to explain the local origin of gamma oscillations, sleep spindles, and epileptogenic bursts in the neocortex. Although these cortical circuits include assorted types of morphological and functional differentiated neurons (e.g., PCs, double bouquet cells, basket cells, spiny and aspiny stellate cells, etc.), they can be mainly grouped in excitatory PCs and inhibitory GABAergic INs. A basic micronetwork composed of the layer V PC connected with two types of GABAergic INs summarizes one of the main regularities in the cortical circuitry (see Fig. 1). These GABAergic INs differ in terms of the inhibitory effect they produce locally on the cortex, which could be due to feedforward or feedback type connections.
In the cortical sheet, the micronetworks organize in such a way that there are horizontal tessellations that serve to establish some classes of functional severance. There is an ongoing debate about how a single horizontal patch should be defined on the cortical surface: whether in terms of anatomical or functional boundaries [Horton and Adams,2005; Jones,2000; Nelson,2002; Rockland and Ichinohe,2004], ranging from the widespread columns to the diminished minicolumns and segregates. Additionally, it is well known that each of these cortical patches has a special vertical construction comprising six different layers with a whole thickness of 2–4 mm. In our model, a volume containing several of these basic micronetworks, which are assumed to operate with some sort of synchrony, constitute a cortical unit. The last assumption will allow us to use a simplified version of the mean field approach, which consists of introducing a multidimensional Wiener process characterizing both the fluctuations in a population of neurons and the randomness associated with diffusion phenomena. The extension of these cortical units could cover a circular area on the external surface of the cortex of around several millimeters in diameter.
A canonical neuronal mass based on the laminar architecture of the neocortex is proposed to characterize the population dynamics of certain electrical states (i.e., membrane potentials and extracellular electric currents) in a cortical unit. The most relevant properties used in the model are the laminar‐specific projections and structural design that permit inhibitory/excitatory‐based innervations to coexist in complicated networks of feeding with either forward or backward ingredients. For example, there is a sole output I [Crick and Asanuma,1986], while three inputs I , I , and I reaching the micronetworks at dissimilar layers are introduced to make a distinction in the nature of the connectivity patterns with other equivalent cortical units. These input/outputs, associated with large‐scale synaptic currents, have dimensions comparable to pA, and they are always set up as excitatory, with values between 0 and 1. The layer V PCs receive synaptic contacts of type I (excitatory) on the dendrites, in places called spines, and, less commonly, contact in the shafts of dendrites, while the synapses of type II (inhibitory) often contact the cell body (soma). Figure 1 illustrates symbolically the specifics of such inputs, distinguishing two types of excitatory synapses at the layer V PCs; those making contact with the level of basal dendrites I , essentially correlated with activation corresponding with thalamo‐cortical afferent projections, and those reaching either the level of tuft or trunk of apical dendrites I , mainly related with cortico‐cortical interactions. The inhibitory synapses in the brain have a local character, and are thought to give support to stabilizing the activity of PCs by GABAergic INs connections (this may be crucial in modulating complex network oscillations, [Bacci et al.,2003]). However, two types of local inhibitory effects will be differentiated in this model: the inhibitions by feedforward (or direct Transmission [Gil and Amitai,1996]) I , and the well‐known inhibitory Feedback I . The electrotonic reflection of I , I at the soma of the layer V PCs combines with the total inhibitory current I − = I +I . In our model, I represents the excitatory innervations to the transmission GABAergic IN. The dynamic equations for the canonical neuronal mass, which summarize distinct properties in the neuronal signaling, are deduced by applying simple electronic rules.
Membrane potentials
A model of multiple compartments is introduced (see Appendix A for details) to explain the linear spatiotemporal integration at the dendro‐somatic scale for both the layer V PC and the GABAergic INs. The system of Eqs. 1 and 2 summarize the dynamics of the membrane potentials and other intrinsic electrical states in the excitatory and inhibitory neuronal subpopulations:
GABAergic INs
| (1a) |
| (1b) |
Layer V PC
 |
(2a) |
 |
(2b) |
| (2c) |
| (2d) |
Instantaneously, each of the inhibitory synaptic currents contributing to the delayed I − (t − τIN) at the layer V PC soma has a nonlinear dependency with the membrane potentials V of the presynaptic GABAergic INs I = α IN f IN(V ), with l = {T,F} symbolizing the transmission or feedback innervations type. Besides providing inhibition to the layer V PCs, the GABAergic INs also receive excitatory inputs. In the same way as for layer V PCs, the electrotonic reflections at the GABAergic INs soma of the excitatory synaptic currents serve to regulate the dynamic of the membrane potential of this type of neuron. In our model, the synaptic input I and the delayed‐excitatory synaptic current I + (t−τPC) target the transmission and feedback GABAergic INs, respectively. Instantaneously, I + = αPC f PC(V PC) is proportional to the membrane potentials V PC at the layer V PC soma.
For all types of neurons, it is assumed that spikes are not initiated at the dendrite level. Instead, they can be generated in the hillock and initial segment of the axon, an area endowed with a large number of sodium channels substantially reducing the global threshold of excitability [Mainen et al.,1995]. The functions f IN and f PC are introduced to describe the dependency of the membrane potential at the soma in both types of neurons with the size of the postsynaptic effect they induce. Four different phenomena are modeled by these nonlinear functions: the fast dynamics of the Hodgkin‐Huxley subsystem due to voltage‐dependent variations in the intrinsic ionic currents I i (which vary depending on the type of neuron, see Figs. A1 and A2 in Appendix A), the highpass linear filter predictable from the particular characteristics of the propagation of spikes along the axon, the lowpass filter describing the diffusion of neurotransmitters in the synaptic cleft, and the mechanisms of chemically dependent channels at the postsynaptic neurons. However, this function is normalized; hence, the constants αk k = {PC,IN} are introduced to account for scaling factors in the postsynaptic effects produced by these two types of neurons.
In this study the generalized logistic (or Richard's) curve is used to model the voltage–ampere relationship, which characterizes the nonlinear phase. This curve is defined by the lower asymptote A l, the upper asymptote A u, the membrane potential of maximum growth V , the growth rate γ k, and the membrane potential value near which asymptote maximum growth occurs T:
| (3) |
For biophysical reasons, we fixed A l = 0, A u = 1, and T = 0.03.
Extracellular electric current
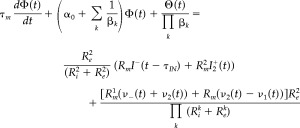
Large layer V PCs have a peculiar spatial geometry that facilitates the production of an undersized electric current in their extracellular surroundings (i.e., the neuropil). In our model, this electric current (i.e., i 2) is that which flows through the longitudinal resistance R of the extracellular medium along the apical stem of the layer V PCs (i.e., equivalent electric circuit; Fig. A1, left). It can be shown that i 2(t) = Φ(t)/R (see Appendix B), with the electric potential Φ satisfying the differential equations:
 |
(4a) |
| (4b) |
Mostly layer V PCs are arranged in parallel and perpendicularly oriented to the surface of the cortex; hence, this electric current represents a mesoscopic effect resulting from their spatial average within a cortical unit (Fig. 2).
Figure 2.
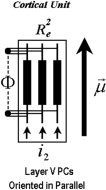
Neuronal representation of the PCD. More than a few of the layer V PCs are thought to be oriented in parallel and perpendicular to the surface of the cortex within a cortical unit (i.e., the orientation μ→). The large‐scale extracellular electric current i 2 flows through the neuropil existing between the apical trunks of these neurons (with longitudinal resistance R ).
Extended Balloon Approach
It is also postulated that the capillary bed and postcapillary venules are arranged in the cortical sheet in a way that correlates very well with its columnar organization [Harrison et al.,2002]. This hypothesis permits us to combine the modified balloon approach and the canonical neuronal mass by introducing some coupling mechanisms between the electrical and vascular states locally limited to each single cortical unit.
In this extended balloon approach, a set of four ordinary differential equations (Eq. 5) governs the dynamics of the flow‐inducing signal, the CBF, the cerebral blood volume (CBV), and the concentration of dHb. The whole dynamic system is driven by the input u(t), which has been delayed and dc‐shifted:
| (5a) |
| (5b) |
| (5c) |
| (5d) |
The delay τh is introduced to account for a retarded response of the vasculature and the dc u 0 explains the basic energy demand during resting condition.
Electrovascular Coupling
It is also hypothesized that instantaneously the input u(t) is proportional to a lowpass‐filtered version of the total concentration of NO (i.e., C NO) in the cortical unit (Eq. 6). Mechanisms associated with NO synthetase are in the neurons (i.e., dendrite and/or soma) and also in the endothelial cells. After transient stimulation, the energy required to re‐establish the transmembrane ionic gradients in the neurons and also that used to reuptake neurotransmitters from the synaptic cleft could trigger the synthesis of NO. The transmembrane capacitive current summarizes three different ionic flows that change these gradients: the purely synaptic currents (neurotransmitter‐receptor gated ionic channels), the intrinsic electrophysiological currents (voltage‐gated ionic channels, e.g., sodium, potassium, calcium, etc.) and the flow of ions through the membrane by means of passive channels (leakage currents). Hence, transmembrane capacitive currents also indirectly contain information about the concentration of the released neurotransmitters. We propose that the synthesis of NO can be explained by a nonlinear function of the transmembrane capacitive currents in the whole cell surface. However, for simplicity, in this work we have included only those contributions coming from the somatic surface. These nonlinear functions are required to be symmetric around zero (to take account of both inward and outward ionic currents) and they should also include an NO saturation effect.
The nonlinear functions g k(x) = ρk(1 − exp(−x 2/ωk)), with positive constants ρk, and ωk (k = {PC, IN}), have the above‐referred properties and were proposed in Riera et al. [2005] to match synaptic activity with the flow‐inducing signal. This proposal is in agreement with recent results found by Wan et al. (2006), who demonstrate from concurrent EEG and fMRI recordings that the power of the PCD in the visual cortex of humans correlates linearly with the estimated value of the synaptic efficacy in the modified balloon approach. The constants ρ k represent scaling factors, which would allow us to deal with the dissimilarities in the physical dimensions between the EEG and fMRI data. The constants ωk, instead, could be mainly associated with the susceptibility of the vasculature to variations in the transmembrane capacitive currents in each neuron:
| (6) |
| (7) |
The magnitudes I and I represent the total transmembrane capacitive currents at the somas of the three neurons:
The constants C and C m are the effective membrane capacitances in the somas of these neurons. Note that constants ωk could absorb the scaling factors resulting from these capacitances. The energetic factors χIN and χPC are introduced in order to make a distinction between the relative metabolic demand in neurons of different types. The function ψ describes a lowpass filter originated due to the diffusion phenomenon of NO within the cortical unit as well as its reaction with scavenges (e.g., the free hemoglobin). Also, it imitates a much‐required downsampling because of the slow temporal scale of the BOLD signals. In Riera et al. [2005], the function ψ comprises a Kaiser class filter with windows parameter α < 1 and a boxcar of around 3 s in length. In this article, we propose a lowpass filter defined by the impulse response function in the Laplace domain ψ(s) = Aω/(s 2 + 2δω0 s + ω) with gain A, angular high cut frequency ω0, and damping factor δ. Hence, the linear convolution (Eq. 6) transforms into a dynamic equation system (Eq. 8):
| (8a) |
| (8b) |
A description of the model's parameters as well as a table with the dimension and physiological range are provided in Appendix C.
Observation Equations
The LEVC model is represented by a set of stochastic differential equations (SDE) describing the dynamics of the states vector x→ (Eq. 9). The SDE system is defined by the ordinary differential Eqs. 1, 2, 4, 5, and 8 plus a multidimensional Wiener process, which acts as stochastic external forces with different strengths (or variances) g i (i.e., G = diag(g i)) perturbing the dynamics of the states:
| (9) |
The vector of states, x→ = {V , V PC, Ω, ν1,2, ν−, Φ, Θ, r, u, s, f, ν, q}, is related to the measurements by the discrete observation equations. In EEG and fMRI experiments, the data are composed of voltage differences in a set of lead electrodes positioned on the scalp and the BOLD signals at the mesh of voxels inside the head. However, in this study the electrical and vascular states are directly related to the mesostates α t (fast dynamics) and β t (slow dynamics) defined in terms of certain areas of interest [Riera et al.,2005]. The PCD is assumed to depend linearly on the mesostates α(t) (i.e., J→(t) = α(t)μ→). The orientation of the PCD μ→, which is a normalized vector, does not depend on time, and it is defined by the cortical curvature, ensuring that it is always perpendicular to the surface of the cortex. The mesostates β t correspond with averaged BOLD signal within the region of interest after being corrected by its potential drift in each voxel. The discrete observation equations in our model are defined by:
| (10a) |
| (10b) |
In general, the errors at the mesoscopic level for both measurements are assumed to be i.i.d. e k ∼ N(0, σ) with k = {α, β}. In the case of the fast dynamic process, its associated error e may implicitly explain variations in the orientation of the layer V PCs within the cortical unit. The spatial heterogeneity of the BOLD signals within a region of interest may be the source of the error e .
EEG case
The temporal variations of the mesostates α(t) are well approximated by the extracellular electric current i 2(t) along the layer V PC apical trunk time an electrical gain factor χ (see Fig. 2; henceforth, for simplicity it is assumed χ = 1). The GABAergic INs more often than not have spherical symmetry, yielding an external electric field that decreases rapidly in the radial direction [Niedermeyer and Lopes da Silva,1999]. Therefore, the EEG observation function is:
| (11a) |
fMRI case
The CBV and the concentration of dHb are directly related to the mesostates β(t) by the nonlinear fMRI observation function [Buxton et al.,1998]:
| (11b) |
The factors k 1, k 2, and k 3 are dimensionless and correspond to how the (extra/intra) vascular systems and the changing balance effect contribute to the BOLD effect, respectively. Their values depend on the characteristic of the fMRI recording system. In the particular case of a 1.5 T scanner with a TE of around 40 ms, these factors can be evaluated empirically by the expressions: k 1 ≅ 7E 0, k 2 ≅ 2 and k 3 ≅ 2E 0 − 0.2 [Boxerman et al.,1995; Ogawa et al.,1993]. The resting blood volume fraction is set up as in previous studies V0 = 0.02.
A schematic representation of the whole LEVC model is shown in Figure 3 and the electrical and vascular states are summarized in Table I.
Figure 3.
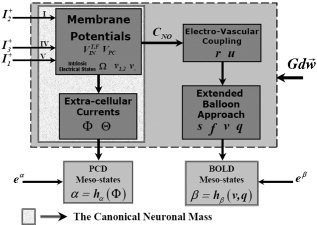
A schematic representation of the whole LEVC model. The cortical unit, represented by a large gray box (limited by dashed line), comprises the canonical neuronal mass, a mechanism for electrovascular coupling and the extended balloon approach. The canonical neuronal mass encloses two subsystems, one describing the membrane potentials (and other implicit electrical states) in the three neurons and another associated with the electric currents flowing along the neuropil between the apical trunks of layer V PCs. A multidimensional Wiener process G dw→ additively perturbs the dynamics of electrical and vascular states in the LEVC model. The LEVC model describes the dynamics of mesostates through two observation equations, which also include measurement errors at a mesoscopic level.
Table I.
Summary of the electrical and vascular states: physical meaning and symbol
| Electrical and vascular states | Symbol | |
|---|---|---|
| Membrane potential at the soma of GABAergic IN (Transmission) |
V
|
|
| Membrane potential at the soma of GABAergic IN (Feedback) |
V
|
|
| Membrane potential at the soma of layer V PC | V PC | |
| Voltage difference (meaningless) (i.e., voltage divisor effect) | Ω | |
| Equivalent voltage source at the layer V PC basal dendrites | ν1 | |
| Equivalent voltage source at the layer V PC apical tuft dendrites | ν2 | |
| Equivalent voltage source at the soma of layer V PC | ν− | |
| Extracellular voltage difference along the layer V PC apical trunk | Φ | |
| Voltage difference (meaningless) (i.e., voltage divisor effect) | Θ | |
| Time derivative of the input (extended balloon approach) | r | |
| Input (extended balloon approach) | u | |
| Flow‐inducing signal | s | |
| CBF | f | |
| CBV | ν | |
| Concentration of dHb | q |
IN, interneurons; CBF, cerebral blood flow; CBV, cerebral blood volume; dHb, deoxyhemoglobin.
SIMULATION STUDY
In this section, the performance of the LEVC model is evaluated in terms of simulated data. For this purpose, a single “quasi‐instantaneous” event at the synaptic inputs is modeled by a Gaussian function of 15.6 ms in width (Fig. 4, top). This function was decided on based on the population dynamics of neuronal spikes observed in the afferent pathways by means of multiunitary recordings. The stimulus used in this simulation is defined as a series of single events during the time window of 2 to 6 s. We analyze the dynamics of electrical/vascular states and mesostates in a cortical unit for different frequency of appearance and amplitudes of these single events. This simulation can be thought of as visually evoked responses under different flickering frequencies and luminous contrasts.
Figure 4.
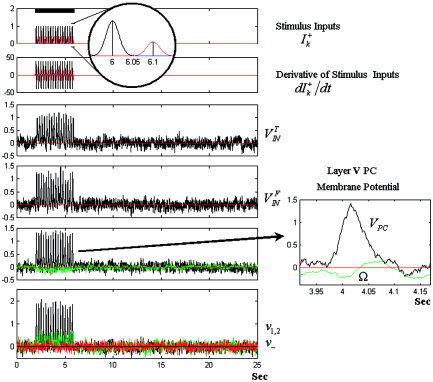
The integration of the SDE. The synaptic inputs and their derivatives are shown in the upper panel. A single realization of the electrical states V , V PC, Ω, ν1,2, ν− are shown in the panels below. The plot for the membrane potential at V PC the soma of the layer V PC and the implicit electrical state Ω corresponding to a single event is highlighted on the right. For visualization, Ω was rescaled by a factor of 0.15. The black bar represents the stimulation window. The membrane potentials and intrinsic electrical states are given in mV.
The neuronal (τIN, τPC) and vascular τh delays were set to zero in the simulations considering the small extension of a cortical unit and also due to mathematical difficulties that emerge while trying to integrate an SDE system with delays. The inhibitory GABAergic synapses on layer V PCs in a cortical unit are denser than the excitatory synapses in contact with feedback GABAergic INs. Also, the inhibitory neurons (i.e., fast spiking) respond to a depolarizing pulse with a higher frequency than glutamatergic neurons [Contreras and Palmer,2003]; hence, we assumed that excitatory αPC and inhibitory αIN synaptic factors are comparable (see values in Appendix C). In this simulation, the synaptic input I (red; Fig. 4, top) to the transmission GABAergic INs was delayed by 100 ms with respect to the latency of synaptic input at the basal compartment of the layer V PC I (black, Fig. 4, top). However, we believe the latencies of the synaptic inputs will not affect the results presented henceforth. In Part II of these two companion articles we will use actual latencies for the synaptic inputs in the striate cortex of humans. Any kind of cortico‐cortical interaction was neglected; hence, a random white noise was introduced at the apical tuft compartment I of the layer V PC. The vector x→0 defines the initial values of the states (see Table II). The variances of the Wiener processes g i are assumed to be different and they are summarized in Table II. The magnitude u 0 corresponds to the resting energy demand and depends on the variances of the Wiener processes. For the variances used in this simulation, u 0 = 0.1. The standard deviations for the mesostates with fast and slow dynamics were σα = 0.223 and σβ = 0.00316, respectively. The SDEs (Eq. 9) were integrated by using the local linearization method. The full practice and theory of this method can be found in Jimenez et al. [1999], Jimenez and Biscay [2002], and Jimenez [2002]. In Riera et al. [2004a], this method was used to integrate the modified balloon approach.
Table II.
Initial values of the states and the variances of the Wiener processes
|
V
|
V
|
V PC | Ω | ν1,2 | ν− | Φ | Θ | r | u | s | f | ν | q | |||
|---|---|---|---|---|---|---|---|---|---|---|---|---|---|---|---|---|
|
x
|
0 | 0 | 0 | 0 | 0 | 0 | 0 | 0 | 0 | u 0 | 0 | 1 | 1 | 1 | ||
| g i ∼ | 1 | 1 | 1 | 1 | 1 | 1 | 3 | 3 | 0 | 0 | 0.03 | 0.03 | 0.03 | 0.03 |
Simulation 1: Consequences of Including Stochastic Driven Forces
A set of 20 single trials was generated with single events occurring at 4.0 Hz. The states corresponding to a single realization of the SDE, the synaptic inputs I and their temporal derivative dI / dt are shown in Figure 4. The amplitudes of synaptic inputs for the transmission GABAergic IN and basal compartment in the layer V PC were 0.4 pA and 1.0 pA, respectively (see Fig. 4, upper panel). The values of the membrane potentials and other intrinsic electrical states are given in mV.
Note the fact that membrane potentials in the three neurons fluctuate most of the time around the resting membrane potential (in this model set to zero), which represents the equilibrium state of the system (as illustrated in Fig. 5). However, during stimulations the membrane potentials reach large values for all neurons; hence, there is a substantial increase in the probability that they generate postsynaptic currents. The voltage–ampere relationships (top) and the histograms of the membrane potentials (bottom, in a logarithmic scale) for each neuron are plotted in Figure 5.
Figure 5.
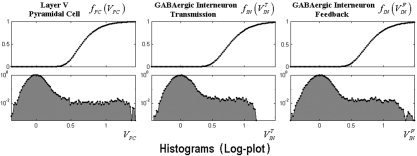
Top: represents the voltage‐ampere relationships for each neuron. Bottom: the histograms of the membrane potentials (logarithmic scale) obtained from a single realization. These histograms were obtained from dividing the voltages range within which these membrane potentials vary (i.e., 0.5–1.5 mV) in small intervals. The values of the histogram were calculated by evaluating how many times the membrane potential reach a value within a particular interval.
Figure 6 shows the nonlinear function g k(·) (top) and the histograms of the transmembrane capacitive currents (bottom, in a logarithmic scale) for each neuron.
Figure 6.
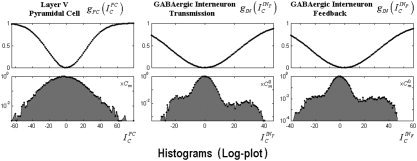
Top: the neuron‐type dependent nonlinear function g k(·). Bottom: the histograms of the transmembrane capacitive currents for each neuron (logarithmic scale) obtained from the same single realization used in Fig. 5. These histograms were calculated in a similar way as described in Figure 5 for the membrane potentials, but in this case the small intervals were defined in the variations range of the transmembrane capacitive currents.
The temporal dynamics of C NO (given in nM) in the cortical unit seems to be highly contaminated with noise emanating from the electrophysiological level (Fig. 7, upper panel). However, in spite of the random appearance of C NO, the input to the vasculature u(t) (a lowpass‐filtered version of C NO) shows a clear correlation with the stimulus windows. The dynamics of other vascular states (flow‐inducing signal, CBF, CBV, concentration of dHb) are shown in Figure 7 (lower).
Figure 7.
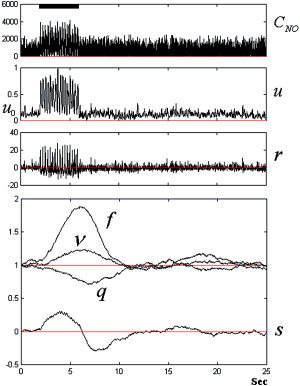
The integration of the SDE. A single realization showing the temporal dynamics of the concentration of NO C NO (in nM) in the cortical unit (upper panel). The panels below show a realization of the input to the extended balloon approach u and its derivative r = du/dt. Also, single realizations of the flow‐inducing signal s, the CBF f, the CBV v, and the concentration of dHb q are shown in the last panel. The black bar represents the stimulation window.
The respective dynamics for the states corresponding to the extracellular electric currents are shown in Figure 8. Due to the fact that a considerable number of cortical layer V PCs are required to be oriented in parallel to produce a sizeable extracellular electrical current within the cortical unit, large variances were used to simulate the Wiener processes in these electrical states. This assumption implies that even when the dynamics of the membrane potentials are not much contaminated by population and diffusion random effects, their reflections in the neuropil show remarkable stochastic fluctuations.
Figure 8.
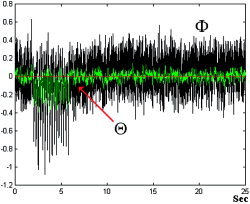
The integration of the SDE. A realization of the electrical states Φ and Θ. For visualization, the electrical state Θ was rescaled by a factor of 0.04.
The observation equations (Eq. 10) were used to generate the mesostates. In Figure 9 the mesostates are plotted for a single trial (left) and the average of 20 trials (right). These mesostates show very similar aspects to those obtained from actual EEG and fMRI data [Riera et al.,2005].
Figure 9.
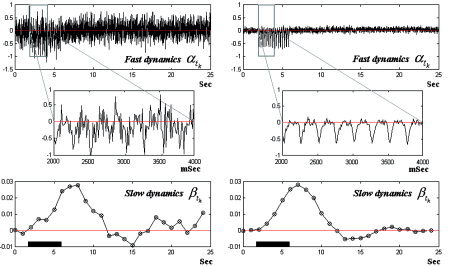
The mesostates associated with the PCD and BOLD signal. A single trial is plotted on the left, and the average of 20 trials is plotted on the right.
Simulation 2: Dose–Response Curves (Flickering Frequency and Luminous Contrast)
In this simulation the effects of changing the frequency of appearance and the amplitude of the single events were examined. In both cases a set of 20 trials was used to obtain the final event‐related response of PCD and BOLD types.
In the first case, different flickering frequencies (0.5, 1.0, 2.0, 4.0, 8.0, 16.0 Hz) were used to generate the series of single events for both synaptic inputs, the basal dendrites I (amplitude 1.0 pA), and the delayed version at the transmission GABAergic IN I (amplitude 0.4 pA). The amplitudes of the PCD and BOLD mesostates increase until the flickering frequency reaches the critical value of 8.0 Hz; afterward, these amplitudes decrease considerably (Fig. 10, top). This result is in agreement with experimental findings using animals [Hewson‐Stoate et al.,2005; Sheth et al.,2004] and humans [Singh et al.,2003].
Figure 10.
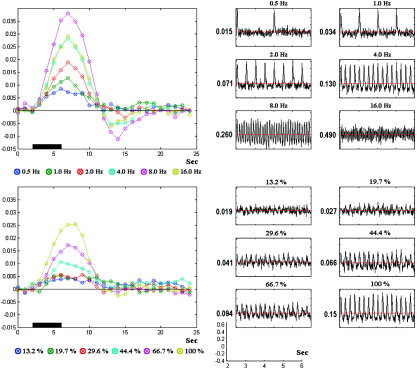
Comparisons of mesostates BOLD (left) and PCD (right) for variations in the frequency of appearance (top) and amplitudes (bottom) of the single events. The PCD and BOLD signal were obtained after averaging 20 trials.
In the second case, the flickering frequency was fixed at 4.0 Hz, but the luminous contrasts (amplitudes in both I and I ) were varied as 13.2%, 19.7%, 29.6%, 44.4%, 66.7%, and 100%. Note that these luminous contrasts are just relative values used in the simulations and, as a result, they do not represent the real percentage of luminance. The 100% luminous contrast is reached when I = 1.0 pA and I = 0.4 pA. It was found that the amplitudes of the PCD and BOLD mesostates increase with the level of luminous contrast. The results (Fig. 10, bottom) are also comparable with those reported previously using experimental data [Devor et al.,2003; Galia et al.,2002; Hewson‐Stoate et al.,2005; Jones et al.,2004; Logothetis et al,2001; Sheth et al.,2004; Zaletel et al.,2004].
We studied different electrical indexes to gather the NO release within the cortical unit (e.g., membrane potentials, synaptic currents, transmembrane capacitive currents). All of them failed to replicate the nonlinear (flickering frequency) and linear (luminous contrast) dose–response curves with the exception of that proposed here (i.e., the transmembrane capacitive current). Our explanation for this fact is: When an RC circuit is stimulated with a periodic current source, the voltage and also its derivative (i.e., the capacitive current) will oscillate. The frequency of these oscillations will increase proportionally with the frequency of stimulation. However, there exist a critical frequency in the stimulus from which the voltage will start showing a saturation phenomenon; hence, the amplitude of the oscillations in the capacitive current will start decreasing. This is due to the fact that a capacitor needs a time constant to be fully discharged. Therefore, the critical frequency depends on the values of the resistances and capacitors used in the RC circuit.
Furthermore, the significant dc level that appears in the PCD signals for both cases (Fig. 10) is strongly dependent on the stimuli characteristics and it correlates, somehow, with the CBF [Vanhatalo et al.,2003].
DISCUSSION
In this work the LEVC model has been proposed to characterize the neuronal activity and the hemodynamics of the brain within a common biophysical framework. The model describes the dynamics of physiological states as well as their interactions. An additional multidimensional Wiener process has been incorporated to represent stochastic forces driving these dynamics, thus providing a common cause for the correlated noise observed in the EEG and fMRI signals. This is of great significance when analyzing multimodal data recorded concurrently. The model gives explanations for several experimental findings: (1) the dose–response curves for the neuronal electrical activity and vascular/metabolic signals obtained in both animals and humans; and (2) the correlation found between dc‐EEG variations and CBF.
The novelties and advantages of the model are listed below.
-
I
The electrical and morphological properties of single neurons constituting a basic micronetwork of the neocortex were considered in order to obtain a forward/generative model of the EEG dynamics.
-
II
Based on simulations performed in our group (not shown in the present study), it is suggested that the trigger for vascular changes may not be the membrane potentials or the synaptic currents but the transmembrane capacitive currents (which somehow includes synaptic activity). A nonlinear mechanism of coupling between the electrical and the vascular states was proposed.
-
III
The energetic components supplied to the neurons for excitatory and inhibitory synaptic activation within the overall glucose budget can be discriminated after identifying the LEVC model from concurrent EEG and fMRI recordings.
-
IV
The implications of the present work in the analysis of effective connectivity are 2‐fold: (i) connections with a cortical unit can be of three types (e.g., I1, I2, and I3); and (ii) the fMRI and EEG data must be combined to correctly identify interactions between cortical regions. In the light of recent work [David et al.,2004; Deco et al.,2004; Friston et al.,2003; Husain et al.,2004; Tagamets and Horwitz,1998], the analysis of competitions and cooperations between different cortical units should be done on the basis of forward/generative models.
However, the proposed model has several limitations that constitute aims for future research in our group.
-
1
The incorporation of temporal delays between neurons of the basic micronetwork could slightly affect some of the results presented in this article. Unfortunately, the theory for the numerical integration of SDE with delays is still under construction.
-
2
In order to include inhibitory and diffuse granular bands existing within a cortical unit, the Fokker‐Planck equations [Knight,2000; Nykamp and Tranchina,2000] must be obtained for the canonical neuronal mass model. The population dynamics approaching equilibrium of the membrane potentials of GABAergic INs defining these bands must be properly considered.
-
3
The neocortex is modeled in this study on a basic micronetwork. The wiring diagram within a cortical unit can be extended to include, for example, different types of PCs and also different inhibitory and excitatory INs (i.e., double bouquet cells, basket cells, spiny and aspiny stellate cells, etc.) [Tamas et al.,1998; Traub et al.,2005]. In addition, the electrotonic model of the layer V PCs can be generalized to include also a compartment for the apical oblique dendrites trees.
-
4
The voltage–ampere relationship in the nonlinear phase was modeled in this work by a generalized logistic curve, which does not take account of spikes adaptation. This function was inspired in the platonic model of neurons (Na‐K spikes). However, the cortical neurons in mammalians have in fact ionic currents of different types (i.e., calcium T‐type, K calcium‐dependent, hyperpolarization, persistent Na, fast K A‐type, etc.). In the future, the authors are considering whether or not general functions that describe complex spike dynamics might be more suitable. Also, these functions must be generalized to depend on the type of postsynaptic neurons as well.
-
5
The spikes can be also generated at the dendrites and they can propagate forward and backward along the dendrite tree, a phenomenon that was not taken into consideration in our model [Poznanski,2002].
Acknowledgements
The authors thank Tohru Ozaki (Institute of Statistical Mathematics, Tokyo) for stimulating discussions during the preparation of this work. We also thank Lee Harrison (Functional Imaging Laboratory, UCL) for revising the article.
APPENDIX A.
Multicompartment Models for Layer V PCs and GABAergic INs
Two GABAergic INs interconnected with a layer V PC constitute the proposed canonical neuronal mass model. As a consequence of the particular geometry of the layer V PC and the characteristics of the connections with GABAergic INs, this basic microcircuit represents a system of multiple inputs with heterogeneous impedances and a single output. In this appendix, the equations for the electrotonic propagation in both types of neurons are deduced.
Layer V PC
The soma and the dendrite trees take part in the spatiotemporal integration of postsynaptic potentials in the layer V PCs (Fig. A1, left). The dendrites can be classified as either basal or apical according to where the main stems of their trees connect to the soma. The basal path is represented by a virtual compartment that summarizes a huge number of synapses arriving at multiple bifurcated branches of the basal dendrites tree and a small stem connecting it with the equivalent somatic compartment. In this model we assumed that the basal stem originates at the site where the basal dendrites tree reaches the maximal number of intersections [Wong et al.,2000]. On the basis of morphological and electrotonic properties, the apical path is classified in three compartments: oblique, tuft, and trunk [Mainen et al.,1995]. However, in this model the contributions of synaptic activity in the oblique and trunk compartments have been neglected (or they have been merged, in the equivalent electrical sense, with the synaptic activity inflowing into the basal [Gil and Amitai,1996] and apical tuft compartments, respectively). Therefore, it is assumed that the apical tuft compartment connects to the soma by a long isolated stem (Fig. A1, middle). However, the inclusion of the oblique compartment is being considered in an article in progress in our group. The final configuration of the two electric compartments with differentiated effective membrane resistances R and capacitances C (k = 1 basal and k = 2 apical tuft) can be interpreted as a parallel circuit (Fig. A1, right). They are connected to the somatic compartment by two stems of different lengths; hence, distinct effective longitudinal resistances should be used. The somatic compartment has a comparable but different effective membrane resistance R m and capacitance C m.
Figure A1.
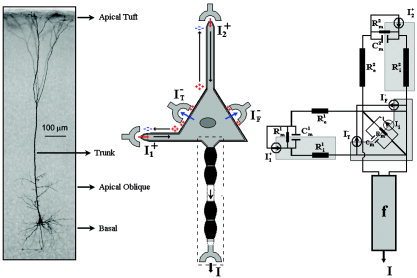
The pyramidal cell. A symbolic representation of the inputs and output (middle). The equivalent electrical circuit (right). On the left, an illustration of the typical layer V PC of rat somato‐sensory cortex, filled with biocytin and stained according to the ABC procedure [adapted from Rauch et al.,2003; used with permission from the American Physiological Society].
GABAergic IN
Conversely, a single somatic compartment, with corresponding effective resistance R and capacitance C , can be used to represent electrotonic spatiotemporal integration in the GABAergic INs (Fig. A2, middle). In this particular circumstance the space collapses, since this type of neuron holds an isotropic distribution of the synapse clouds with a radial symmetry around the soma (Fig. A2, left). The equivalent electric circuit is presented in Figure A2 (right).
Figure A2.
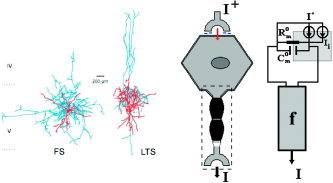
The GABAergic interneuron. A symbolic representation of the inputs and output (middle). The equivalent electrical circuit (right). On the left, biocytin‐filled and reconstructed FS (fast‐spiking) and LTS (low threshold‐spiking) GABAergic INs in the neocortical layer V of rodents [adapted from Bacci et al.,2003, © 2003 by the Society for Neuroscience]. The axons are in blue and the dendrites are in red.
Equivalent circuits
A resistance R, a capacitor C, and a current source in parallel I, represented in Figure A3 (left), constitute the common basic element to account for the electrical processes taking place in a unitary area of the membrane for both neuronal circuits. In the frequency domain, a comparable resistance R* = (R/(iωτm + 1)), with τm = RC symbolizing a membrane time contact, models the effect of resistive and capacitive components connected in parallel (Fig. A3, middle). Finally, with the use of the Norton‐Thévenin theorem (Fig. A3, right) for a one‐port network, the current source in parallel with a resistance can be represented by a voltage source in series with the resistance [Rizzoni,2003].
Figure A3.

The schematic representations of the conversion to the frequency domain and of the Norton‐Thévenin theorem for a one‐port network.
In general, the time variations of voltage source ν is determined by the differential equation:
| (I1) |
The equivalent circuits for both layer V PCs and GABAergic INs are schematically represented in Figure A4.
Figure A4.
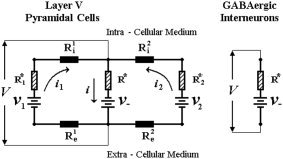
The equivalent circuits for both the layer V PC and the GABAergic INs.
The membrane potentials at the somatic compartment for both types of neurons are represented by magnitude V, which satisfies the following mesh equation:
| (I2) |
The sign of magnitude ν− in Eq. I2 depends on the type of neurons (−ν− and +ν− stand for layer V PCs and GABAergic INs, respectively). The crucial problem, henceforth, is the determination for both cases of the effective current i through the membrane of the soma. In the particular case of GABAergic INs, this current is by definition equal to zero because of the classical electric equivalence of the membrane potential for one‐compartmental neurons. For that reason, the output V IN of the GABAergic INs is described by Eq. (I3):
| (I3) |
In the case of neurons with a multiple compartmental arrangement, as for layer V PCs, to determine the effective current i the Kirchoff equations must be formulated for the equivalent circuit presented above (Fig. A4, left):
| (I4a) |
| (I4b) |
The solution of the Eq. system I4 for the effective current i is:
 |
(I5) |
Therefore, by plugging Eq. I5 into Eq. I2, and after other mathematical manipulations, the generalized equations for the membrane potential at the soma of the layer V PC can be obtained:
 |
(I6a) |
| (I6b) |
The voltage sources (i.e., ν1, ν2 and ν−) for each branch will satisfy Eq. I1 with regard to the particular current inputs and resistance (i.e., I , R ∀k={1,2} and I = I − − I i, R m) for each case, respectively. The coefficients βk = (R + R )/R play the role of equivalent voltage divisors for each path in the circuit. The coefficient α0 = 1 + R m ∑k (R + R )−1 mixes the contributions coming from both basal and apical paths.
Note that for the particular case of isolated compartments (for each k, (R + R ) ≫ R ⇒ βk ≈ ∞ and ∑k (R + R )−1 ≫ R m ⇒ α0 ≈ 1), Eq. I6 simplifies to the classical equation for one‐compartmental neurons τm(dV PC/dt) + V PC + R m I = 0.
APPENDIX B.
Extracellular Electric Currents along the Layer V PC Apical Trunk
From the Kirchoff equations (Appendix A, Eq. I4), it can be proven that the effective currents i 1 and i 2 satisfy the following equations:
| (IIa) |
| (IIb) |
Regarding i 2 = Φ/R , the final equations (4a and 4b) for the electric potential Φ and the implicit electrical state Θ can be obtained from (IIb) after some simple calculations.
APPENDIX c.
Model Parameters (Dimensions and Physiological Ranges)
The whole membrane area of a compartment is taken into consideration when calculating its effective membrane resistance R m = (r m/A) and capacitance C m = (c m A). For the particular case of the layer V PC, the effective intra/extracellular resistance along the dendrites stem (basal and apical) is calculated from R i = (r i l/S) and R e = 1.2R i [Kleber and Riegger,1987], respectively.
Table I.
| Symbol | Physiological parameters | Dimension | Value | |
|---|---|---|---|---|
| Geometrical | ||||
| (Mason and Larkman,1990; Kawaguchi,1993; Mainen et al.,1995; Larkman and Mason,1990; Wong et al.,2000) | ||||
| A IN | Area of Soma (GABAergic IN) | cm 2 | ∼0.908 × 10⁻⁵ | |
| A PC | Area of Soma (layer V PC) | cm 2 | 1.393 × 10⁻⁵ | |
|
A
|
Area of Basal (layer V PC) | cm 2 | ∼18 × 10−5 | |
|
A
|
Area of Apical Tuft (layer V PC) | cm 2 | ∼6 × 10⁻⁵ | |
| l BS | Basal Stem Length “Maximal Number of Intersections” | cm | 0.6 × 10⁻² | |
| l AS | Apical Stem Length | cm | ∼6 × 10⁻² | |
| S PC | Mean Dendrite Transversal Area | cm 2 | ∼0.44 × 10⁻⁸ | |
| Electrophysiological | ||||
| (Major et al.,1994; Spruston et al.,1994; Kleber and Riegger,1987) | ||||
| c m | Membrane Capacitance | μF/cm 2 | 0.75 | |
| r m | Membrane Resistance | Ω cm 2 | 40000 | |
| τm = c m r m | Membrane Time Constant | ms | 30 | |
| r i | Intra‐cellular Axial Resistance | Ω cm | 166 | |
| αPC | Layer V PC Synaptic Factor | pA (0 ∼ 1.5) | 0.4 | |
| αIN | GABAergic IN Synaptic Factor | pA (0 ∼ 1.5) | 0.3 | |
| r e | Extra‐cellular Resistance | Ω cm | 63 | |
| Vascular | ||||
| (Friston et al.,2000) | ||||
| χPC | Layer V PC Energetic Factor | nM (0 ∼ 1) | 1.0 | |
| χIN | GABAergic IN Energetic Factor | nM (0 ∼ 1) | 0.8 | |
| τs | Signal Decay | ms | 1540 | |
| τf | Autoregulation | ms | 2460 | |
| τ0 | Transit Time | ms | 980 | |
| α | Stiffness | Dimensionless | 0.33 | |
| E 0 | Resting Oxygen Extraction Fraction | Dimensionless | 0.34 | |
Table II.
| Neuron | Effective membrane resistance | Symbol | Value | |
|---|---|---|---|---|
| GABAergic IN | Soma Compartment |
R
|
4.082 | |
| Layer V PC | Soma Compartment | R m | 2.871 | |
| Basal Compartment |
R
|
0.222 | ||
| Apical Tuft Compartment |
R
|
0.667 | ||
| Basal Longitudinal (Intracellular) |
R
|
0.226 | ||
| Basal Longitudinal (Extracellular) |
R
|
0.272 | ||
| Apical Longitudinal (Intracellular) |
R
|
2.264 | ||
| Apical Longitudinal (Extracellular) |
R
|
2.716 |
The dimensions of the effective resistances are in GΩ.
Table III.
| Basal Voltage Divisor | β1 | 2.24 |
| Apical Voltage Divisor | β2 | 7.45 |
| Mixed Coefficient | α0 | 7.32 |
Table IV.
Parameters used to evaluate the voltage‐ampere relationships
| Neuron | γk (mV −1) | V (mV) |
|---|---|---|
| Layer V PC | γPC = 6 | V = 0.6 |
| GABAergic IN | γIN = 5 | V = 0.7 |
Table V.
Parameters used to evaluate the nonlinear functions g k (·)
| Neuron | ρk | ωk (nA)2 |
|---|---|---|
| Layer V PC | ρPC = 1 | ωPC = 0. 1091 |
| GABAergic IN | ρIN = 1 | ωIN = 0. 0464 |
Table VI.
Parameters of the low‐pass filter ψ(s)
| Gain | A | 1.0 nM−1 |
| Damping factor | δ | 0.8 |
| Angular high cut frequency | ω0 | 2π (8 Hz) |
REFERENCES
- Almeida R, Stetter M (2002): Modeling the link between functional imaging and neuronal activity: synaptic metabolic demand and spike rates. Neuroimage 17: 1065–1079. [PubMed] [Google Scholar]
- Arbib MA, Bischoff A, Fagg AH, Grafton ST (1995): Synthetic PET: analyzing large‐scale properties of neural networks. Hum Brain Mapp 2: 225–233. [Google Scholar]
- Attwell D, Iadecola C (2002): The neural basis of functional brain imaging signals. Trends Neurosci 25: 621–625. [DOI] [PubMed] [Google Scholar]
- Aubert A, Costalat R (2002): A model of the coupling between brain electrical activity, metabolism, and hemodynamics: application to the interpretation of functional neuroimaging. Neuroimage 17: 1162–1181. [DOI] [PubMed] [Google Scholar]
- Bacci A, Rudolph U, Huguenard JR, Prince DA (2003): Major differences in inhibitory synaptic transmission onto two neocortical interneuron subclasses. J Neurosci 23: 9664–9674. [DOI] [PMC free article] [PubMed] [Google Scholar]
- Bazhenov M, Timofeev I, Steriade M, Sejnowski TJ (1999): Self‐sustained rhythmic activity in the thalamic reticular nucleus mediated by depolarizing GABAA receptor potentials. Nat Neurosci 2: 168–174. [DOI] [PubMed] [Google Scholar]
- Beierlein M, Gibson JR, Connors BW (2000): A network of electrically coupled interneurons drives synchronized inhibition in neocortex. Nat Neurosci 3: 904–910. [DOI] [PubMed] [Google Scholar]
- Boxerman JL, Bandettini PA, Kwong KK, Baker JR, Davis TL, Rosen BR, Weisskoff RM (1995): The intravascular contribution to fMRI signal change: Monte Carlo modeling and diffusion‐weighted studies in vivo. Magn Reson Med 34: 4–10. [DOI] [PubMed] [Google Scholar]
- Breakspear M, Stam CJ (2005): Dynamics of a neural system with a multiscale architecture. Philos Trans R Soc Lond B 360: 1051–1074. [DOI] [PMC free article] [PubMed] [Google Scholar]
- Buxton RB, Wong EC, Frank LR (1998): Dynamics of blood flow and oxygenation changes during brain activation: the balloon model. Magn Reson Med 39: 855–864. [DOI] [PubMed] [Google Scholar]
- Buzsaki G (2002): Theta oscillations in the hippocampus. Neuron 33: 325–340. [DOI] [PubMed] [Google Scholar]
- Caesar K, Gold L, Lauritzen M (2003): Context sensitivity of activity dependent increase in cerebral blood flow. Proc Natl Acad Sci U S A 100: 4239–4244. [DOI] [PMC free article] [PubMed] [Google Scholar]
- Callaway EM (1998): Local circuits in primary visual cortex of the macaque monkey. Annu Rev Neurosci 21: 47–74. [DOI] [PubMed] [Google Scholar]
- Contreras D, Palmer L (2003): Response to contrast of electrophysiologically defined cell classes in primary visual cortex. J Neurosci 23: 6936–6945. [DOI] [PMC free article] [PubMed] [Google Scholar]
- Crick F, Asanuma C (1986): Certain aspects of the anatomy and physiology of the cerebral cortex In: Rumelhart DE, McClelland JL, PDP Research Group, editors. Parallel Distributed Processing: Explorations in the Microstructures of Cognition, vol. 2 Psychological and Biological Models. Cambridge, MA: MIT Press; p 333–371. [Google Scholar]
- David O, Cosmelli D, Friston KJ (2004): Evaluation of different measures of functional connectivity using a neural mass model. Neuroimage 21: 659–673. [DOI] [PubMed] [Google Scholar]
- Deco G, Rolls ET, Horwitz B (2004): “What” and “Where” in visual working memory: a computational neurodynamical perspective for integrating fMRI and single‐neuron data. J Cogn Neurosci 16: 683–701. [DOI] [PubMed] [Google Scholar]
- Devor A, Dunn AK, Andermann ML, Ulbert I, Boas DA, Dale AM (2003): Coupling of total hemoglobin concentration, oxygenation, and neural activity in rat somatosensory cortex. Neuron 39: 353–359. [DOI] [PubMed] [Google Scholar]
- Friston KJ, Mechelli A, Turner R, Price CJ (2000): Nonlinear responses in fMRI: the balloon model, volterra kernels, and other hemodynamics. Neuroimage 12: 466–477. [DOI] [PubMed] [Google Scholar]
- Friston KJ, Harrison L, Penny W (2003): Dynamic causal modeling. Neuroimage 19: 1273–1302. [DOI] [PubMed] [Google Scholar]
- Galia A, Harel M, Hendler T, Ben‐Bashat D, Zohary E, Malach R (2002): Contrast sensitivity in human visual areas and its relationship to object recognition. J Neurophysiol 87: 3102–3116. [DOI] [PubMed] [Google Scholar]
- Gazzaniga MS (2000): The New Cognitive Neurosciences, 2nd ed. Cambridge, MA: MIT Press. [Google Scholar]
- Gil Z, Amitai Y (1996): Properties of convergent thalamocortical and intracortical synaptic potentials in single neurons of neocortex. J Neurosci 16: 6567–6578. [DOI] [PMC free article] [PubMed] [Google Scholar]
- Goldman RI, Stern JM, Engel J Jr, Cohen MS (2000): Acquiring simultaneous EEG and functional MRI. Clin Neurophysiol 111: 1974–1980. [DOI] [PubMed] [Google Scholar]
- Goldman RI, Stern JM, Engel J Jr, Cohen MS (2002): Simultaneous EEG and fMRI of the alpha rhythm. Neuroreport 13: 2487–3492. [DOI] [PMC free article] [PubMed] [Google Scholar]
- Harrison RV, Harel N, Panesar J, Mount RJ (2002): Blood capillary distribution correlates with hemodynamic‐based functional imaging in cerebral cortex. Cereb Cortex 12: 225–233. [DOI] [PubMed] [Google Scholar]
- Hewson‐Stoate N, Jones M, Martindale J, Berwick J, Mayhew J (2005): Further nonlinearities in neurovascular coupling in rodent barrel cortex. Neuroimage 24: 565–574. [DOI] [PubMed] [Google Scholar]
- Horton JC, Adams DL (2005): The cortical column: a structure without a function. Philos Trans R Soc Lond B 360: 837–862. [DOI] [PMC free article] [PubMed] [Google Scholar]
- Husain FT, Tagamets MA, Fromm SJ, Braun AR, Horwitz B (2004): Relating neuronal dynamics for auditory object processing to neuroimaging activity: a computational modeling and an fMRI study. Neuroimage 21: 1701–1720. [DOI] [PubMed] [Google Scholar]
- Jimenez JC (2002): A simple algebraic expression to evaluate the local linearization schemes for stochastic differential equations. Appl Math Lett 15: 775–780. [Google Scholar]
- Jimenez JC, Biscay R (2002): Approximation of continuous time stochastic processes by the local linearization method revisited. Stochast Anal Appl 20: 105–121. [Google Scholar]
- Jimenez JC, Shoji I, Ozaki T (1999): Simulation of stochastic differential equations through the local linearization method. A comparative study. J Stat Phys 94: 587–602. [Google Scholar]
- Jones EG (2000): Microcolumns in the cerebral cortex. Proc Natl Acad Sci U S A 97: 5019–5021. [DOI] [PMC free article] [PubMed] [Google Scholar]
- Jones M, Hewson‐Stoate N, Martindale J, Redgrave P, Mayhew J (2004): Nonlinear coupling of neural activity and CBF in rodent barrel cortex. Neuroimage 22: 956–965. [DOI] [PubMed] [Google Scholar]
- Kasischke KA, Vishwasrao HD, Fisher PJ, Zipfel WR, Webb WW (2004): Neural activity triggers neuronal oxidative metabolism followed by astrocytic glycolysis. Science 305: 99–103. [DOI] [PubMed] [Google Scholar]
- Kawaguchi Y (1993): Physiological, morphological, and histochemical characterization of three classes of interneurons in rat neostriatum. J Neurosci 13: 4908–4923. [DOI] [PMC free article] [PubMed] [Google Scholar]
- Kim DS, Ronen I, Olman C, Kim SG, Ugurbil K, Toth LJ (2004): Spatial relationship between neuronal activity and BOLD functional MRI. Neuroimage 21: 876–885. [DOI] [PubMed] [Google Scholar]
- Kleber AG, Riegger CB (1987): Electrical constants of arterially perfused rabbit papillary muscle. J Physiol 385: 307–324. [DOI] [PMC free article] [PubMed] [Google Scholar]
- Knight BW (2000): Dynamics of encoding in neuronal populations: some general mathematical features. Neural Comput 12: 473–518. [DOI] [PubMed] [Google Scholar]
- Larkman AU, Mason A (1990): Correlations between morphology and electrophysiology of pyramidal neurons in slices of rat visual cortex. I. Establishment of cell classes. J Neurosci 10: 1407–1414. [DOI] [PMC free article] [PubMed] [Google Scholar]
- Leopold DA, Murayama Y, Logothetis NK (2003): Very slow activity fluctuations in monkey visual cortex: implications for functional brain imaging. Cereb Cortex 13: 422–433. [DOI] [PubMed] [Google Scholar]
- Logothetis NK (2003): The underpinnings of the BOLD functional magnetic resonance imaging signal. J Neurosci 15: 3963–3971. [DOI] [PMC free article] [PubMed] [Google Scholar]
- Logothetis NK, Pauls J, Augath M, Trinath T, Oeltermann A (2001): Neurophysiological investigation of the basis of the fMRI signal. Nature 412: 150–157. [DOI] [PubMed] [Google Scholar]
- Lytton WW, Sejnowski TJ (1991): Simulations of cortical pyramidal neurons synchronized by inhibitory interneurons. J Neurophysiol 66: 1059–1079. [DOI] [PubMed] [Google Scholar]
- Magistretti PJ, Pellerin L, Rothman DL, Shulman RG (1999): Energy on demand. Science 283: 496–497. [DOI] [PubMed] [Google Scholar]
- Mainen ZF, Joerges J, Huguenard JR, Sejnowski TJ (1995): A model of spike initiation in neocortical pyramidal neurons. Neuron 15: 1427–1439. [DOI] [PubMed] [Google Scholar]
- Major G, Larkman AU, Jonas P, Sakmann B, Jack JJB (1994): Detailed passive cable models of whole‐cell recorded CA3 pyramidal neurons in rat hippocampal slices. J Neurosci 14: 4613–4638. [DOI] [PMC free article] [PubMed] [Google Scholar]
- Makeig S, Jung T‐P, Sejnowski TJ (2002): Having your voxels and timing them too? In: Sommer Wichert, editors. Exploratory Analysis and Data Modeling in Functional Neuroimaging. Cambridge, MA: MIT Press. [Google Scholar]
- Mandeville JB, Marota JJA, Ayata C, Zaharchuk G, Moskowitz MA, Rosen BR, Weisskoff RM (1999): Evidence of cerebrovascular postarteriole windkessel with delayed compliance. J Cereb Blood Flow Metab 19: 679–689. [DOI] [PubMed] [Google Scholar]
- Markram H, Toledo‐Rodriguez M, Wang Y, Gupta A, Silberberg G, Wu C (2004): Interneurons of the neocortical inhibitory system. Nat Rev Neurosci 5: 793–807. [DOI] [PubMed] [Google Scholar]
- Mason A, Larkman AU (1990): Correlations between morphology and electrophysiology of pyramidal neurons in slices of rat visual cortex. II. Electrophysiology. J Neurosci 10: 1415–1428. [DOI] [PMC free article] [PubMed] [Google Scholar]
- Mel BW, Schiller J (2004): On the fight between excitation and inhibition: location is everything. Sci STKE 250: pe44. [DOI] [PubMed] [Google Scholar]
- Nelson SB (2002): Cortical microcircuits: diverse or canonical? Neuron 36: 19–27. [DOI] [PubMed] [Google Scholar]
- Niedermeyer E, Lopes Da Silva FH (1999): Electroencephalography: Basic Principles, Clinical Applications, and Related Fields, 4th ed. Baltimore: Williams & Wilkins. [Google Scholar]
- Nunez PL (1981): Electric Fields of the Brain: The Neurophysics of EEG. New York: Oxford University Press. [Google Scholar]
- Nykamp DQ, Tranchina D (2000): A population density approach that facilitates large‐scale modeling of neural networks: analysis and an application to orientation tuning. J Comput Neurosci 8: 19–50. [DOI] [PubMed] [Google Scholar]
- Ogawa S, Menon RS, Tank DW, Kim SG, Merkle H, Ellerman JM, Ugurbil K (1993): Functional brain mapping by blood oxygenation level‐dependent contrast magnetic resonance imaging: a comparison of signal characteristics with a biophysical model. Biophys J 64: 803–812. [DOI] [PMC free article] [PubMed] [Google Scholar]
- Poznanski RR (2002): Dendritic integration in a recurrent network. J Integr Neurosci 1: 69–99. [DOI] [PubMed] [Google Scholar]
- Rauch A, Giancarlo LC, Hans‐Rudolf LR, Walter S, Stefano F (2003): Neocortical pyramidal cells respond as integrate‐and‐fire neurons to in vivo‐like input currents. J Neurophysiol 90: 1598–1612. [DOI] [PubMed] [Google Scholar]
- Riera J, Watanabe J, Kazuki I, Naoki M, Aubert E, Ozaki T, Kawashima R (2004a): A state‐space model of the hemodynamic approach: non‐linear filtering of BOLD signals. Neuroimage 21: 547–567. [DOI] [PubMed] [Google Scholar]
- Riera J, Bosch J, Yamashita O, Kawashima R, Sadato N, Okada T, Ozaki T (2004b): fMRI activation maps based on the NN‐ARx model. Neuroimage 23: 680–697. [DOI] [PubMed] [Google Scholar]
- Riera J, Aubert E, Iwata K, Kawashima R, Wan X, Ozaki T (2005): Fusing EEG and fMRI based on a bottom‐up model: inferring activation and effective connectivity in neural masses. Philos Trans R Soc Lond B 360: 1025–1041. [DOI] [PMC free article] [PubMed] [Google Scholar]
- Rizzoni G (2003): Principles and Applications of Electrical Engineering, 4th ed. New York: McGraw‐Hill. [Google Scholar]
- Rockland KS, Ichinohe N (2004): Some thoughts on cortical minicolumns. Exp Brain Res 158: 265–277. [DOI] [PubMed] [Google Scholar]
- Sadato N, Nakamura S, Oohashi T, Nishina E, Fuwamoto Y, Waki A, Yonekura Y (1998): Neural networks for generation and suppression of alpha rhythm: a PET study. Neuroreport 9: 893–897. [DOI] [PubMed] [Google Scholar]
- Salek‐Haddadi A, Friston KJ, Lemieux L, Fish DR (2003): Studying spontaneous EEG activity with fMRI. Brain Res Rev 43: 110–133. [DOI] [PubMed] [Google Scholar]
- Sheth SA, Nemoto M, Guiou M, Walker M, Pouratian N, Toga AW (2004): Linear and nonlinear relationships between neuronal activity, oxygen metabolism, and hemodynamic responses. Neuron 42: 347–355. [DOI] [PubMed] [Google Scholar]
- Singh M, Kim S, Kim TS (2003): Correlation between BOLD‐fMRI and EEG signal changes in response to visual stimulus frequency in humans. Magn Reson Med 49: 108–114. [DOI] [PubMed] [Google Scholar]
- Spruston N, Jaffe D B, Johnston D (1994): Dendrite attenuation of synaptic potentials and currents: the role of passive membrane properties. Trends Neurosci 17: 161–164. [DOI] [PubMed] [Google Scholar]
- Steriade M (2001): Impact of network activities on neuronal properties in corticothalamic systems. J Neurophysiol 86: 1–39. [DOI] [PubMed] [Google Scholar]
- Tagamets MA, Horwitz B (1998): Integrating electrophysiological and anatomical experimental data to create a large‐scale model that simulates a delayed match‐to‐sample human brain imaging study. Cereb Cortex 8: 310–320. [DOI] [PubMed] [Google Scholar]
- Tagamets MA, Horwitz B (2001): Interpreting PET and fMRI measures of functional neural activity: the effects of synaptic inhibition on cortical activation in human imaging studies. Brain Res Bull 54: 267–273. [DOI] [PubMed] [Google Scholar]
- Tamas G, Somogyi P, Buhl EH (1998): Differentially interconnected networks of GABAergic interneurons in the visual cortex of the cat. J Neurosci 18: 4255–4270. [DOI] [PMC free article] [PubMed] [Google Scholar]
- Traub RD, Contreras D, Cunningham MO, Murray H, LeBeau FEN, Roopun A, Bibbig A, Wilent WB, Higley M, Whittington MA (2005): Single‐column thalamocortical network model exhibiting gamma oscillations, sleep spindles, and epileptogenic bursts. J Neurophysiol 93: 2194–2232. [DOI] [PubMed] [Google Scholar]
- Tucker TR, Katz LC (2003): Spatiotemporal patterns of excitation and inhibition evoked by the horizontal network in layer 2/3 of ferret visual cortex. J Neurophysiol 89: 488–500. [DOI] [PubMed] [Google Scholar]
- Vanhatalo S, Tallgren P, Becker C, Holmes MD, Miller JW, Kaila K, Voipio J (2003): Scalp‐recorded slow EEG responses generated in response to hemodynamic changes in the human brain. Clin Neurophysiol 114: 1744–1754. [DOI] [PubMed] [Google Scholar]
- Waldvogel D, van Gelderen P, Muellbacher W (2000): The relative metabolic demand of inhibition and excitation. Nature 406: 995–998. [DOI] [PubMed] [Google Scholar]
- Wan X, Riera J, Iwata K, Takahoshi M, Wakabayashi T, Kawashima R (2006): The neural basis of the hemodynamic response nonlinearity in human primary visual cortex: implications for neurovascular coupling mechanism. Neuroimage (in press). [DOI] [PubMed] [Google Scholar]
- Wong TP, Marchese G, Casu MA, Ribeiro‐da‐Silva A, Cuello AC, De Koninck Y (2000): Loss of presynaptic and postsynaptic structures is accompanied by compensatory increase in action potential‐dependent synaptic input to layer V neocortical pyramidal neurons in aged rats. J Neurosci 20: 8596–8606. [DOI] [PMC free article] [PubMed] [Google Scholar]
- Zaletel M, Strucl M, Rodi Z, Zvan B (2004): The relationship between visually evoked cerebral blood flow velocity responses and visual‐evoked potentials. Neuroimage 22: 1784–1789. [DOI] [PubMed] [Google Scholar]
- Zheng Y, Martindale J, Johnston D, Jones M, Berwick J, Mayhew J (2002): A model of hemodynamic response and oxygen delivery to brain. Neuroimage 16: 617–637. [DOI] [PubMed] [Google Scholar]


