

Abstract
Response inhibition is an important facet of executive function. Fragile X syndrome (FraX), with a known genetic etiology (fragile X mental retardation‐1 (FMR1) mutation) and deficits in response inhibition, may be an ideal condition for elucidating interactions among gene‐brain‐behavior relationships. Functional magnetic resonance imaging (fMRI) studies have shown evidence of aberrant neural activity when individuals with FraX perform executive function tasks, though the specific nature of this altered activity or possible compensatory processes has yet to be elucidated. To address this question, we examined brain activation patterns using fMRI during a go/nogo task in adolescent males with FraX and in controls. The critical comparison was made between FraX individuals and age, gender, and intelligent quotient (IQ)‐matched developmentally delayed controls; in addition to a control group of age and gender‐matched typically developing individuals. The FraX group showed reduced activation in the right ventrolateral prefrontal cortex (VLPFC) and right caudate head, and increased contralateral (left) VLPFC activation compared with both control groups. Individuals with FraX, but not controls, showed a significant positive correlation between task performance and activation in the left VLPFC. This potential compensatory activation was predicted by the interaction between FMR1 protein (FMRP) levels and right striatal dysfunction. These results suggest that right fronto‐striatal dysfunction is likely an identifiable neuro‐phenotypic feature of FraX and that activation of the left VLPFC during successful response inhibition may reflect compensatory processes. We further show that these putative compensatory processes can be predicted by a complex interaction between genetic risk and neural function. Hum Brain Mapp, 2007. © 2007 Wiley‐Liss, Inc.
Keywords: fragile X syndrome, functional magnetic resonance imaging (fMRI), caudate head, ventrolateral prefrontal cortex (VLPFC), fragile X mental retardation protein (FMRP)
INTRODUCTION
Disorders with a known genetic etiology and with predictable cognitive profiles may be ideal model conditions for the study of interactions among genetic factors, brain function, and behavior. One of the most consistent findings in individuals with fragile X syndrome (FraX) is a deficit in inhibitory control [Hagerman et al., 1992; Mazzocco et al., 1992a, b; Sobesky et al., 1994; Thompson et al., 1994]. The ability to inhibit and adjust one's behavior to meet the demands of a dynamic environment is a critical component of executive function [Miller and Cohen, 2001]. It is hypothesized that this skill is implemented in a right lateralized fronto‐striatal network including the right ventrolateral prefrontal cortex (VLPFC) [Aron et al., 2004] and caudate [Menon et al., 2001; Vaidya et al., 1998; Wager et al., 2005].
Unlike many other developmental disorders, which are symptomatically defined and therefore likely to be etiologically heterogeneous, FraX has a well‐characterized genetic etiology. FraX, the most common etiology for heritable mental impairment, is caused by a mutation at the fragile X mental retardation‐1 (FMR1) gene on the long arm of the X chromosome which disrupts the transcription of mRNA and synthesis of fragile X mental retardation protein (FMRP). It has been demonstrated that FMRP plays an important role in typical brain development. Abnormal levels of FMRP have been associated with disruptions in synaptic maturation [Bardoni et al., 2000; Greenough et al., 2001] and dopamine function in the brain [Zhang et al., 2005], including the PFC and striatum [Gruss and Braun, 2004; Ventura et al., 2004]. Functional magnetic resonance imaging (fMRI) has recently been used to show that low levels of FMRP in females with FraX are correlated with reduced activation in the PFC and striatum during the performance of a go/nogo task [Menon et al., 2004]. These cognitive and neural findings may reflect primary neural deficits in inhibitory control specifically associated with the FraX neuro‐phenotype or alternatively (or interactively) may arise from impairment in the ability to switch attention [Cornish et al., 2004].
Males with the FMR1 full mutation represent an extreme in the FraX phenotype with lower levels of FMRP and greater magnitude of cognitive impairment than females [Reiss and Dant, 2003]. In addition to significant cognitive impairment, common neuropsychiatric symptoms in males with FraX include impulsivity, hyperactivity, and autistic behaviors. Understanding the neural underpinnings of cognitive and neuropsychiatric dysfunction in this genetic disorder is of great interest. To date, the only functional neuroimaging studies in FraX are with females, most likely because of the challenge of imaging male individuals with serious cognitive and behavioral problems. Thus, it is unknown whether males with FraX show aberrant neural activation patterns similar to that of females with this condition. It is also unclear whether abnormalities in brain activation are specific to FraX or simply because of a more general correlation with low intelligent quotient (IQ) or task performance in the scanner, as all functional neuroimaging studies have thus far compared individuals with FraX to healthy controls matched for age and gender. Finally, it is unknown which neural circuitry is involved when individuals with FraX are able to inhibit their responses. It is possible that these individuals may be using similar right fronto‐striatal networks as in typically developing individuals. Alternatively, individuals with FraX may be using different networks than typically developing individuals to perform such tasks. Such information may eventually be used to help guide the design of new cognitive remediation strategies for affected individuals.
The primary objective of this study was to further elucidate the functional neuro‐phenotype associated with deficient response inhibition in FraX. To attain this objective, we used a traditional go/nogo task in conjunction with fMRI in male adolescents with FraX. The Go/NoGo task used in the current study involved experimental blocks comprised of both Go and NoGo trials with half the trials in the experimental block containing NoGo conditions. Thus, these findings may not solely reflect response inhibition but also reflect a host of other cognitive functions, and the effect of NoGo response inhibition may be “diluted.” We chose this design, however, as event‐related designs with lower proportion of NoGo trials is extremely difficult to perform in children or populations with low IQ.
Based on previous imaging and cognitive studies from our lab and others [see Hessl et al., 2004; Reiss and Dant, 2003 for reviews], we hypothesized that males with FraX would show abnormal brain activation in areas associated with response inhibition, particularly the right fronto‐striatal network. We further hypothesized that aberrant right fronto‐striatal activity would be primarily associated with the specific genetic risk factor in FraX, as shown by comparison to developmentally delayed controls matched for age, gender, and IQ (DD) as well as to typically developing controls matched for age and gender (TD). Finally, we predicted that relatively better cognitive performance in males with FraX would be associated with reliance on alternative neural pathways, particularly within the contralateral (left) PFC. This last hypothesis was based on studies in individuals with lesions who show compensatory cognitive functions localized in the contralateral hemisphere [Blasi et al., 2002], as well as the tendency for persons with FraX to demonstrate relative strengths in verbal function [Dyer‐Friedman et al., 2002].
METHODS AND MATERIALS
Subjects
A total of 30 male subjects were included in this study, consisting of 10 participants with the FMR1 full mutation (mean age ± standard deviation (SD) = 15.4 ± 2.7 years, left handed = 0, FMRP = 26.6 ± 26.3%), 10 IQ matched controls with idiopathic developmental delay (DD) (mean age = 14.6 ± 2.7 years, left handed = 2), and 10 typically developing (TD) healthy controls (mean age = 16.7 ± 4.2 years, left handed = 0). The three groups were matched for age and race/ethnicity.
Fragile X diagnoses were confirmed using a standard DNA testing Methodology (Southern blot), and procedures for calculating FMRP were based on a rapid antibody test as elaborated in Willemsen et al. [1997]. More specifically, blood kits and consent forms were mailed directly to each family to obtain FMRP levels for the child with FraX. Blood draws were performed by a local physician and samples were mailed directly to Kimball Genetics (Denver, CO) using overnight mail. FMRP immunostaining, an indirect alkaline phosphatase technique, was used [Willemsen et al., 1997]. Slides were analyzed under the microscope, distinguishing lymphocytes from other blood cell types by morphology. For each slide, 200 lymphocytes were scored, and the percentage of lymphocytes expressing FMRP was determined. Scoring was performed in blinded fashion with respect to DNA results. The expected FMRP range in healthy males is (89 ± 6)% [Willemsen et al., 1997].
None of the participants had a contraindication for MRI and written informed consent and assent were obtained from child and parent, respectively according to the Declaration of Helsinki. This study was approved by the Stanford University Administrative Panel on Human Subjects in Medical Research.
Behavioral Assessment and Group Criteria
Overall cognitive functioning was assessed using the Wechsler Intelligence Scale for Children third edition (WISC‐III) and Wechsler Adult Intelligence Scale, Third Edition (WAIS‐III) for Subjects under and over 17 years of age, respectively.
Criteria for the DD (IQ‐matched) control group were met if participants' full‐scale IQ fell below one SD of the norm and participants did not have the diagnosis of FraX. Criteria for the TD group were met if the participants' IQ fell within or above the normal range and they were free of any significant psychiatric and/or behavioral problems as indicated by a T score within one SD of the mean of a normative standardized sample on the Child Behavior Checklist (CBCL; aged 4–18 years) [Achenbach, 1991] and the Symptom Checklist‐90‐R (SCL‐90‐R; for age 13 years through adulthood) [Derogatis, 1977].
In‐Scanner Task
The experimental task consisted of two alternating conditions: Go and NoGo/Go. Throughout both conditions subjects viewed a series of letters once every 2 sec (500 ms stimulus 1,500 ms interstimulus interval, ISI) and responded with a key press, using the forefinger of the right hand, to every letter except the letter “X,” to which they were instructed to withhold response. In the Go (control) condition, subjects were presented a random sequence of letters other than the letter “X”. In the NoGo/Go (experimental) condition, subjects were presented with the letter “X” 50% of the time. The entire task lasted a total of 372 sec and consisted of 12 alternating 26‐sec epochs of Go and NoGo/Go conditions flanked at the beginning and end by 30‐sec rest epochs during which the subject passively viewed a blank screen. Each epoch consisted of a 2‐sec instruction alerting the subject to the present task condition followed by 12 trials/epoch. Responses and reaction times (RT) were recorded.
Behavioral Data Analysis
For the in‐scanner task, the proportion of trials to which subjects correctly responded in a Go trial (Go% correct) and correctly inhibited in a NoGo trial (NoGo% correct) were calculated. Participants were excluded from the fMRI analysis if their performance on the scanner task fell at or below chance on both Go% correct and NoGo% correct. RTs for correctly pressing the key in Go trials (GoRT) and mistakenly pressing the key in NoGo trials (NoGoRT) were also calculated. Additionally, a single measure of the difference between the z‐transforms of hit—(correctly responding to Go trials) and false alarm—(incorrectly responding to NoGo trials) rates was obtained (defined as “overall task performance”) [Green and Swets, 1966]. Though this measure is typically used as a metric of discriminability, it was utilized as the primary measure of performance in this study to avoid confound from, for example, subjects who never pressed the key for Go or NoGo trials [such subjects would get 100% correct rejection (NoGo% correct) but 0% hit (Go% correct)]. Overall task performance and NoGo% correct, however, showed significant correlation (r = 0.58, P = 0.001, see also Results). Each behavioral measure was subjected to a one‐way analysis of variance (ANOVA) or Kruskal–Wallis ANOVA, for parametric and nonparametric data respectively, to assess for significant differences in performance between the three groups (P ≤ 0.05). Post‐hoc analyses were Dunn–Sidak corrected for multiple comparisons (P ≤ 0.05).
Image Acquisition
All imaging procedures were conducted at the Richard M. Lucas Center for Magnetic Resonance Spectroscopy and Imaging (Stanford University, Palo Alto, CA) on the center's 1.5 T General Electric Signa whole‐body MR system (GE Medical Systems, Milwaukee, WI). A total of 186 whole‐brain volumes were collected on eighteen axial‐oblique slices (6 mm‐thick, 1 mm‐skip) prescribed parallel to the intercommissural (AC‐PC) line, using a T2*‐weighted gradient echo spiral pulse sequence [Glover and Lai, 1998] sensitive to blood oxygen level‐dependent (BOLD) contrast with the following acquisition parameters: Echo Time (TE) = 30 msec, repetition time (TR) = 2,000 msec, flip angle = 89, FOV = 24 × 24, acquisition matrix = 64 × 64, voxel size = 3.75 × 3.75 × 6 mm3. Participants' heads were immobilized using a custom‐built head stabilizer to ensure minimal head movement during the scan.
All subjects participated in a mock scanning session to acclimate them to scanning procedures and further minimize head motion. Throughout the mock procedure subjects were presented a movie that was programmed to shut off for 3 sec whenever the subject moved beyond a set criterion. Increasingly stringent criteria were selected until subject movement was minimized to fewer than three movements exceeding 1 mm every 10 min.
fMRI Preprocessing
fMRI image processing and statistical analysis was performed using Statistical Parametric Mapping software (SPM2) (Wellcome Department of Cognitive Neurology, London, UK). After scanning, images were reconstructed, analyzed for motion, and realigned to the first functional volume. There was no significant difference in the absolute or relative motion parameters between any of the two groups (t (18) = 0.41–1.3, P = 0.20–0.69) [Jenkinson et al., 2002]. Sessions were then normalized using the mean functional volume resampled to 2 × 2 × 2 mm3 voxels in Montreal Neurological Institute (MNI) stereotaxic space and smoothed in three‐dimensional space with a Gaussian filter (4 mm full width half‐maximum, FWHM).
fMRI Group Analyses
Each subject's data were high pass filtered at 120 sec, globally scaled, and analyzed using a fixed effects model to reveal those areas that showed greater activation during the NoGo/Go than the Go task conditions (NoGo > Go contrast). First, to show whether our paradigm elicits “typical” activation patterns of response inhibition, we examined regions that showed significant activation in the TD group only. We then used a conjunction analysis [Friston et al., 1999, 2005; Nichols et al., 2005] to examine regions that showed greater activation in both of the following contrasts: TD compared with FraX and DD compared with FraX. Similarly, we used a conjunction analysis to examine activation occurring for the contrasts: FraX compared with TD and FraX compared with DD. These effects were confirmed using ANOVAs and post‐hoc tests Dunn‐Sidak corrected for multiple comparisions. Whole brain correlation analyses with brain activation and FMRP levels (in the case of FraX) or task performance were also performed.
SPMs were overlaid onto the high‐resolution T1 individual brain for viewing. Coordinates of activation were converted from MNI to Talairach space using the mni2tal function (http://www.mrc-cbu.cam.ac.uk/Imaging/Common/mnispace.shtml). Brain regions were then identified from these X, Y, Z coordinates using the Talairach Daemon (Research Imaging Center, University of Texas Health Science Center in San Antonio (RIC UTHSCSA), TX) and confirmed with the Talairach atlas [Talairach and Tournoux, 1988].
Region of Interest Analyses
Three Region of interests (ROI) derived from whole brain analyses (details in Results) were chosen for follow‐up analyses, based on our hypothesized locations of disruption and compensation in males with FraX: (1) right VLPFC and (2) right caudate head for interrogation of the right fronto‐striatal network, and (3) left VLPFC to assess putative compensatory activation.
To examine the relationship between brain activation, genetic risk (FMRP), and behavior (task performance), the following correlation analyses were performed separately: (1) task performance and brain activation (i.e., contrast values which are linear combination of beta parameters) for each group, (2) FMRP levels and brain activation in the FraX group, (3) brain activation amongst these ROIs, and (4) interaction effects between FMRP, task performance and brain activation. Interaction was calculated as the product of two or three variables of interest (e.g. right VLPFC and FMRP). Finally, a stepwise multiple regression analysis was performed using FMRP, task performance, brain activation of right VLPFC and caudate head, or interaction effects as predictors, with the F‐to‐entry set at 0.05 (default setting in Matlab, the Mathworks, MA). A forward stepwise procedure was utilized although similar results were obtained using a backward stepwise method. This final exploratory analysis was performed to ascertain which variables best predicted task performance.
Statistical Thresholds for fMRI Analyses
For whole brain analyses, a joint‐expected probability distribution [Poline et al., 1997] with height (P = 0.01) and extent (P = 0.01) thresholds corrected at the whole‐brain level were used except for conjunction analyses. For conjunction analyses, since the joint‐expected probability distribution is not validated and incorporated into SPM2, P = 0.001 uncorrected and extent threshold (et) = 10 was used. For confirmatory ANOVA and post‐hoc tests Dunn–Sidak corrected for multiple comparisons, P = 0.05 was adopted. Finally, for all ROI analyses, P = 0.05 correcting for the number of comparisons (Bonferroni correction) was adopted.
RESULTS
Demographic and Behavioral Results
See Table I for details. There was no significant difference in age between the three groups (F (2,27) = 1.1, P = 0.34). There was, however, a significant difference in IQ among the groups (F (2, 26) = 96.4, P < 0.001) which was driven by the TD subjects having significantly higher full‐scale IQ scores than that of the FraX or DD groups (both P's < 0.001); there was no significant difference between FraX and DD (P = 0.61).
Table I.
Group demographics and in‐scanner task performance
| Group | FraX | TD | DD |
|---|---|---|---|
| n | 10 | 10 | 10 |
| Age (years) | 15.36 (2.7) | 16.74 (4.2) | 14.56 (2.7) |
| Verbal IQ | 61.9 (11.5) | 127.3 (10.0) | 71.7 (13.9) |
| Performance IQ | 62.4 (8.0) | 118.1 (14.9) | 65.8 (13.9) |
| Full‐scale IQ | 59.2 (9.8) | 125.6 (11.5) | 65.3 (13.8) |
| Go%correct (%) | 97.1 (4.4) | 97.7 (4.6) | 79.6 (28.4) |
| NoGo%correct (%) | 92.1 (5.6) | 91.9 (7.0) | 81.7 (12.0) |
| Go RT (ms) | 597.4 (96.5) | 498.6 (75.2) | 601.7 (156.3) |
| NoGo incorrect RT (ms) | 426.3 (73.4) | 368.1 (39.0) | 532.0 (211.0) |
| Overall task performance | 3.90 (1.0) | 4.42 (0.3) | 2.17 (1.0) |
Values within parentheses indicate standard deviation.
There was no significant difference in GoRT or NoGoRT between groups (GoRT: F (2,26) = 2.3, P = 0.12, NoGoRT: Kruskal Wallis H (2) = 4.1, P = 0.13). Significant differences were found between groups in Go% correct, NoGo% correct and overall task performance (Kruskal Wallis H(2) = 9.6, P = 0.01, F (2,27) = 4.7, P = 0.02, and F (2,27) = 20.9, P < 0.001, respectively). Post‐hoc analyses revealed that the DD group had a trend for significantly lower Go% correct (both P's < 0.1), and a significantly lower NoGo% correct and overall task performance (all P's < 0.05) than that of TD and FraX. There was no significant difference between TD and FraX in Go% correct, NoGo% correct, and overall task performance (P = 1.0, 1.0, 0.42, respectively). As expected, overall task performance and NoGo% correct showed significant correlation (r = 0.58, P = 0.001).
Whole Brain Neuroimaging Results
Brain activation in healthy controls
First, we examined activation patterns in the TD group to assess whether the block‐design go/nogo task elicited responses similar to that described in the extant literature. We found significant activation for the NoGo > Go contrast in the bilateral VLPFC (right > left), bilateral precentral gyri (PCG), right inferior parietal lobule, superior to middle temporal gyrus and left insula (P = 0.01 corrected), agreeing with results from past studies (Fig. 1).
Figure 1.
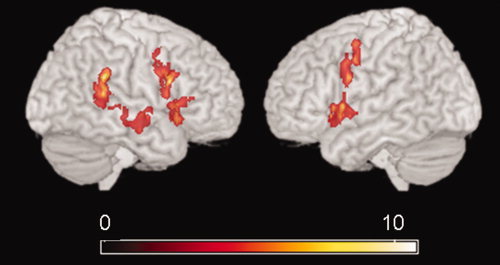
Brain activation during response inhibition. NoGo > Go contrast images for all subjects in the TD group were submitted to a one sample t‐test with a P ‐value = 0.01 (corrected). [Color figure can be viewed in the online issue, which is available at www.interscience.wiley.com.]
Comparing patterns of brain activation between groups
We then examined brain areas that showed greater activation for both TD compared to FraX and DD compared to FraX. These areas included the VLPFC, basal ganglia, hippocampus, temporal cortex, ACC and PCC and lingual gyrus in the right hemisphere, and the DLPFC in the left hemisphere (Table II, Fig. 2a). The right VLPFC and caudate head that showed a significant effect in the conjunction analysis were defined as functionally derived ROIs for further analyses.
Table II.
Significant brain activation for conjunction analysis between TD vs. FraX and DD vs. FraX (NoGo > Go)
| Region | Brodmann area | Talairach coordinates | Z score | P value | Voxels | ||
|---|---|---|---|---|---|---|---|
| x | y | z | |||||
| TD > FraX and DD > FraX | |||||||
| Lt superior frontal, middle frontal gyri | 10, 9 | −24 | 48 | 22 | 3.79 | <0.00001 | 39 |
| Rt inferior frontal, superior temporal gyri | 47, 44, 22 | 44 | 15 | −11 | 3.60 | <0.00001 | 165 |
| Rt lentiform nucleus putamen, caudate head | 18 | 10 | 1 | 3.05 | 0.00001 | 63 | |
| Lt Precentral, middle frontal gyri | 9, 6 | −50 | 6 | 33 | 2.94 | 0.00002 | 107 |
| Rt middle frontal precentral, inferior frontal gyri | 6, 9 | 36 | 2 | 37 | 3.56 | <0.00001 | 49 |
| Anterior cingulate, Rt lentiform nucleus putmen | 25 | 8 | 2 | −8 | 3.28 | 0.00001 | 66 |
| Lt precentral gyrus | 6 | −36 | −2 | 33 | 3.88 | <0.00001 | 64 |
| Rt middle temporal gyrus | 21 | 57 | −8 | −3 | 3.39 | <0.00001 | 118 |
| Rt insula, superior temporal gyrus | 13, 22, 21 | 44 | −14 | 1 | 2.97 | 0.00002 | 86 |
| Lt caudate tail | −36 | −18 | −9 | 3.36 | <0.00001 | 196 | |
| Rt lentiform nucleus, Putamen, hippocampus, substantia niagra | 30 | −25 | 3 | 2.91 | 0.00002 | 120 | |
| Lt inferior parietal lobule | 40 | −40 | −30 | 31 | 3.83 | <0.00001 | 73 |
| Rt caudate tail, transverse temporal gyrus | 41 | 36 | −35 | 0 | 2.97 | 0.00001 | 42 |
| Rt superior temporal gyrus, insula | 13 | 53 | −44 | 19 | 3.56 | <0.00001 | 213 |
| Rt posterior cingulate | 29 | 16 | −46 | 12 | 3.32 | <0.00001 | 34 |
| Rt lingual gyrus | 19 | 26 | −58 | 1 | 3.91 | <0.00001 | 50 |
| FraX > TD and FraX > DD | |||||||
| Lt inferior frontal gyrus | 46 | 48 | 42 | 20 | 2.87 | <0.00001 | 30 |
| Lt superior frontal gyrus | 8 | −22 | 41 | 42 | 4.14 | <0.00001 | 79 |
| Lt superior frontal gyrus | 6 | −4 | 30 | 56 | 3.69 | <0.00001 | 13 |
| Rt cingulate gyrus | 24 | 12 | 2 | 42 | 2.58 | <0.00001 | 16 |
| Rt middle frontal gyrus | 8 | 32 | 29 | 37 | 3.28 | <0.00001 | 16 |
| Rt middle frontal gyrus | 40 | −44 | −54 | 51 | 3.22 | <0.00001 | 26 |
| Lt inferior parietal lobule | −8 | −31 | −3 | 3.21 | <0.00001 | 38 | |
| Lt precuneus | 13 | −38 | 22 | 12 | 2.94 | <0.00001 | 12 |
| Lt thalamus | 31,7 | −2 | −74 | 28 | 3.10 | <0.00001 | 50 |
Figure 2.
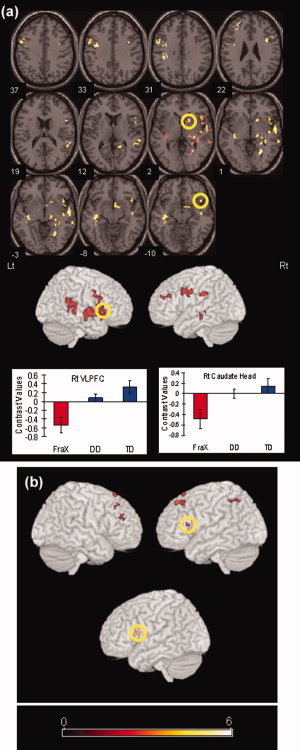
Brain regions that showed significant difference in activation (NoGo > Go contrast) from the conjunction between TD and FraX, and DD and FraX. (a) Brain regions that showed significantly greater activation for both TD compared to FraX and DD compared with FraX. (b) (top) Brain regions that showed significantly greater activation for both FraX compared with TD and FraX compared with DD. (bottom) Brain region that showed significant positive correlation between task performance and brain activation. Numerical values under each axial slice are Talairach z coordinates. Bar graphs of contrast values (i.e., linear combination of beta parameters) of representative brain regions that were used in later correlation analyses. Error bars represent standard error of the mean. [Color figure can be viewed in the online issue, which is available at www.interscience.wiley.com.]
Confirmatory analyses using repeated measures ANOVA of the NoGo > Go ROI contrast values (of all regions showing greater activation for controls compared with FraX in the conjunction analysis) revealed a main effect for Group [TD, DD, FraX] (F (2,27) = 7.41, P = 0.003), trend for a main effect for ROIs [all ROIs in Fig. 2a] (F (1,27) = 3.73, P = 0.06), and no Group × ROI interaction (F (2,27) = 1.13, P = 0.34). Post‐hoc tests showed that TD had significantly greater activation compared with FraX (P = 0.003), and DD compared to FraX (P = 0.03), confirming results from the whole brain analysis. There were no significant differences in brain activation in these ROIs between TD and DD (P = 0.79).
Whole brain correlation analyses with brain activation and task performance in the non‐FraX groups showed significant positive correlation in the right VLPFC and right caudate (P = 0.01 corrected). The only other region that showed significant correlation was a positive association found in the left insula. There were no significant negative correlations between brain activation and task performance.
We then examined the opposite contrast, i.e., brain areas that showed significantly greater activation for both FraX compared with TD and FraX compared with DD. Significantly greater activation for FraX was found in left VLPFC, bilateral DLPFC, right cingulate, left thalamus, left intraparietal lobule, and left precuneus (Table II, Fig. 2b).
Confirmatory analyses using repeated measures ANOVA of the NoGo > Go contrast estimates (of all regions showing greater activation for FraX compared with controls in the conjunction analysis), revealed a main effect for Group (F (2,27) = 6.95, P = 0.004), no main effect for ROIs (F (1,27) = 2.45, P = 0.13), and no interaction (F (2,27) = 0.05, P = 0.95). Post‐hoc tests showed that FraX had significantly greater activation compared with both TD (P = 0.004), and DD (P = 0.03), confirming the results from the whole brain analysis. No significant difference in brain activation in these ROIs was observed between TD and DD (P = 0.83).
Whole brain correlation analyses with brain activation and task performance in the FraX group showed significant positive correlation only in the left VLPFC (P = 0.01 corrected; Fig. 2b). There were no significant negative correlations between brain activation and task performance. The left VLPFC ROI that showed a significant effect in the correlation analysis was defined as a functionally derived ROI for further analyses.
Because there was a significant difference in IQ between the TD and FraX groups and in task performance between the DD and FraX groups (note however, greater performance in FraX), we repeated the conjunction analyses while regressing out IQ and task performance. These results were highly similar to those described earlier. Hence IQ and task performance were not considered in further analyses.
ROI Analyses of the Fronto‐Striatal Network
Right fronto‐striatal network and its association with task performance in controls
As expected, there was a significant positive correlation between task performance and right VLPFC activation (RtVLPFC corr. performance; rho = 0.58, P = 0.008), and between task performance and right caudate head activation (RtCAUDATE corr. performance; rho = 0.55, P = 0.03) in the non‐FraX groups. The TD and DD groups appeared to contribute equally to both correlations (all rho's = 0.50–0.54).
Further, control subjects showed a significant positive correlation between activation of right VLPFC and activation of right caudate head (RtVLPFC corr. RtCAUDATE; non‐FraX rho = 0.74, P < 0.001; TD rho = 0.41, DD rho = 0.49; Fig. 3a). These results indicate that activation in the right fronto‐striatal regions was associated with task performance in control subjects.
Figure 3.
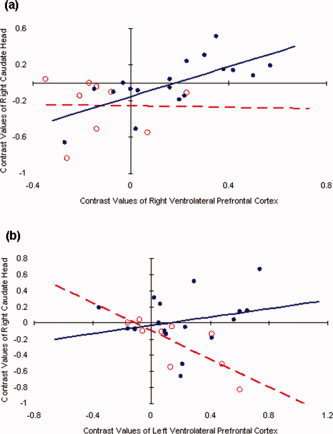
Dissociation between FraX participants and controls in covariance of brain activation (NoGo > Go contrast) in prefrontal regions and caudate. (a) Significant positive correlation in contrast estimates between the right caudate head and right ventrolateral prefrontal cortex (VLPFC) in non‐FraX (rho = 0.74, P < 0.001; TD rho = 0.41, DD rho = 0.49), but not FraX adolescents (rho = −0.02, P = 0.96). (b) Significant negative correlation in contrast estimates between right caudate head and left VLPFC in FraX (rho = −0.85, P = 0.004), but not non‐FraX adolescents (rho = 0.27, P = 0.52; TD rho = −0.38, DD rho = 0.08). Closed circles and solid lines indicate non‐FraX, open circles and dotted lines indicate FraX. [Color figure can be viewed in the online issue, which is available at www.interscience.wiley.com.]
Right fronto‐striatal network and its association with task performance in FraX
Next, we examined whether there was an association between right VLPFC activation, caudate head activation and task performance in FraX. The association between task performance and right VLPFC activation was not significant (RtVLPFC corr. performance; rho = −0.040, P = 0.84). There was, however, a significant negative correlation between task performance and right caudate head activation (RtCAUDATE corr. performance; rho = −0.90, P = 0.003), in contrast to the positive correlation found in non‐FraX participants. Unlike control subjects, there was no significant correlation between right VLPFC activation and right caudate head activation (RtVLPFC corr. RtCAUDATE; rho = −0.02, P = 0.96; Fig. 3a) in the FraX group.
Left VLPFC activation and its association with task performance in FraX
To examine whether left VLPFC could potentially be a site for compensatory activation in FraX, we performed correlation analyses between task performance and left VLPFC brain activation. As expected (from whole brain analyses) a significant correlation between left VLPFC activation and task performance was observed (LtVLPFC corr. performance; rho = 0.75, P = 0.03). The correlations between task performance and the left VLPFC ROI in non‐FraX was not significant (non‐FraX rho = 0.11, P = 0.66; TD rho = −0.04, DD rho = −0.01).
If left VLPFC activation is, in part, compensating for right fronto‐striatal dysfunction in individuals with FraX, this might also be reflected in a negative correlation between left VLPFC and right caudate head activation. As predicted, activation in the left VLPFC showed a significant negative correlation with right caudate head activation (LtVLPFC corr. RtCAUDATE; rho = −0.85, P = 0.004; Figs. 3b and 4). A similar association was not observed for controls (non‐FraX rho = 0.27, P = 0.52; TD rho = −0.38, DD rho = 0.08; Fig. 3b).
Figure 4.
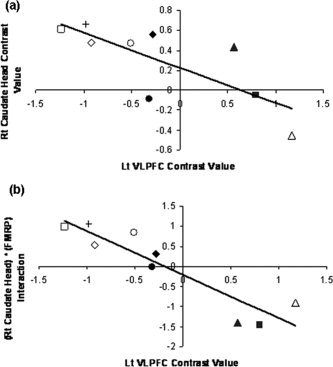
(a) Covariance between left VLPFC activation and right caudate head activation, and (b) covariance between left VLPFC activation and the interaction between right caudate head activation and FMRP in FraX. These figures indicate that data in (b) (rho = −0.90, P < 0.001) show a greater fit to the regression line than data in (a) (rho = −0.80, P = 0.01). In particular, subjects with lower right caudate head activation show greater fit to the linear regression line by multiplying right caudate head activation with FMRP values (i.e., interaction between right caudate head activation and FMRP) rather than right caudate head activation alone. Even when scores are Z‐transformed, or when one subject (who showed the largest positive left VLPFC activation and largest negative right caudate activation) is excluded, as shown in this figure, there is a strong association between left VLPFC activation. NoGo > Go contrasts were used. Each subject is coded with a different symbol.
Right fronto‐striatal dysfunction and its association with FMRP level in FraX
The association between FMRP and right VLPFC or right caudate head activation was not significant in subjects with FraX (RtVLPFC corr. FMRP; rho = −0.29, P = 1.00; RtCAUDATE corrr. FMRP; rho = −0.18, P = 1.00). Because, fronto‐striatal dysfunction in FraX might occur at the network level as opposed to individual brain regions, a follow‐up analysis examined the effect of interactions between the PFC and striatum. A correlation analysis between FMRP and the interaction between right VLPFC and right caudate head activation showed a marginally significant correlation ([RtVLPFC * RtCAUDATE] corr. FMRP; rho = 0.62, P = 0.05) indicating that greater levels of “typical” fronto‐striatal activity (i.e., similar to that observed in controls) were associated with higher (more typical) levels of FMRP.
Left VLPFC activation and its association with FMRP levels in FraX
The association between FMRP and left VLPFC activation (LtVLPFC corr. FMRP; rho = 0.48, P = 0.48) was not significant. However, we hypothesized that the interaction of FMRP and right caudate dysfunction (based on the past literature on caudate abnormality in FraX) might influence the degree to which FraX participants recruited the left VLPFC, a putative site for neural compensation, and hence performed the following secondary analyses. Left VLPFC activation and the interaction between FMRP and right caudate head activation showed a significant negative correlation (LtVLPFC corr. [FMRP * RtCAUDATE]; rho = −0.93, P < 0.001; Fig. 4). This finding indicates that reduced caudate activation in the presence of higher levels of FMRP is associated with greater activation in the left VLPFC.
Finally, to investigate which variable (activation of right caudate or right VLPFC, FMRP level, or interaction effects) would account for the greatest proportion of variance in left VLPFC activation, an exploratory stepwise forward multiple regression analysis was performed using left VLPFC activation as the dependent variable and (1) FMRP, (2) RtCAUDATE activation, (3) RtVLPFC activation, (4) [FMRP * RtCAUDATE] interaction, and (5) [RtVLPFC * RtCAUDATE] interaction values as independent variables. The [FMRP * RtCAUDATE] interaction was the only variable entered (adjusted r‐square = 0.82, P < 0.001) indicating the significance of the interaction [FMRP * RtCAUDATE] in predicting left VLPFC activation. All of the above interaction and multiple regression analyses repeated using z‐transformed variables revealed similar results.
DISCUSSION
Our study investigated fronto‐striatal dysfunction and compensatory neural mechanisms during a response inhibition task in FraX, a neurogenetic disorder associated with reduced levels of FMRP, a protein explicitly involved in synaptic plasticity and learning. We found that task performance in FraX was associated with activation in the left VLPFC, and not by right fronto‐striatal regions. Further, we show that interactions between FMRP and right striatal dysfunction are associated with this putative compensatory left VLPFC activation in FraX, and that the extent of right fronto‐striatal dysfunction in FraX is correlated with FMRP levels. The findings here provide intriguing evidence that link genetics, functional neuro‐phenotypes, and neural processes underlying a critical cognitive function (response inhibition).
To the best of our knowledge, this work represents the first fMRI study of males with FraX. As an X‐linked semi‐dominant genetic disorder, the cognitive and behavioral manifestations of FraX are typically more severe in males than in females. Males with the full FMR1 mutation represent an extreme of the syndrome, the study of which is necessary to fully understand the role of FMRP in neurodevelopment.
Another novel aspect of this functional neuroimaging study was the inclusion of two control groups; one that consisted of typically developing adolescents matched for age (TD), and another consisting of developmentally delayed adolescents matched for both age and IQ (DD). The second IQ‐matched control group, new to the FraX fMRI literature, allowed us to reduce confounds of general intelligence and increase the specificity of our results to FraX. Response inhibition is facilitated through the interaction of several cognitive processes including sustained attention, target detection, and rule maintenance [Aron et al., 2004]. While the block‐design employed in the go/nogo task utilized here allowed for adequate task performance in all three groups, this design feature also precluded further analysis of each of these specific neuropsychological components. Nonetheless, the finding of right ventral fronto‐striatal dysfunction in FraX compared with TD and DD is of particular importance as this finding appears to be specifically related to reduced levels of FMRP as opposed to general differences in cognitive function or task performance.
Conforming with previous studies of response inhibition [Aron et al., 2004; Casey et al., 2001; Robbins, 1996; Tranel et al., 1994], control participants relied on brain regions including the right fronto‐striatal network to perform the task. TD as well as DD participants showed greater activation than FraX participants in brain regions known to be important for response inhibition, including the right VLPFC and right caudate head, and activation in these regions showed positive correlations with task performance. These findings are consistent with anatomical studies that have shown direct connections between the striatum and PFC [Alexander et al., 1986; Goldman‐Rakic, 1987; Masterman and Cummings, 1997]. Interestingly, overall brain activation was not significantly different between TD and DD participants, despite differences in task performance. There may be however, subtle regional differences in the brain activation patterns during response inhibition between groups which may become significant with larger sample.
Participants with FraX in turn, showed prominent dysfunction in the right fronto‐striatal network. Specifically, we observed significantly reduced activation in the right VLPFC and right caudate head when compared with Non‐FraX participants. Further, there were no positive correlations between task performance and brain activation in these regions, and no correlation between right VLPFC and right caudate head activation. In addition, there was a marginally significant correlation between FMRP and the interaction between right VLPFC and right caudate head activation such that higher FMRP levels were correlated with greater interaction. These results build upon our previous study of females with FraX who also showed reduced activation in these regions, and positive correlations between FMRP and VLPFC—striatum activation during response inhibition [Menon et al., 2004]. Results from previous imaging studies of FraX show that reduced VLPFC activation occurs in other cognitive tasks as well [Kwon et al., 2001; Rivera et al., 2002; Tamm et al., 2002a]. Morphometric imaging findings in FraX have demonstrated increased caudate volumes [Eliez et al., 2001; Reiss et al., 1995], and aberrant white matter anatomy within fronto‐striatal pathways [Barnea‐Goraly et al., 2003]. Thus, converging results in FraX indicate a particularly important role for reduced FMRP levels in the abnormal development and function of the human PFC, striatum, and fronto‐striatal network. Dysfunction of this network could contribute to many of the cognitive and behavioral manifestations of the syndrome including deficits in executive function, impulsivity, hyperactivity, and some autistic behaviors.
A compensatory reorganization of neural processing to other brain regions may have enabled some individuals with FraX to adequately perform the in‐scanner task, despite dysfunction of the right fronto‐striatal network. Our results implicate the left VLPFC as a candidate region for such reorganization. In FraX, there were highly significant correlations between activation of the left VLPFC and task performance. While there is no direct evidence for a compensatory role for the left VLPFC in FraX, developmental studies have shown increased reliance on DLPFC and/or left VLPFC with younger age and decreasing performance in tasks requiring response inhibition or interference suppression [Bunge et al., 2002; Tamm et al., 2002b]. Further, It is possible that when adolescents with FraX are unable to recruit the right fronto‐striatal network, they rely on a network similar to that of younger children to perform the task, perhaps using verbal strategies [Tamm et al., 2002b].
The interaction between FMRP and right caudate activation was most predictive of left VLPFC activation in FraX—accounting for 82% of the variance. This finding indicates that activity of the left VLPFC and subsequent task performance was dependent, in part, on the level of dysfunction in the right striatal network and relatively higher levels of FMRP. As a potential explanation for this phenomenon, we hypothesize that in the face of fronto‐striatal impairment, males with FraX use a compensatory mechanism involving the left VLPFC via routes other than the right fronto‐striatal network to perform the task (Fig. 5). Such a strategy may be particularly required given major morphological abnormalities of the striatum in this condition [Eliez et al., 2001; Reiss et al., 1995]. Indeed, other pathways for inhibiting prepotent behaviors have been suggested to coexist; a relatively fast inhibitory pathway from the PFC to thalamo‐cortical connections via the subthalamic nucleus [Nambu et al., 2002], and a more inefficient pathway in which the PFC decreases tonic excitation of the cerebellar dentate nucleus resulting in less excitation of the thalamic target [Middleton and Strick, 2000, 2001]. Future fMRI studies are warranted to clarify the compensatory neural pathways and cognitive strategies used by male individuals with FraX.
Figure 5.
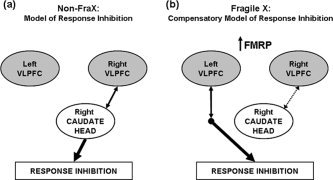
Potential models of response inhibition. (a) In non‐FraX individuals, a right lateralized fronto‐striatal network (right ventrolateral prefrontal cortex (VLPFC) and right caudate head) is hypothesized to facilitate accurate performance on the Go/NoGo task. (b) In FraX, this fronto‐striatal pathway appears to be aberrant. We hypothesize that accurate task performance among FraX individuals is facilitated by compensatory neural mechanisms relying in part on the contralateral (left) VLPFC. The presence of FMRP in the context of right fronto‐striatal dysfunction appears to influence the degree to which individuals with FraX show activation in left VLPFC, which is directly correlated with task performance. Note, that arrows linking regions do not imply direct anatomical connections but rather, functional associations.
Improved understanding of the role of dopamine in the PFC may also offer means of understanding the data presented here. Dopamine is a crucial neurotransmitter in tuning neuronal and circuit responses during executive processes [Goldberg and Weinberger, 2004]. Recent studies indicate that genetic factors affect dopamine flux in PFC [Gogos et al., 1998; Mattay et al., 2003] and striatum [Goldberg and Weinberger, 2004; Sesack et al., 1998]. While evidence of FMRP effects on dopamine function are not yet well‐established, studies have reported abnormal dopamine function in drosophila FraX mutant brains [Zhang et al., 2005] and in the striatum and cortical regions of FMR1 knockout mice [Gruss and Braun, 2004; Ventura et al., 2004]. Further, amphetamine injection which increases dopamine release affects the PFC and striatum differently leading to improved cognitive function (object recognition) in FMR1 knockout mice [Ventura et al., 2004]. These findings and the associations with FMRP in our current study suggest that the FMR1 gene may affect development and function of the fronto‐striatal network and compensatory mechanisms via the dopaminergic system.
It should be noted that the results shown here are not direct evidence of functional or anatomical connectivity but simply show “covariance” between brain regions at a between‐subject level. Future studies using multiple neuroimaging modalities such as functional (functional connectivity) and structural neuroimaging (DTI and volumetric studies) within the same subjects are warranted for the development of more sophisticated models for understanding the links between gene, brain, and behavior in FraX.
Other limitations include; (1) Small sample‐size: While it is very difficult to recruit FraX and DD male adolescents who can perform the task sufficiently and conform to the rigorous motion control demands of MRI, the results reported here should be interpreted with caution until replicated in a larger sample. In particular, because of the small sample‐size and the number of regression analyses performed here (note that they were however, corrected for multiple comparisons), some of the detected effects must be regarded as exploratory. (2) Block‐design: We utilized a block‐design containing NoGo trials in half the trials. Thus the findings reported here may not only reflect response inhibition but also changes in set, stimulus analysis, response preparation, processing of conflict and error, and novelty processing as well as mixed event types. Although we found activation patterns in TD similar to the previous literature, future studies exploring better paradigms to interrogate response inhibition are necessary.
In summary, our current findings are consistent with the hypothesis that the fronto‐striatal network is part of an executive modulatory network through which genetic factors affect brain function and, consequently, behavior. We show evidence that the “typical” right fronto‐striatal network during response inhibition is impaired in the absence of normal FMR1 gene expression, potentially via dopaminergic function. In turn, reduced FMR1 gene expression may directly or indirectly affect compensatory neural mechanisms via left PFC function. The results of present and future research on this topic may prove to be directly relevant to the study of other psychiatric and developmental disorders known to be associated with problems in response inhibition, such as obsessive‐compulsive disorder (OCD), attention‐deficit hyperactivity disorder (ADHD), drug/alcohol addiction, and Tourrette's syndrome. This knowledge will hopefully give way to a better understanding of the functional architecture of the human brain as well as to improvement of interventions for the treatment of FraX and other neuro‐developmental disorders.
Acknowledgements
We thank the families that participated in the study and Dr. Annette Taylor who performed the DNA and FMRP testing for children with fragile X syndrome.
REFERENCES
- Achenbach TM ( 1991): Manual for the Child Behavior Checklist/4–18 and 1991 Profile. Burlington, VT: Department of Psychiatry, University of Vermont; x, 288 pp. [Google Scholar]
- Alexander GE, DeLong MR, Strick PL ( 1986): Parallel organization of functionally segregated circuits linking basal ganglia and cortex. Annu Rev Neurosci 9: 357–381. [DOI] [PubMed] [Google Scholar]
- Aron AR, Robbins TW, Poldrack RA ( 2004): Inhibition and the right inferior frontal cortex. Trends Cogn Sci 8: 170–177. [DOI] [PubMed] [Google Scholar]
- Bardoni B, Mandel JL, Fisch GS ( 2000): FMR1 gene and fragile X syndrome. Am J Med Genet 97: 153–163. [DOI] [PubMed] [Google Scholar]
- Barnea‐Goraly N, Eliez S, Hedeus M, Menon V, White CD, Moseley M, Reiss AL ( 2003): White matter tract alterations in fragile X syndrome: Preliminary evidence from diffusion tensor imaging. Am J Med Genet B Neuropsychiatr Genet 118: 81–88. [DOI] [PubMed] [Google Scholar]
- Blasi V, Young AC, Tansy AP, Petersen SE, Snyder AZ, Corbetta M ( 2002): Word retrieval learning modulates right frontal cortex in patients with left frontal damage. Neuron 36: 159–170. [DOI] [PubMed] [Google Scholar]
- Bunge SA, Dudukovic NM, Thomason ME, Vaidya CJ, Gabrieli JD ( 2002): Immature frontal lobe contributions to cognitive control in children: Evidence from fMRI. Neuron 33: 301–311. [DOI] [PMC free article] [PubMed] [Google Scholar]
- Casey BJ, Durston S, Fossella JA ( 2001): Evidence for a mechanistic model of cognitive control. Clin Neurosci Res 1: 267–282. [Google Scholar]
- Cornish K, Swainson R, Cunnington R, Wilding J, Morris P, Jackson G ( 2004): Do women with fragile X syndrome have problems in switching attention: Preliminary findings from ERP and fMRI. Brain Cogn 54: 235–239. [DOI] [PubMed] [Google Scholar]
- Derogatis LR ( 1977): SCL‐90: Administration, scoring & procedures manual for the R(evised) Version and other instruments of the psychopathology rating scale series. Baltimore, MA: John Hopkins University School of Medicine. [Google Scholar]
- Dyer‐Friedman J, Glaser B, Hessl D, Johnston C, Huffman LC, Taylor A, Wisbeck J, Reiss AL ( 2002): Genetic and environmental influences on the cognitive outcomes of children with fragile X syndrome. J Am Acad Child Adolesc Psychiatry 41: 237–244. [DOI] [PubMed] [Google Scholar]
- Eliez S, Blasey CM, Freund LS, Hastie T, Reiss AL ( 2001): Brain anatomy, gender and IQ in children and adolescents with fragileX syndrome. Brain 124 (Part 8): 1610–1618. [DOI] [PubMed] [Google Scholar]
- Friston KJ, Holmes AP, Price CJ, Buchel C, Worsley KJ ( 1999): Multisubject fMRI studies and conjunction analyses. Neuroimage 10: 385–396. [DOI] [PubMed] [Google Scholar]
- Friston KJ, Penny WD, Glaser DE ( 2005): Conjunction revisited. Neuroimage 25: 661–667. [DOI] [PubMed] [Google Scholar]
- Glover GH, Lai S ( 1998): Self‐navigated spiral fMRI: Interleaved versus single‐shot. Magn Reson Med 39: 361–368. [DOI] [PubMed] [Google Scholar]
- Gogos JA, Morgan M, Luine V, Santha M, Ogawa S, Pfaff D, Karayiorgou M ( 1998): Catechol‐O‐methyltransferase‐deficient mice exhibit sexually dimorphic changes in catecholamine levels and behavior. Proc Natl Acad Sci USA 95: 9991–9996. [DOI] [PMC free article] [PubMed] [Google Scholar]
- Goldberg TE, Weinberger DR ( 2004): Genes and the parsing of cognitive processes. Trends Cogn Sci 8: 325–335. [DOI] [PubMed] [Google Scholar]
- Goldman‐Rakic PS ( 1987): Development of cortical circuitry and cognitive function. Child Dev 58: 601–622. [PubMed] [Google Scholar]
- Green D, Swets J. 1966. Signal Detection Theory and Psychophysics. Melbourne, Florida: Robert E. Kreiger Publishing. [Google Scholar]
- Greenough WT, Klintsova AY, Irwin SA, Galvez R, Bates KE, Weiler IJ ( 2001): Synaptic regulation of protein synthesis and the fragile X protein. Proc Natl Acad Sci USA 98: 7101–7106. [DOI] [PMC free article] [PubMed] [Google Scholar]
- Gruss M, Braun K ( 2004): Age‐ and region‐specific imbalances of basal amino acids and monoamine metabolism in limbic regions of female Fmr1 knock‐out mice. Neurochem Int 45: 81–88. [DOI] [PubMed] [Google Scholar]
- Hagerman RJ, Jackson C, Amiri K, Silverman AC, O'Connor R, Sobesky W ( 1992): Girls with fragile X syndrome: Physical and neurocognitive status and outcome. Pediatrics 89: 395–400. [PubMed] [Google Scholar]
- Hessl D, Rivera SM, Reiss AL ( 2004): The neuroanatomy and neuroendocrinology of fragile X syndrome. Ment Retard Dev Disabil Res Rev 10: 17–24. [DOI] [PubMed] [Google Scholar]
- Jenkinson M, Bannister P, Brady M, Smith S ( 2002): Improved optimization for the robust and accurate linear registration and motion correction of brain images. Neuroimage 17: 825–841. [DOI] [PubMed] [Google Scholar]
- Kwon H, Menon V, Eliez S, Warsofsky IS, White CD, Dyer‐Friedman J, Taylor AK, Glover GH, Reiss AL ( 2001): Functional neuroanatomy of visuospatial working memory in fragile X syndrome: Relation to behavioral and molecular measures. Am J Psychiatry 158: 1040–1051. [DOI] [PubMed] [Google Scholar]
- Masterman DL, Cummings JL ( 1997): Frontal‐subcortical circuits: The anatomic basis of executive, social and motivated behaviors. J Psychopharmacol 11: 107–14. [DOI] [PubMed] [Google Scholar]
- Mattay VS, Goldberg TE, Fera F, Hariri AR, Tessitore A, Egan MF, Kolachana B, Callicott JH, Weinberger DR ( 2003): Catechol O‐methyltransferase val158‐met genotype and individual variation in the brain response to amphetamine. Proc Natl Acad Sci USA 100: 6186–6191. [DOI] [PMC free article] [PubMed] [Google Scholar]
- Mazzocco MM, Hagerman RJ, Cronister‐Silverman A, Pennington BF ( 1992a): Specific frontal lobe deficits among women with the fragile X gene. J Am Acad Child Adolesc Psychiatry 31: 1141–1148. [DOI] [PubMed] [Google Scholar]
- Mazzocco MM, Hagerman RJ, Pennington BF ( 1992b): Problem solving limitations among cytogenetically expressing fragile X women. Am J Med Genet 43: 78–86. [DOI] [PubMed] [Google Scholar]
- Menon V, Adleman NE, White CD, Glover GH, Reiss AL ( 2001): Error‐related brain activation during a Go/NoGo response inhibition task. Hum Brain Mapp 12: 131–143. [DOI] [PMC free article] [PubMed] [Google Scholar]
- Menon V, Leroux J, White CD, Reiss AL ( 2004): Frontostriatal deficits in fragile X syndrome: Relation to FMR1 gene expression. Proc Natl Acad Sci USA 101: 3615–3620. [DOI] [PMC free article] [PubMed] [Google Scholar]
- Middleton FA, Strick PL ( 2000): Basal ganglia and cerebellar loops: Motor and cognitive circuits. Brain Res Brain Res Rev 31: 236–250. [DOI] [PubMed] [Google Scholar]
- Middleton FA, Strick PL ( 2001): Cerebellar projections to the prefrontal cortex of the primate. J Neurosci 21: 700–712. [DOI] [PMC free article] [PubMed] [Google Scholar]
- Miller EK, Cohen JD ( 2001): An integrative theory of prefrontal cortex function. Annu Rev Neurosci 24: 167–202. [DOI] [PubMed] [Google Scholar]
- Nambu A, Tokuno H, Takada M ( 2002): Functional significance of the cortico‐subthalamo‐pallidal ‘hyperdirect’ pathway. Neurosci Res 43: 111–117. [DOI] [PubMed] [Google Scholar]
- Nichols T, Brett M, Andersson J, Wager T, Poline JB ( 2005): Valid conjunction inference with the minimum statistic. Neuroimage 25: 653–660. [DOI] [PubMed] [Google Scholar]
- Poline JB, Worsley KJ, Evans AC, Friston KJ ( 1997): Combining spatial extent and peak intensity to test for activations in functional imaging. Neuroimage 5: 83–96. [DOI] [PubMed] [Google Scholar]
- Reiss AL, Abrams MT, Greenlaw R, Freund L, Denckla MB ( 1995): Neurodevelopmental effects of the FMR‐1 full mutation in humans. Nat Med 1: 159–167. [DOI] [PubMed] [Google Scholar]
- Reiss AL, Dant CC ( 2003): The behavioral neurogenetics of fragile X syndrome: Analyzing gene‐brain‐behavior relationships in child developmental psychopathologies. Dev Psychopathol 15: 927–968. [DOI] [PubMed] [Google Scholar]
- Rivera SM, Menon V, White CD, Glaser B, Reiss AL ( 2002): Functional brain activation during arithmetic processing in females with fragile X Syndrome is related to FMR1 protein expression. Hum Brain Mapp 16: 206–218. [DOI] [PMC free article] [PubMed] [Google Scholar]
- Robbins TW. ( 1996): Dissociating executive functions of the prefrontal cortex. Phil Trans R Soc Lond B Biol Sci 351: 1463–1470. [DOI] [PubMed] [Google Scholar]
- Sesack SR, Hawrylak VA, Matus C, Guido MA, Levey AI ( 1998): Dopamine axon varicosities in the prelimbic division of the rat prefrontal cortex exhibit sparse immunoreactivity for the dopamine transporter. J Neurosci 18: 2697–2708. [DOI] [PMC free article] [PubMed] [Google Scholar]
- Sobesky WE, Pennington BF, Porter D, Hull CE, Hagerman RJ ( 1994): Emotional and neurocognitive deficits in fragile X. Am J Med Genet 51: 378–385. [DOI] [PubMed] [Google Scholar]
- Talairach J, Tournoux P. 1988. Co‐planar Stereotaxic Atlas of the Human Brain. New York: Thieme. [Google Scholar]
- Tamm L, Menon V, Johnston CK, Hessl DR, Reiss AL. ( 2002a): fMRI study of cognitive interference processing in females with fragile X syndrome. J Cogn Neurosci 14: 160–171. [DOI] [PubMed] [Google Scholar]
- Tamm L, Menon V, Reiss AL. ( 2002b): Maturation of brain function associated with response inhibition. J Am Acad Child Adolesc Psychiatry 41: 1231–1238. [DOI] [PubMed] [Google Scholar]
- Thompson NM, Gulley ML, Rogeness GA, Clayton RJ, Johnson C, Hazelton B, Cho CG, Zellmer VT ( 1994): Neurobehavioral characteristics of CGG amplification status in fragile X females. Am J Med Genet 54: 378–383. [DOI] [PubMed] [Google Scholar]
- Tranel D, Anderson SW, Benton A. 1994. Development of the concept of ‘executive function’ and its relationship to the frontal lobes In: Boller F, Grafman J, editors. Handbook of Neuropsychology. Amsterdam: Elsevier; pp 125–148. [Google Scholar]
- Vaidya CJ, Austin G, Kirkorian G, Ridlehuber HW, Desmond JE, Glover GH, Gabrieli JD ( 1998): Selective effects of methylphenidate in attention deficit hyperactivity disorder: A functional magnetic resonance study. Proc Natl Acad Sci USA 95: 14494–14499. [DOI] [PMC free article] [PubMed] [Google Scholar]
- Ventura R, Pascucci T, Catania MV, Musumeci SA, Puglisi‐Allegra S ( 2004): Object recognition impairment in Fmr1 knockout mice is reversed by amphetamine: Involvement of dopamine in the medial prefrontal cortex. Behav Pharmacol 15: 433–442. [DOI] [PubMed] [Google Scholar]
- Wager TD, Sylvester CY, Lacey SC, Nee DE, Franklin M, Jonides J ( 2005): Common and unique components of response inhibition revealed by fMRI. Neuroimage 27: 323–340. [DOI] [PubMed] [Google Scholar]
- Willemsen R, Smits A, Mohkamsing S, van Beerendonk H, de Haan A, de Vries B, van den Ouweland A, Sistermans E, Galjaard H, Oostra BA ( 1997): Rapid antibody test for diagnosing fragile X syndrome: A validation of the technique. Hum Genet 99: 308–311. [DOI] [PubMed] [Google Scholar]
- Zhang YQ, Friedman DB, Wang Z, Woodruff E,3rd , Pan L, O'Donnell J, Broadie K ( 2005): Protein expression profiling of the drosophila fragile X mutant brain reveals up‐regulation of monoamine synthesis. Mol Cell Proteomics 4: 278–290. [DOI] [PubMed] [Google Scholar]