

Abstract
Theta increases with workload and is associated with numerous processes including working memory, problem solving, encoding, or self monitoring. These processes, in turn, involve numerous structures of the brain. However, the relationship between regional brain activity and the occurrence of theta remains unclear. In the present study, simultaneous EEG‐fMRI recordings were used to investigate the functional topography of theta. EEG‐theta was enhanced by mental arithmetic‐induced workload. For the EEG‐constrained fMRI analysis, theta‐reference time‐series were extracted from the EEG, reflecting the strength of theta occurrence during the time course of the experiment. Theta occurrence was mainly associated with activation of the insular cortex, hippocampus, superior temporal areas, cingulate cortex, superior parietal, and frontal areas. Though observation of temporal and insular activation is in accord with the theory that theta specifically reflects encoding processes, the involvement of several other brain regions implies that surface‐recorded theta represents comprehensive functional brain states rather than specific processes in the brain. The results provide further evidence for the concept that emergent theta band oscillations represent dynamic functional binding of widely distributed cortical assemblies, essential for cognitive processing. This binding process may form the source of surface‐recorded EEG theta. Hum Brain Mapp, 2006. © 2006 Wiley‐Liss, Inc.
Keywords: electroencephalography (EEG), functional MRI (fMRI), workload, mental arithmetic, frontal theta
INTRODUCTION
Ongoing brain electrical activity measured with EEG is a sensitive indicator of functional brain states [Lopes da Silva, 1991]. In healthy adults, EEG activity in the frequency range of ∼4–7 Hz, EEG‐theta, is not only an indicator of sleep‐stage I but can be found in a large variety of perceptual, cognitive, or behavioral tasks, especially in tasks involving working memory, mental effort, and short‐term memory load. Evidence for an association between theta and working memory processes or mental effort was summarized in several reviews [Klimesch, 1996, 1997, 1999]. Theta increases as task requirements increase [e.g., Gevins et al., 1979a–c; Gundel and Wilson, 1992; Ishihara and Yoshii, 1972; Miyata et al., 1990; Yamamoto and Matsuoka, 1990]. This theta increase is most pronounced over frontal leads; thus, the term frontal theta is often used. The maximum of frontal theta can often be found at midline electrodes. Using a task that required comparison of each stimulus to a preceding one on verbal or spatial attributes, Gevins et al. [1997] found an increased amplitude of frontal midline theta with increased memory load. Dipole models localized the source to the anterior cingulate cortex. Klimesch et al. [2005] describe theta during retrieval attempts as a wave spreading from anterior to posterior sites. When retrieval is achieved, theta spreads back to frontal sites [Sauseng et al., 2002]. EEG changes related to changing task requirements can be found not only in the theta‐band but also in the alpha‐band. A decrease in EEG‐alpha activity is associated with increased task requirements [e.g., Gevins et al., 1979a–c; Gundel and Wilson, 1992; Sterman et al., 1994]. In the upper alpha band (about 10–12 Hz), increased activity can be found during retention and retrieval [Klimesch et al., 2005]. Thus, it is possible to observe correlations between theta and alpha activity.
Mental arithmetic is a complex mental act. It requires the integration of multiple cognitive processes, consisting of activation of number representations, number recognition, memory search (e.g., direct access to a stored solution), mental calculation, decision making, response selection, or responding. Numerical ability and the representation of numbers in the brain is a separate research field in cognitive neuroscience. Dehaene et al. [2004] postulated that the human horizontal intraparietal sulcus is systematically involved in all number tasks. The prefrontal and inferior frontal cortex are also activated during mental arithmetic performance in subjects [Dehaene et al., 2004]. Activity in these areas generally reflects the engagement of working memory processes [Cabeza and Nyberg, 2000]. Even before the era of brain imaging, it was argued that working memory processes are involved in mental calculation [e.g., Hitch, 1978]. Hence, mental arithmetic tasks are frequently used to induce workload and investigate working memory. Number calculation tasks seem to be particularly suitable for the induction of working memory load because the amount of load can be easily varied by manipulating arithmetical features of the numerical task, e.g., the number of digits or operands. EEG‐theta has in fact been found to be enhanced during all kinds of mental calculation tasks. This enhancement has mainly been observed frontally and has been attributed to working memory load [Rugg and Dickens, 1982; Mecklinger et al., 1992].
Recent neuroimaging studies have found metabolic increases in regions of the frontal lobes as well as in other areas of association cortex during performance of working memory tasks [e.g., Courtney et al., 1996; Jonides et al., 1993; McCarthy et al., 1994; Owen et al., 1996; Paulesu et al., 1993; Smith et al., 1995, 1996]. Areas in the left parietal cortex and the frontal lobe were shown to be involved in mental arithmetic. Kong et al. [2005] found that performance of a simple arithmetic operation involved the right inferior parietal lobule, left precuneus, and left superior parietal gyrus (especially for subtraction). Bilateral medial frontal/cingulate cortex were involved in more complex arithmetic processing. Difficulty was associated with activation of the left inferior intraparietal sulcus, left inferior frontal gyrus, and bilateral cingulate. The results showed that during performance of more difficult problems additional regions were activated compared to a more basic set required for simple mental arithmetic operations. Using an arithmetic problem verification task, Kondo et al. [2004] found the anterior cingulate cortex, left prefrontal cortex, left inferior frontal cortex, and bilateral parietal cortex activated. When they split the subject sample according to test scores (reading span and operation span), activity changes in the anterior cingulate cortex were greater in the high‐span group under forced workload conditions (dual‐task) and effective connectivity from the anterior cingulate cortex to the left prefrontal cortex was stronger. Based on these results, a cingulate‐frontal network related to central executive functioning and attention shifting was proposed. For simple arithmetic operations, this cortical network is rather stable; for example, it does not show a significant aging effect [Kawashima et al., 2004]. Training of arithmetic problems modifies the activation pattern. Performance of untrained arithmetic problems results in enhanced activations in the left intraparietal sulcus, inferior parietal lobule, and left inferior frontal gyrus [Delazer et al., 2003]. With trained problems there was an activity shift from the intraparietal sulcus to the left angular gyrus, probably indicating a shift from quantity‐based processing to automatic processing.
In conclusion, theta has been associated with numerous working memory processes. Theta is working memory load‐dependent and functionally related to episodic retrieval processes. Neuroimaging studies have shown that the dorsolateral prefrontal cortex, multiple parietal areas, and other structures are significantly involved in working memory processes and mental arithmetic operations. Simultaneous neuroimaging and EEG has the potential to reveal whether surface‐recorded theta as an emergent mass phenomenon of brain activity is associated with the full set or a subset of working memory‐related brain regions.
In the present study, we investigated brain activity associated with mental arithmetic task‐induced working memory performance. EEG was recorded during functional MRI (fMRI), so EEG and fMRI data are from the identical isochronic task. Recently, a few studies have demonstrated the feasibility of simultaneously measuring EEG and fMRI [e.g., Laufs et al., 2003a; Lemieux et al., 2001; Hoffmann et al., 2000; Salek‐Haddadi et al., 2002; Sammer et al., 2005]. It was repeatedly shown that artifact subtraction [Allen et al., 1998, 2000] allows sufficient reconstruction of EEG, which is disturbed by gradient‐artifacts and cardio‐ballistic artifacts during fMRI scanning. Although amplitudes of the EEG signals recorded within the magnetic field of an MR scanner may differ slightly from EEG recorded outside such a magnetic field, the elementary waveforms and components can be preserved [Sammer et al., 2005]. In the current study, a theta time series was extracted from the EEG. This frequency band‐specific time series was correlated voxel‐by‐voxel with the blood oxygenation level‐dependent (BOLD) signal time series activity for each subject. The individual results were used to compute group statistics. Assuming that theta represents encoding or retrieval‐specific activity, a focus on hippocampal activation can be expected, rather than the full set consisting of all working memory and arithmetic processing‐associated areas to be activated. If theta, however, indicates a functional brain state, correlations between theta and activations in a large network of cortical areas would be likely. For nontask EEG‐alpha, Laufs et al. [2003a] reported a widespread bilateral and symmetric negative correlation between fMRI activation and alpha power in healthy subjects. Whenever alpha oscillations desynchronized, frontal and parietal cortical areas showed greater BOLD signal. Because EEG represents cortical electrical mass activity resulting in voltage distributions over the scalp and fMRI activations are computed as deviation from the mean or an experimental condition, EEG, and hemodynamic response patterns as revealed by fMRI can only partially represent the same processes. Hence, investigating the gross relationship between EEG and hemodynamic response is necessary for an improved understanding of the functional meaning of both EEG and fMRI.
SUBJECTS AND METHODS
Subjects
Twenty healthy right‐handed (Edinburgh Handedness Inventory; Oldfield, 1971) subjects (10 female, 10 male) took part in the study. All were students of the University of Giessen, where the study was performed. Mean age was 25.4 (range 20.3–39.6 years). Subjects were paid for their participation (€25.00). All subjects gave written informed consent.
Task
Subjects performed a mental arithmetic task consisting of 16 trials. Each trial consisted of 10 subsequently displayed numbers (range 0–20, selected by a random “put and take back” procedure), which had to be added by the subjects. Each number was presented for 500 ms. The interval between two numbers was 1,500 ms; during this epoch a fixation mark was displayed. Mental addition lasted for 20 s followed by the display of three numbers. Subjects were instructed to indicate by an appropriate button press which of the numbers was the correct sum of the previous addition task. The display of the three numbers was terminated by the subject's button press or after 1,300 ms. For motivational reasons, within these 1,300 ms a feedback‐word was given for the subjects indicating if the response was right or wrong. For comparison, eight reference trials were implemented. Instead of numbers, 10 zeros were presented during the addition period and three zeros were subsequently displayed. Timing and task were the same as for the mental arithmetic task.
Data Recording: EEG
EEG was recorded from 29 electrodes (10–20 system, plus FC1, FC2, CP1, CP2, FC5, FC6, CP5, CP6, TP9, TP10 [frontocentral, centro‐parietal and temporo‐parietal positions]). The sintered Ag/AgCl ring electrodes were attached using the BrainCap electrode‐cap (Falk‐Minow Services, Herrsching‐Breitbrunn, Germany), which is part of the MR‐compatible EEG‐recording system BrainAmp‐MR (BrainProducts, Munich, Germany). An electrode located between Fz and Cz was used as the reference electrode during recording. Electrode impedance was kept below 5 kOhm. In addition, vertical EOG was recorded using one channel. The remaining two channels of the 32‐channel system were used for recording the electrocardiogram (ECG) to control for heartbeat artifacts in the EEG. Within the scanner‐tube the subjects lay in a supine position. Head movement was restricted by a head clamp, attached to the head coil. Via a mirror, which was attached to the head‐coil, the subjects could watch a backlit screen, where the visual stimuli were projected from the back by an LCD projector. The projector was located outside the scanner room. Special lenses allowed projecting through a waveguide. The helium pump of the MR scanner was switched off to prevent artifacts in the EEG due to pump‐induced movements of the subjects. The mirror reduced the viewing angle to 18°. A BrainAmp‐MR 32‐channel amplifier was used to amplify the EEG signals. The sampling rate was 5 kHz. Filters were set to 0.016–250 Hz. Several triggers were recorded together with the biological signals, including stimulation, responses, and the volume‐trigger, indicating the onset of the gradient for the first slice‐measurement of a volume.
Data Recording: fMRI
Functional imaging was conducted with a 1.5 T Siemens Symphony whole body MR scanner with Quantum gradients. Functional scans were obtained using a single‐shot T2*‐weighted gradient‐echo planar imaging (EPI) sequence (TR = 4.5 s, TA = 81 ms, TE = 59 ms, flip angle = 90°, slice thickness = 6 mm). In‐plane resolution was 3 × 3 mm, the acquisition matrix consisted of 64 × 64 pixels; consequently, the field of view was 192 × 192 mm. The setup kept 2,880 ms windows between the acquisitions of subsequent volumes for gradient artifact‐free EEG recording (paused acquisition: 81 ms(TA) * 20(slices) + 2880 ms(pause) = 4500 ms = TR). Twenty axial slices were acquired in an interleaved fashion to cover the major part of the brain. An anatomical MRI was acquired using a T1‐weighted, 3D MPR sequence. This whole‐brain 3D image was used to control the normalizing procedure and for documentation.
Data Analysis
EEG preprocessing, artifact rejection
The first step of EEG preprocessing was the application of the offline MRI artifact correction method, which is implemented in BrainVision software (BrainProducts). The method was described by Allen et al. [1998, 2000] and repeatedly applied by Sammer et al. [2005]. The MR scanner volume marker was used for scanner artifact detection. EEG was averaged for an epoch of 2,000 ms, starting 200 ms prior to the marker‐onset and covering the time for the measurement of one entire volume, which consisted of 20 slices. The average was subtracted from the EEG. Data were lowpass‐filtered (cutoff at 70 Hz) and downsampled to 256 Hz. In a second step, cardio‐ballistic pulse artifacts were reduced in the data. A template match procedure was used, identifying pulse artifacts by correlation between a template and one ECG channel; the template was manually selected from the dataset before. Ten pulse intervals were averaged. The average was subtracted from the data, at least reducing the artifact amplitude. There is a time delay between pulse waveforms (template) in the ECG channel and the pulse artifact in the EEG channels, which was set to 0.21 s according to Allen et al. [2000]. The next step was to re‐reference the data to an average‐reference and to pass the EEG through appropriate filters. Bandpass filters were 2.5 Hz / 24 dB to 18 Hz. After segmentation of the data, an ocular correction [Gratton et al., 1983] (implemented in BrainVision) and blink detection were performed. Finally, the segments were visually inspected for remaining artifacts. Bad segments were excluded from further analysis.
EEG statistical analysis
The last step was averaging of the artifact‐corrected segments in the frequency domain. Averaging was performed for each experimental condition. Here, the increase in frontal theta with mental arithmetic processing was of interest. The area between 3.5 and 7.5 Hz of the absolute band power‐spectrum (window length = 10%, Hanning window) was calculated for F3, Fz, F4, and for P3, Pz, P4 as well. Frontal electrodes are the most informative leads in the context of working memory tasks. With surface‐recorded EEG in humans, increased theta over frontal (midline) regions can be found most frequently [Onton et al., 2005]. Using only intracranial recordings, widespread activity at temporal sensors was shown as well [Jensen and Tesche, 2002; Raghavachari et al., 2001]. In numerous studies, parietal involvement in working memory processes was found [Cabeza and Nyberg, 2000].
Repeated measurement analysis of variance was computed including the factors (level of factors in parentheses) mental arithmetic (2), electrode positions (3), and anterior‐posterior electrodes (2). Analogously, the area between 8.0–10.5 Hz was computed to test for effects in the lower alpha band.
fMRI data analysis
fMRI data were analyzed using SPM2 (Wellcome Institute of Neurology, University College of London, UK). The first five images were discarded. Images were preprocessed including slice time correction, movement correction, normalization, and smoothing (full‐width at half‐maximum, FWHM, = 8mm). At the first level, General Linear Models (GLMs) were applied to the data of each subject. Regressors were blocks of mental arithmetic performance and blocks of reference‐task processing. The movement parameters computed during the realignment procedure were included in the models.
The contrasts of interest were brought to the second level. At the second level, one‐sample t‐tests and F‐tests were computed. All results reported here are height thresh olded at P = 0.05, adjusted to control for the false‐discovery rate (FDR).
EEG correlated fMRI
Principal component analysis (PCA) is used to characterize distributed brain systems (functional connectivity) from a time series of neurophysiologic measurements [Alexander and Moeller, 1994; Friston, 1994]. The spatial modes that best characterize the observed spatiotemporal dynamics are identified in terms of the eigenvectors of the covariance matrix associated with the time series. The spatial modes are then identical to the principal components identified with a PCA [George and Bohning, 2002].
The EEG was preprocessed as described above. Based on spectral EEG‐coherence findings that low‐frequency (4–7 Hz) interactions between prefrontal and posterior areas mediate working memory processes [Sarnthein et al., 1998], three frontal electrodes (F3, Fz, F4) and three parietal electrodes (P3, Pz, P4) were selected for EEG/fMRI joint analysis. The EEG was bandpass‐filtered in the theta range between 3.5 and 7.5 Hz using an equiripple filter (–90 dB at 3 and 8 Hz.). The first principal component of these six locations was extracted, representing the shared theta activity in these channels.
The time course of theta during the experiment was computed as energy (envelope) of the rectified common signal. The energy was downsampled to the number of EPI‐volumes by averaging. The resulting vector was convolved with the hemodynamic response function (HRF) to match the delay of the BOLD response. Together with six movement parameters, this representation of the theta time course was taken as a regressor for the GLM. In a second analysis, the theta time course was separately computed from the EEG of three frontal electrodes (F3, Fz, F4), and from three parietal electrodes (P3, Pz, P4). The first principal component explained 74% of the variance at the frontal electrodes (standard deviation, SD, 9.4%) and 61.4% (SD 10.3%) at the parietal electrodes. Both theta time series were used as regressors in a second GLM fMRI analysis. However, the parietal theta time course was orthogonalized on the frontal theta time course by computing the principal components. This analysis gives information about what is additionally explained by posterior‐theta compared to frontal‐theta.
For both EEG‐correlated fMRI analysis, GLMs were applied to the data of each subject at the first level. Design matrices consisted of the movement regressors, the theta regressors, and the mean. For group analysis, the contrasts of interest were brought to the second level. At the second level, one‐sample t‐tests and F‐tests were computed. All results reported here are height‐thresholded at P = 0.05, adjusted to control for the FDR.
RESULTS
The response data showed that 71.4% of the responses were correct, the variability was rather high (SD 20.2%, range 31–100%). Thus, the hit rate was significantly higher than expected by random responses (t(18) = 8,19; P < 0.05).
EEG
The analysis of variance (ANOVA) showed a significant main effect for mental arithmetic (F(1,19) = 6.15, P = .02). At every electrode probed, theta was increased during epochs of mental arithmetic performance compared with performing the baseline task. Theta was found to have a higher magnitude at frontal electrodes compared to parietal electrodes (main factor anterior posterior electrodes F(1,19) = 42.29, P < 0.000003) and was significantly smaller at central electrodes. No interactions between the main factors were found. Contrary to theta, the alpha range between 8.0–10.5 Hz (F(1,19) = 2.85, P < = 0.11) showed no effect of mental arithmetic. Alpha was enhanced over posterior electrodes compared to anterior electrodes (main factor anterior posterior electrodes F(1,19) = 10.73, P < 0.004). Again, contrary to theta, lower alpha power was greater at the midline electrodes (F(1,19) = 19.72, P < 0.000001) compared to the lateral electrodes. Again, no interaction effects were found between the main factors. The corresponding power‐difference maps between workload and baseline for delta, theta, lower, and upper alpha are displayed in Figure 1.
Figure 1.
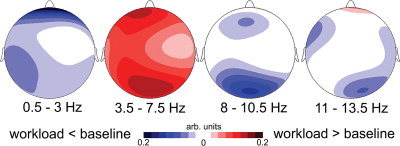
Difference maps of EEG‐power between mental arithmetic‐induced workload and a baseline task. Maps represent aggregated data for four EEG‐frequency bands in the delta range (0.5–3 Hz), the band of interest in the theta range (3.5–7.5 Hz), the lower and upper alpha bands (8–10.5 Hz; 11–13.5 Hz). Scaling is arbitrary. Red indicates increased power during workload condition in that frequency band, blue represents decreased power during workload compared to the baseline.
fMRI
The fMRI analysis (Fig. 2a) revealed a set of activated structures. The activation‐pattern included left (–32 –58 50, T = 11.74) and right (40 –42 42, T = 9.72) inferior parietal regions, left frontal superior (–18 0 56, T = 18.52), left inferior frontal regions (–30 10 26, T = 9.64), left thalamus (–12 –10 12, T = 10.08), right angular gyrus / intraparietal sulcus (34 –62 46, T = 9.26), right mid‐frontal (34 36 22, T = 8.62), and left (–6 10 48, T = 7.74) supplementary motor area (SMA). These results are height‐thresholded at P = 0.05, adjusted to control for the family‐wise error (FWE).
Figure 2.

SPMs rendered on a template's brain surface are shown for both analyses (a,b). Intensity of the red color indicates proximity of the activation to the surface. The second row shows SPMs superimposed on template brain slices to illustrate the locations of the main activations. Plane z‐coordinates are given for these plots. T‐values are color‐coded (see color bar; range 0 ≤ t ≤ 7). a: fMRI results showing activated voxels for the mental arithmetic‐induced workload condition contrasted against the reference task. Threshold for activated voxels on surface‐rendered images is t > 7.27, extent threshold for above‐threshold clusters is > 26 voxels. b: Results of the EEG‐constrained fMRI‐analysis showing voxels corresponding to theta‐occurrence, which was represented by a theta‐reference time series. Threshold for activated voxels on surface‐rendered images is t > 3.59, extent threshold for above‐threshold clusters is > 26. The software packages used to produce images were SPM and MRIcro (http://www.mricro.com).
EEG‐Constrained fMRI
The theta regressor representing the shared theta activity at the F3, Fz, F4, P3, Pz, P4 electrodes was significantly correlated with big clusters of hemodynamic activity in several parts of the brain (Fig. 2b). There was a path of activation from the precuneus over the mid‐cingulum to the anterior cingulum and the superior frontal gyrus. Clusters of activation were found in the cerebellum, the occipital lobe including bilaterally the calcarine sulcus, and the lingual gyrus and the superior occipital lobe. Another bilateral activation pattern consisted of the postcentral gyrus, rolandic operculum, insula and superior temporal gyrus, and superior temporal pole. The hippocampus on both sides was activated. The coordinates and statistics for these regions are listed in Table I.
Table I.
Activated regions in the EEG‐theta constrained fMRI analysis
| Region | Side | x | y | z | t | Z | pFWE | pFDR |
|---|---|---|---|---|---|---|---|---|
| Insula superior temporal gyrus rolandic operculum | bilateral | −46 | −2 | 4 | 6.66 | 4.73 | 0.085 | 0.005 |
| Hippocampus | right | 42 | −8 | −18 | 7.00 | 4.87 | 0.137 | 0.005 |
| Hippocampus | left | −30 | −24 | −8 | 5.03 | 3.96 | 0.728 | 0.005 |
| Cerebellum | right | 10 | −28 | −40 | 4.85 | 3.86 | 0.927 | 0.006 |
| Cerebellum | left | −42 | −48 | −32 | 6.99 | 4.86 | 0.051 | 0.005 |
| Vermis | 4 | −66 | −20 | 6.72 | 4.75 | 0.078 | 0.005 | |
| Postcentral, superior parietal | right | 24 | −42 | 64 | 6.17 | 4.52 | 0.179 | 0.005 |
| Anterior cingulum | left | −6 | 50 | 14 | 4.20 | 3.49 | 0.994 | 0.006 |
| Posterior cingulum | left | −2 | −20 | 30 | 6.05 | 4.46 | 0.213 | 0.005 |
| Superior orbital frontal | left | −20 | 56 | −4 | 6.00 | 4.44 | 0.228 | 0.005 |
| Superior frontal | right | 20 | 68 | 16 | 5.57 | 4.24 | 0.412 | 0.005 |
| Mid‐ and superior frontal | right | 38 | 60 | 14 | 4.73 | 3.80 | 0.882 | 0.005 |
| Superior medial frontal | left | −4 | 66 | 8 | 4.48 | 3.80 | 0.959 | 0.006 |
| Temporal pole, superior | left | −50 | 18 | −16 | 4.95 | 3.92 | 0.771 | 0.005 |
| Temporal pole | left | −40 | 16 | −30 | 4.81 | 3.84 | 0.843 | 0.005 |
| Inferior temporal | left | −54 | −6 | −32 | 4.46 | 3.65 | 0.963 | 0.006 |
| Superior temporal | right | 62 | −50 | 12 | 4.18 | 3.48 | 0.995 | 0.006 |
Regions of significant correlation between regional hemodynamic signal change and EEG‐theta pooled from frontal and parietal electrodes (F3, Fz, F4, P3, Pz, P4): area labels, hemisphere, Talairach coordinates, t and Z values, and corrected P values.
FEW, family‐wise error; FDR, false‐discovery rate.
Relationship between Model Variables and Theta Reference Time Series
The correlation of the theta‐regressor with the regressor, which models the block of mental addition, is practically zero (mean r′ = –0.146; range –0.226 < r < 0.117; r′ refers to Fisher's z‐transformed r). This lack of correlation could occur if, for instance, theta increased at the beginning of mental arithmetic trials and then decreased to a certain level during the remaining period of mental arithmetic performance. However, a decreased theta level after such an initial peak might still be higher during mental arithmetic than theta during baseline recording. To test for a relationship between observed theta and models of initial theta increase vs. sustained theta enhancement during entire periods of mental arithmetic, continuous wavelet transform was applied to the averaged theta reference time series. The statistical significance of wavelet power was assessed relative to the null hypothesis that the signal is generated by a stationary process with a noise background power spectrum [Grinsted et al., 2004]. Edge artifacts were ignored because long‐scale effects were not of interest. Predictions about 95% acceptance regions in the frequency time representation of theta were computed by estimating the expected effects for both an initial theta increase at the onset of mental arithmetic trials and a sustained theta increase during the entire period of performing mental arithmetic. The result is displayed in Figure 3. Most of the power can be assigned to the shorter scales, indicating theta increase at the beginning of mental arithmetic trials (overlap of gray [=predicted] and black [=observed] contour). However, there is significant power in the lower scale range as well (overlap of white [=predicted] and black [=observed] contour), relating theta activity to the full duration of mental arithmetic performance, as reflected in the conventional EEG analysis reported above.
Figure 3.

The theta reference time‐series. a: Line drawing represents the pooled theta energy from F3/Fz/F4, and P3/Pz/P4 averaged over subjects. a,b: x‐axis represents time in fMRI‐scans, white bars indicate epochs of workload by mental arithmetic induction, gray stem‐plots mark the onset of those epochs; black bars indicate trials of the reference task. b: Continuous wavelet transform of the averaged theta‐reference time series. Red indicates high, blue low wavelet power as indicated by the color bar. Black contour drawings mark the threshold of acceptance regions against noise background power spectrum at P < 0.05. Gray contour indicates predicted acceptance regions for the model of initial theta increase with the onsets of mental arithmetic performance. Analogously, white contour indicates predicted acceptance areas for the model of sustained theta enhancement during entire periods of mental arithmetic performance. Confidence intervals for edge effects were omitted.
Comparison of Anterior with Posterior Theta
Anterior and posterior theta are highly correlated. The correlation between anterior and posterior energy in the theta‐band was r′ = 0.86 (range 0.33 < r < 0.89). Effects of correlated regressors cannot be separated within the GLM. To investigate if there was an effect of theta beyond the activity related to the frontal electrodes, the posterior theta regressor was orthogonalized on the anterior theta regressor. However, GLM analysis of that model did not reveal additional effects.
DISCUSSION
In this study, EEG‐theta was enhanced by mental addition‐induced workload. EEG and fMRI were recorded simultaneously. Each recording modality was analyzed separately with respect to the experimental design variables, i.e., epochs of mental addition performance were compared to the reference task. Theta‐reference time‐series were extracted from the EEG, reflecting the strength of theta occurrence during the time‐course of the experiment. These theta‐reference time‐series were introduced into EEG‐constrained fMRI analysis. Although theta‐EEG is known to become more prominent during increased workload, theta‐waves can spontaneously arise in the ongoing EEG, corresponding with, e.g., explicit memory access, stimulus encoding, or retrieval [Klimesch, 1999]. Therefore, the purpose of this study was to investigate hemodynamic response patterns in relation to experimentally induced workload as well as to increased theta. For workload induction, subjects were asked to perform computations mentally. Subjects solved about two‐thirds of the trials, indicating an intermediate difficulty of the task.
EEG
The EEG results demonstrate that increased theta during mental arithmetic‐induced workload could be measured as intended. Although a widespread increase in theta was observed during mental arithmetic performance, a higher theta magnitude was found over frontal sites. There was only a tendency toward decreased lower alpha power at posterior leads. As reported in the literature, a theta increase during working memory performance can be accompanied by reduced power in the lower alpha band [for a review, see Klimesch, 1999]. Both the lack of a significant effect of mental arithmetic condition on alpha and the differences in topography of theta (anterior) and alpha (posterior) suggest that theta and alpha represented basically uncorrelated processes during performance of the working memory task used in this investigation. In addition, there might be other processes in the EEG associated with working memory. Frontal gamma band activity during short‐term memory tasks was observed, and coherence was increased between putative sensory storage regions and prefrontal networks [Kaiser and Lutzenberger, 2005]. However, there were different dominant frequencies within the gamma range probably related to cortico‐cortical integration. Whether gamma band activity, theta, or other frequency bands are functionally related remains to be investigated. Alternatively, it has been argued that brain oscillations are associated with whole‐brain activity because memory and all brain functions are inseparable and are acting as a whole in the whole brain [Basar, 2005].
fMRI
In previous studies on mental arithmetic, subjects activated parietal, prefrontal, and cingulate areas when asked to compute mentally. Dehaene et al. [2004] proposed a model of number processing where activation in the horizontal part of the intraparietal sulcus varied as a function of the number of operands; the inferior frontal gyrus was activated depending on time pressure induced by the task; the angular gyrus was involved in language aspects of mental arithmetic.
The current fMRI findings are in accord with this framework. SPMs for the contrast between mental arithmetic and reference task performance showed activation in prefrontal and parietal areas, which corresponds to a typical working memory pattern. Predominantly, the dorsolateral prefrontal cortex (DLPFC) and angular gyrus were activated. In addition, inferior frontal areas, the SMA, inferior parietal areas, superior frontal, and thalamic areas revealed an effect of arithmetic‐induced workload. It is generally accepted that the DLPFC supports working memory operations, which in turn are required for mental computation, i.e., for holding numbers in memory and for strategic manipulations of them. Superior frontal activations have frequently been reported with working memory tasks, e.g., in contrasts modeling variations of load in verbal, numeric, or even spatial tasks [Cabeza and Nyberg, 2000]. The angular gyrus and inferior frontal areas are typically activated in mental arithmetic. Specifically, the functional significance of the left angular gyrus has been associated with the verbal representation of digit processing [Dehaene et al., 2004]. Menon et al. [2000] reported a main effect of the number of operands on pre‐SMA activation. Comparing approximate with exact calculations, Dehaene et al. [1999] found greater activation in several structures, includ ing bilaterally the inferior parietal lobule during approximate calculation, which was thought to involve less linguistic processing. Thalamus activation was observed in studies of mental arithmetic processing [Cowell et al., 2000; Kong et al., 2005]. Of note, previous studies on the role of the thalamus reported an association between alpha and thalamic activity [Laufs et al., 2003a]. The relationship between theta and alpha activity [Klimesch, 1999] may help explain the appearance of both EEG‐theta and thalamus activation.
Thus, the experimental design of this study provided reliable effects in both EEG and fMRI, which is a precondition for investigating the functional significance and relationship of signals from different modalities. The results of the fMRI analysis revealed the activation of a comprehensive network, indicating general working memory operations, including areas that are known to be sensitive to number processing.
EEG‐Constrained fMRI Analysis
Conducting an EEG‐constrained fMRI analysis was central to the present study. In the EEG‐constrained fMRI analysis we used a theta‐reference time series as regressor in the GLM. There was no simple point biserial correlation between the design variable representing mental arithmetic performance and the theta‐reference time series. Time‐frequency decomposition of theta time course revealed both long‐scale activity due to theta being increased during mental arithmetic performance and short‐scale activity representing initial peaks at the beginning of mental arithmetic trials. It is suggested that the latter activity substantially attenuated the correlation in the time domain between theta and experimental design variables. This probably reflects that the system was challenged by the appearance of an upcoming task by initiating encoding and memory access. The breakdown of correlation between the experimental design variables and the theta‐reference time series indicates that theta reflects a subset of processes during mental arithmetic‐induced working memory activity. This permits taking advantage of an EEG‐constrained fMRI analysis. The functional relationship between theta activity and hemodynamic activation can be investigated apart from effects associated with block design fMRI analysis, contrasting the experimental task against a reference condition.
In fact, the SPM revealed a substantially different pattern from that of the workload block‐design‐oriented analysis. Based on hemodynamic activation patterns, cognitive processes represented by block‐design fMRI analysis and theta time course are different.
Hippocampus and temporal lobes
The observed initial theta increase at the beginning of nearly every task could represent encoding of the displayed stimulus and episodic memory access when actual task requirements are compared with the instruction. Theta associated with encoding and episodic memory access has been attributed to hippocampal function [Klimesch, 1999]. This is in agreement with our findings. Bilateral hippocampus activation correlated with the theta‐reference time series relating hippocampal activation to increased theta. The biggest cluster of theta‐related activation included the insula and the superior parts of the temporal cortex. It is a well‐studied effect that cognitive strain has an effect on heart rate variability. Spectral heart rate variability in the 0.1 Hz band is reduced under conditions of cognitive strain. Indeed, in the current study the 0.1 Hz component of the spectral heart rate variability was significantly reduced under the condition of mental arithmetic performance (t = –3.3, degrees of freedom (df) = 18, P < 0.002; one subject was excluded from the HRV computation due to difficulties with the reconstruction of reliable interbeat intervals from the ECG channel). The insular cortex (as well as medial‐prefrontal, anterior cingulate cortices, amygdala, hippocampus, and the cerebellum) [Gianaros et al., 2004]) is involved in autonomic regulation [Kimmerly et al., 2005] and may indicate a (stress) response to workload. Pizzagalli et al. [2003] also found glucose metabolism (PET) to correlate with theta current density mapping (low‐resolution electromagnetic tomography, LORETA) in the right superior and middle temporal gyrus.
Cingulate gyrus
In the present study we found a set of more or less connected clusters correlating with theta—from anterior to posterior cingulate gyrus and even spreading to precuneus. Gevins et al. [1997] reported an increased amplitude of frontal midline theta with increased memory load using a task that required comparison of each stimulus to a preceding one regarding verbal or spatial attributes. Dipole models localized the source to the anterior cingulate cortex. Pizzagalli et al. [2003] found a correlation between theta (EEG) and cerebral glucose metabolism (PET) in the anterior cingulate cortex. Ishii et al. [1999] found possible sources of midline theta (Fm‐theta) in the magnetoencephalography (MEG) signals over the bilateral medial prefrontal regions and anterior cingulate cortex. Interestingly, theta is reduced during anticipation of an imperative stimulus compared to selective attention prior to the warning stimulus [Gomez et al., 2004]. However, Gomez et al. [2004] argue that reduced power spectral density in scalp recordings can be caused by both reduced source voltages and cortical desynchronization, the latter resulting in reduced amplitudes of the averaged waveforms because the spectral components were not in phase. The anterior cingulate cortex is also strongly associated with the occurrence of error‐related negativity, which in turn is linked to monitoring processes during task performance. Theta‐band portions of error‐related negativity have been successfully modeled by two equivalent dipole sources, one in the anterior cingulate cortex and the other in the posterior cingulate cortex [Luu et al., 2004]. The middle and posterior cingulate gyrus are often involved in typical prefrontal tasks, like the Wisconsin Card Sorting Test or the Tower of London task requiring intensive task monitoring. Thus, theta activity is also associated with self‐monitoring during task performance and to activity of the cingulate gyrus.
Cerebellar activation
We also found clusters of activated voxels associated with EEG‐theta in the cerebellum. In previous studies, effects of cerebellar function were found in workload tasks, especially in n‐back tasks involving verbal or numeric stimulation or problem solving [Cabeza and Nyberg, 2000]. Cairo et al. [2004] found activations in the cerebellum for encoding and retrieval in subjects performing a Sternberg memory scanning task. Sternberg‐type tasks are often used to induce different amounts of workload. There is good evidence for a relationship between theta and cerebellar activity on the level of neuronal assemblies. Theta‐frequency bursting and resonance in cerebellar granule cells has, for example, been found to play a role in synchronization, rhythmics, and learning [D'Angelo et al., 2001]. However, it remains questionable if cerebellar theta contributes to surface recorded fronto‐parietal theta.
Frontal lobes
Similar to the fMRI analysis on workload blocks, EEG‐theta‐associated activations were found in frontal superior areas. The frontal superior region supports working memory processes, which are required for mental computation, i.e., for holding numbers in memory and for strategic manipulations of them. Regarding mental calculation, Delazer et al. [2003, 2004] found the superior frontal gyrus more activated during untrained multiplications than during number matching. This emphasizes the above‐mentioned load sensitivity of the frontal superior region.
Relation to default mode network
fMRI analysis typically assesses task‐dependent increases in hemodynamic activity by subtracting a reference or resting state from an activated state. However, decreases of activity during task performance can consistently be observed with a broad range of cognitive tasks. A default network mode of brain activity has been proposed, consisting of brain regions having a high metabolism during rest. This default mode network mainly includes medial frontal, medial parietal, and posterior cingulate cortex [reviewed in Gusnard and Raichle, 2001; Greicius et al., 2003]. We found some of these regions to be associated with theta band activity.
A correlation between resting state activation and EEG was found in a combined EEG‐fMRI study [Laufs et al., 2003b]. EEG‐alpha at closed‐eyes rest was negatively correlated with attention‐related areas. EEG‐beta activity was positively correlated with activation in the default mode network. However, no association between theta and default mode activity has been reported so far.
With working memory tasks, increased deactivation was found in areas associated with the default mode network [McKiernan et al., 2003; Rombouts et al., 2005]. These deactivations have been suggested to represent reallocation of processing resources in preparation to active task performance [McKiernan et al., 2003]. The amount of deactivation during a task is dependent on the amount of attention the task requires and on the amount of activity present during the resting state [Rombouts et al., 2005]. Furthermore, medial, parietal, and posterior cingulate areas may have distinct time courses. Investigating semantic classification vs. resting, lateral parietal areas showed a time course inverse like that often found for positive activations, with a decrease at the onset of the active task that was maintained through its duration. In contrast, the same regions showed an initial increase in activation that quickly reversed to below‐baseline levels [Lustig et al., 2003]. Thus, working memory‐related frontal theta is possibly associated with those dynamic changes in cingulate cortex, indicating resource management in preparation for requirements of active task performance. However, such an interpretation is speculative and needs further evaluation.
CONCLUSION
Block‐design fMRI analysis of mental arithmetic performance predominantly showed activation in the DLPFC and angular gyrus. Together with activation in inferior frontal areas, the SMA, inferior parietal areas, superior frontal, and thalamic areas, this activation pattern is suggested to represent a state of arithmetic‐induced workload. However, EEG‐constrained fMRI analysis revealed a different pattern, indicating that theta increase is associated with temporal and hippocampal hemodynamic activation, widespread cingulate activation, frontal superior, and cerebellar activation. Although this pattern is theta‐specific by definition, it cannot be argued that theta can be easily attributed to a few distinct structures of the brain. Based on the data in this study, surface‐recorded theta under workload conditions represents a functional brain state associated with a set of processes required by workload‐induced tasks. The corresponding network indicated by theta‐correlated fMRI represents both basic task performance processes and cortical areas required for the specific task. The results provide further evidence for what Klimesch [1999] suggested for theta band EEG. Hippocampal‐cortical networks emerge theta band oscillations representing a binding process of widely distributed cortical assemblies. This binding process may form the source of surface‐recorded EEG theta.
REFERENCES
- Alexander GE, Moeller JR ( 1994): Application of the scaled subprofile model to functional imaging in neuropsychiatric disorders: a principal component approach to modeling brain function in disease. Hum Brain Mapp 2: 79–94. [Google Scholar]
- Allen JP, Polizzi G, Krakow K, Fish DR, Lemieux L ( 1998): Identification of EEG events in the MR scanner: the problem of pulse artifact and a method for its subtraction. Neuroimage 8: 229–239. [DOI] [PubMed] [Google Scholar]
- Allen JP, Josephs O, Turner R ( 2000): A method for removing imaging artifact from continuous EEG recorded during functional MRI. Neuroimage 12: 230–239. [DOI] [PubMed] [Google Scholar]
- Basar E ( 2005): Memory as the “whole brain work”: a large‐scale model based on “oscillations in super‐synergy.” Int J Psychophysiol 58: 199–226. [DOI] [PubMed] [Google Scholar]
- Cabeza R, Nyberg L ( 2000): Imaging cognition. II. An empirical review of 275 PET and fMRI studies. J Cogn Neurosci 12: 1–47. [DOI] [PubMed] [Google Scholar]
- Cairo TA, Liddle PF, Woodward TS, Ngana ETC ( 2004): The influence of working memory load on phase specific patterns of cortical activity. Cogn Brain Res 21: 377–387. [DOI] [PubMed] [Google Scholar]
- Courtney SM, Ungerleider LG, Keil K, Haxby JV ( 1996): Object and spatial visual working memory activate separate neural systems in human cortex. Cereb Cortex 6: 39–49. [DOI] [PubMed] [Google Scholar]
- Cowell SF, Egan GF, Code C, Harasty J, Watson JD ( 2000): The functional neuroanatomy of simple calculation and number repetition: a parametric PET activation study. Neuroimage 12: 565–573. [DOI] [PubMed] [Google Scholar]
- D'Angelo E, Nieus T, Maffei A, Armano S, Rossi P, Taglietti V, Fontana A, Naldi G ( 2001): Theta‐frequency bursting and resonance in cerebellar granule cells: experimental evidence and modeling of a slow K1‐dependent mechanism. J Neurosci 21: 759–770. [DOI] [PMC free article] [PubMed] [Google Scholar]
- Dehaene S, Spelke E, Pinel P, Stanescu R, Tsivkin S ( 1999): Sources of mathematical thinking: behavioral and brain‐imaging evidence. Science 970: 284. [DOI] [PubMed] [Google Scholar]
- Dehaene S, Molko N, Cohen L, Wilson AJ ( 2004): Arithmetic and the brain. Curr Opin Neurobiol 14: 218–224. [DOI] [PubMed] [Google Scholar]
- Delazer M, Domahs F, Bartha L, Brenneis C, Lochy A, Trieb T, Benke T ( 2003): Learning complex arithmetic — an fMRI study. Cogn Brain Res 18: 76–88. [DOI] [PubMed] [Google Scholar]
- Delazer M, Domahs F, Lochy A, Karner E, Benke T, Poewe W ( 2004): Number processing and basal ganglia dysfunction: a single case study. Neuropsychologia 42: 1050–1062. [DOI] [PubMed] [Google Scholar]
- Friston KJ ( 1994): Functional and effective connectivity in neuroimaging: a synthesis. Hum Brain Mapp 2: 56–78. [Google Scholar]
- George MS, Bohning DE ( 2002): Measuring brain connectivity with functional imaging and transcranial magnetic stimulation In: Kenneth LD, Charney D, Coyle JT, Nemeroff Ch, editors. Neuropsychopharmacology: the fifth generation of progress. Nashville, TN: American College of Neuropsychopharmacology; p 339–410. [Google Scholar]
- Gevins AS, Zeitlin GM, Yingling CD, Doyle JC, Dedon MF, Schaffer RE, Roumasset JT, Yeager CL ( 1979a): EEG patterns during ‘cognitive’ tasks. I. Methodology and analysis of complex behaviors. Electroenceph Clin Neurophysiol 47: 693–703. [DOI] [PubMed] [Google Scholar]
- Gevins AS, Zeitlin GM, Doyle JC, Schaffer RE, Callaway E ( 1979b): EEG patterns during ‘cognitive’ tasks. II. Analysis of controlled tasks. Electroenceph Clin Neurophysiol 47: 704–710. [DOI] [PubMed] [Google Scholar]
- Gevins AS, Zeitlin GM, Doyle JC, Yingling CD, Schaffer RE, Callaway E, Yeager CL ( 1979c): Electroencephalogram correlates of higher cortical functions. Science 16:203: 665–668. [DOI] [PubMed] [Google Scholar]
- Gevins A, Smith ME, McEvoy L, Yu D ( 1997): High‐resolution EEG mapping of cortical activation related to working memory: effects of task difficulty, type of processing, and practice. Cereb Cortex 7: 374–385. [DOI] [PubMed] [Google Scholar]
- Gianaros PJ, Van Der Veen FM, Jennings JR ( 2004): Regional cerebral blood flow correlates with heart period and high‐frequency heart period variability during working‐memory tasks: implications for the cortical and subcortical regulation of cardiac autonomic activity. Psychophysiology 41: 521–530. [DOI] [PMC free article] [PubMed] [Google Scholar]
- Gomez CM, Vaquero E, Lopez‐Mendoza D, Gonzalez‐Rosa J, Vazquez‐Marrufo M ( 2004): Reduction of EEG power during expectancy periods in humans. Acta Neurobiol Exp 64: 143–151. [DOI] [PubMed] [Google Scholar]
- Greicius MD, Krasnow B, Reiss AL, Menon V ( 2003): Functional connectivity in the resting brain: a network analysis of the default mode hypothesis. Proc Natl Acad Sci U S A 100: 253–258. [DOI] [PMC free article] [PubMed] [Google Scholar]
- Grinsted A, Moore JC, Jevrejeva S ( 2004): Application of the cross wavelet transform and wavelet coherence to geophysical time series. Nonlinear Processes Geophys 11: 561–566. [Google Scholar]
- Gundel A, Wilson GF ( 1992): Topographical changes in the ongoing EEG related to the difficulty of mental task. Brain Topogr 5: 17–25. [DOI] [PubMed] [Google Scholar]
- Gusnard DA, Raichle ME ( 2001): Searching for a baseline: functional imaging and the resting human brain. Nat Rev Neurosci 2: 685–694. [DOI] [PubMed] [Google Scholar]
- Hitch GJ ( 1978): The role of short‐term working memory in mental arithmetic. Cogn Psychol 10: 302–323. [Google Scholar]
- Hoffmann A, Jäger L, Werhahn KJ, Jaschke M, Noachtar S, Reiser M ( 2000): Electroencephalography during functional echo‐planar imaging: detection of epileptic spikes using post‐processing methods. Magn Reson Med 44: 791–798. [DOI] [PubMed] [Google Scholar]
- Ishihara T, Yoshii N ( 1972): Multivariate analytic study of EEG and mental activity in juvenile delinquents. Electroenceph Clin Neurophysiol 33: 71–80. [DOI] [PubMed] [Google Scholar]
- Ishii R, Shinosaki K, Ukai S, Inouye T, Ishihara T, Yoshimine T, Hirabuki N, Asada H, Kihara T, Robinson SE, Takeda M ( 1999): Medial prefrontal cortex generates frontal midline theta rhythm. Neuroreport 10: 675–679. [DOI] [PubMed] [Google Scholar]
- Jensen O, Tesche CD ( 2002): Frontal theta activity in humans increases with memory load in a working memory task. Eur J Neurosci 15: 1395–1399. [DOI] [PubMed] [Google Scholar]
- Jonides J, Smith EE, Koeppe RA, Awh E, Minoshima S, Mintun MA ( 1993): Spatial working memory in humans as revealed by PET. Nature 363: 623–625. [DOI] [PubMed] [Google Scholar]
- Kaiser J, Lutzenberger W ( 2005): Cortical oscillatory activity and the dynamics of auditory memory processing. Rev Neurosci 16: 239–254. [DOI] [PubMed] [Google Scholar]
- Kawashima R, Taira M, Okita K, Inoue K, Tajima N, Yoshida H, Sasaki T, Sugiura M, Watanabe J, Fukuda H ( 2004): A functional MRI study of simple arithmetic—a comparison between children and adults. Cogn Brain Res 18: 225–231. [DOI] [PubMed] [Google Scholar]
- Kimmerly DS, O'leary DD, Menon RS, Gati JS, Shoemaker JK ( 2005): Cortical regions associated with autonomic cardiovascular regulation during lower body negative pressure in humans. J Physiol 569: 331–345. [DOI] [PMC free article] [PubMed] [Google Scholar]
- Klimesch W ( 1996): Memory processes, brain oscillations and EEG synchronization. Int J Psychophysiol 24: 61–100. [DOI] [PubMed] [Google Scholar]
- Klimesch W ( 1997): EEG‐alpha rhythms and memory processes. Int J Psychophysiol 26: 319–340. [DOI] [PubMed] [Google Scholar]
- Klimesch W ( 1999): EEG alpha and theta oscillations reflect cognitive and memory performance: a review and analysis. Brain Res Brain Res Rev 29: 169–195. [DOI] [PubMed] [Google Scholar]
- Klimesch W, Schack B, Sauseng P ( 2005): The functional significance of theta and upper alpha oscillations. Exp Psychol 52: 99–108. [DOI] [PubMed] [Google Scholar]
- Kondo H, Morishita M, Osaka N, Osaka M, Fukuyama H, Shibasakic H ( 2004): Functional roles of the cingulo‐frontal network in performance on working memory. Neuroimage 21: 2–14. [DOI] [PubMed] [Google Scholar]
- Kong J, Wang C, Kwong K, Vangel M, Chua E, Gollub R ( 2005): The neural substrate of arithmetic operations and procedure complexity. Cogn Brain Res 22: 397–405. [DOI] [PubMed] [Google Scholar]
- Laufs H, Kleinschmidt A, Beyerle A, Eger E, Salek‐Haddadi A, Preibisch C, Krakow K ( 2003a): EEG‐correlated fMRI of human alpha activity. Neuroimage 19: 1463–1476. [DOI] [PubMed] [Google Scholar]
- Laufs H, Krakow K, Sterzer P, Eger E, Beyerle A, Salek‐Haddadi A, Kleinschmidt A ( 2003b): Electroencephalographic signatures of attentional and cognitive default modes in spontaneous brain activity fluctuations at rest. Proc Natl Acad Sci U S A 100: 11053–11058. [DOI] [PMC free article] [PubMed] [Google Scholar]
- Lemieux L, Salek‐Haddadi A, Josephs O, Allen P, Toms N, Scott C, Krakow K, Turner R, Fish DR ( 2001): Event‐related fMRI with simultaneous and continuous EEG: description of the method and initial case report. Neuroimage 14: 780–787. [DOI] [PubMed] [Google Scholar]
- Lopes da Silva F ( 1991): Neural mechanisms underlying brain waves: from neural membranes to networks. Electroenceph Clin Neurophysiol 79: 81–93. [DOI] [PubMed] [Google Scholar]
- Lustig C, Snyder AZ, Bhakta M, O'Brien KC, McAvoy M, Raichle ME, Morris JC, Buckner RL ( 2003): Functional deactivations: change with age and dementia of the Alzheimer type. Proc Natl Acad Sci U S A 100: 14504–14509. [DOI] [PMC free article] [PubMed] [Google Scholar]
- Luu P, Tucker DM, Makeig S ( 2004): Frontal midline theta and the error‐related negativity: neurophysiological mechanisms of action regulation. Clin Neurophysiol 115: 1821–1835. [DOI] [PubMed] [Google Scholar]
- McCarthy G, Blamire AM, Puce A, Nobre AC, Bloch G, Hyder F, Goldman‐Rakic P, Shulman RG ( 1994): Functional magnetic resonance imaging of human prefrontal cortex activation during a spatial working‐memory task. Proc Natl Acad Sci U S A 91: 8690–8694. [DOI] [PMC free article] [PubMed] [Google Scholar]
- McKiernan KA, Kaufman JN, Kucera‐Thompson J, Binder JR ( 2003): A parametric manipulation of factors affecting task‐induced deactivation in functional neuroimaging. J Cogn Neurosci 15: 394–408. [DOI] [PubMed] [Google Scholar]
- Mecklinger A, Kramer AF, Strayer DL ( 1992): Event related potentials and EEG components in a semantic memory search task. Psychophysiology 29: 104–119. [DOI] [PubMed] [Google Scholar]
- Menon V, Rivera SM, White CD, Glover GH, Reiss AL ( 2000): Dissociating prefrontal and parietal cortex activation during arithmetic processing. Neuroimage 12: 357–365. [DOI] [PubMed] [Google Scholar]
- Miyata Y, Tanaka Y, Hono T ( 1990): Long term observation on Fm‐theta during mental effort. Neuroscience 16: 145–148. [Google Scholar]
- Oldfield RC ( 1971): The assessment and analysis of handedness: the Edinburgh inventory. Neuropsychologia 9: 97–113. [DOI] [PubMed] [Google Scholar]
- Onton J, Delorme A, Makeig S ( 2005): Frontal midline EEG dynamics during working memory. Neuroimage 27: 341–356. [DOI] [PubMed] [Google Scholar]
- Owen AM, Doyon J, Petrides M, Evans AC ( 1996): Planning and spatial working memory: a positron emission tomography study in humans. Eur J Neurosci 8: 353–364. [DOI] [PubMed] [Google Scholar]
- Paulesu E, Frith CD, Frackowiak RSJ ( 1993): The neural correlates of the verbal component of working memory. Nature 362: 342–345. [DOI] [PubMed] [Google Scholar]
- Pizzagalli DA, Oakes TR, Davidson RJ ( 2003): Coupling of theta activity and glucose metabolism in human rostral anterior cingulate cortex: an EEG/PET study of normal and depressed subjects. Psychophysiology 40: 939–949. [DOI] [PubMed] [Google Scholar]
- Raghavachari S, Kahana MJ, Rizzuto DS, Caplan JB, Kirschen MP, Bourgeois B, Madsen JR, Lisman JE ( 2001): Gating of human theta oscillations by a working memory task. J Neurosci 21: 3175–3183. [DOI] [PMC free article] [PubMed] [Google Scholar]
- Rombouts SA, Barkhof F, Goekoop R, Stam CJ, Scheltens P ( 2005): Altered resting state networks in mild cognitive impairment and mild Alzheimer's disease: an fMRI study. Hum Brain Mapp 26: 231–239. [DOI] [PMC free article] [PubMed] [Google Scholar]
- Rugg MD, Dickens AM ( 1982): Dissociation of theta and alpha activity as a function of verbal and visuo‐spatial tasks. Electroenceph Clin Neurophysiol 53: 201–207. [DOI] [PubMed] [Google Scholar]
- Salek‐Haddadi A, Merschhemke M, Lemieux L, Fish DR ( 2002): Simultaneous EEG‐correlated ictal fMRI. Neuroimage 16: 32–40. [DOI] [PubMed] [Google Scholar]
- Sammer G, Blecker C, Gebhardt H, Kirsch P, Stark R, Vaitl D ( 2005): Acquisition of typical EEG waveforms during fMRI: SSVEP, LRP, and frontal theta. Neuroimage 24: 1012–1024. [DOI] [PubMed] [Google Scholar]
- Sarnthein J, Petsche H, Rappelsberger P, Shaw GL, von Stein A ( 1998): Synchronization between prefrontal and posterior association cortex during human working memory. Proc Natl Acad Sci U S A 95: 7092–6. [DOI] [PMC free article] [PubMed] [Google Scholar]
- Sauseng P, Klimesch W, Gruber W, Doppelmayr M, Stadler W, Schabus M ( 2002): The interplay between theta and alpha oscillations in the human electroencephalogram reflects the transfer of information between memory systems. Neurosci Lett 324: 121–124. [DOI] [PubMed] [Google Scholar]
- Smith EE, Jonides J, Koeppe RA, Awh E, Schumacher E, Minoshima S ( 1995): Spatial vs. object‐working memory: PET investigations. J Cogn Neurosci 7: 337–356. [DOI] [PubMed] [Google Scholar]
- Smith EE, Jonides J, Koeppe RA ( 1996): Dissociating verbal and spatial working memory using PET. Cereb Cortex 6: 11–20 [erratum Cereb Cortex 1998 8:762]. [DOI] [PubMed] [Google Scholar]
- Sterman MB, Mann CA, Kaiser DA, Suyenobu BY ( 1994): Multiband topographic analysis of a simulated visuomotor aviation task. Int J Psychophysiol 16: 49–56. [DOI] [PubMed] [Google Scholar]
- Yamamoto S, Matsuoka S ( 1990): Topographic EEG study of visual display terminal VDT performance with special reference to frontal midline theta waves. Brain Topogr 2: 257–267. [DOI] [PubMed] [Google Scholar]