

Abstract
The capacity to voluntarily regulate emotions is critical for mental health, especially when coping with aversive events. Several neuroimaging studies of emotion regulation found the amygdala to be a target for downregulation and prefrontal regions to be associated with downregulation. To characterize the role of prefrontal regions in bidirectional emotion regulation and to investigate regulatory influences on amygdala activity and peripheral physiological measures, a functional magnetic resonance imaging (fMRI) study with simultaneous recording of self‐report, startle eyeblink, and skin conductance responses was carried out. Subjects viewed threat‐related pictures and were asked to up‐ and downregulate their emotional responses using reappraisal strategies. While startle eyeblink responses (in successful regulators) and skin conductance responses were amplified during upregulation, but showed no consistent effect during downregulation, amygdala activity was increased and decreased according to the regulation instructions. Trial‐by‐trial ratings of regulation success correlated positively with activity in amygdala during upregulation and orbitofrontal cortex during downregulation. Downregulation was characterized by left‐hemispheric activation peaks in anterior cingulate cortex, dorsolateral prefrontal cortex, and orbitofrontal cortex and upregulation was characterized by a pattern of prefrontal activation not restricted to the left hemisphere. Further analyses showed significant overlap of prefrontal activation across both regulation conditions, possibly reflecting cognitive processes underlying both up‐ and downregulation, but also showed distinct activations in each condition. The present study demonstrates that amygdala responses to threat‐related stimuli can be controlled through the use of cognitive strategies depending on recruitment of prefrontal areas, thereby changing the subject's affective state. Hum Brain Mapp, 2007. © 2006 Wiley‐Liss, Inc.
Keywords: emotion, cognitive control, amygdala, prefrontal cortex, fMRI
INTRODUCTION
Emotions can be regarded as short episodes of coordinated brain, behavioral, and autonomic changes serving to advance appropriate responses to internal or external salient stimuli [Davidson et al., 2003]. A fundamental aspect of personal well‐being and successful social interaction is that emotions are not always expressed to their fullest extent but are controlled purposefully in a context‐dependent manner [Gross, 2002]. This control (decreasing, maintaining, or increasing) of positive and negative emotional reactions is termed emotion regulation [Gross, 2002].
One of the cortical, limbic, and paralimbic regions that have been implicated in emotional processing is the amygdala [Phan et al., 2002], a structure in the anteromedial temporal lobe. It is involved in a wide variety of aversive emotional processes, and has recently been shown to respond to appetitive stimuli as well [Anderson et al., 2003; Hamann et al., 2002]. Most consistently, however, the amygdala has been implicated in responding to threatening stimuli and in general fear processing [Bishop et al., 2004b; Büchel et al., 1998; Dolan et al., 2001; Halgren et al., 1978; LeDoux, 2000; Morris et al., 1996; for meta‐analytic results, see Murphy et al., 2003; Phan et al., 2002]. Functional magnetic resonance imaging (fMRI) studies have shown that the amygdala is sensitive to voluntary regulation in that its activity is decreased during the suppression of sexual arousal [Beauregard et al., 2001], sadness [Levesque et al., 2003], and negative affect [Ochsner et al., 2002, 2004; Phan et al., 2005], while its activity is increased during self‐generated sadness [Posse et al., 2003] and the voluntary maintenance [Schaefer et al., 2002] and increase [Ochsner et al., 2004] of negative affect.
Top‐down processes that exert inhibitory control over emotion‐related amygdala activity are thought to be located in areas of the prefrontal cortex [Davidson et al., 2000], which are involved in functions of cognitive control such as working‐memory, conflict‐detection, and interference resolution [Badre and Wagner, 2004; Bunge et al., 2001]. This has been corroborated by studies showing that the decrease in amygdala activation concurs with increased activation in prefrontal areas such as the anterior cingulate cortex [ACC; Beauregard et al., 2001; Phan et al., 2005], the dorsolateral prefrontal cortex [DLPFC; Levesque et al., 2003; Ochsner et al., 2002], and the orbitofrontal cortex [OFC; Levesque et al., 2003; Ochsner et al., 2004]. It has been suggested that the increased amygdala activity observed in various psychiatric disorders, such as social phobia [Birbaumer et al., 1998] and depression [Drevets et al., 1992], could be due to a dysfunction of inhibitory control mechanisms in prefrontal cortex [Yamasue et al., 2004]. However, prefrontal regions do not only have an inhibitory but also an excitatory influence on various neural networks [Knight et al., 1999], in that prefrontally mediated cognitive control can inhibit augment or reactions in order to achieve successful goal‐directed behavior [Miller, 2000].
Previous fMRI studies have significantly furthered insight into the neural basis of emotion regulation. Yet, with the exception of Ochsner et al. [ 2004], who studied the effects of up‐ and downregulating negative affect on brain activity, and Kalisch et al. [ 2005], who investigated the effects of anxiety reduction on brain activity and peripheral physiological measures, these studies mostly focused on the downregulation of emotion and did not asses behavioral and autonomic changes. However, processes of up‐ as well as downregulating emotions may be dysfunctional in many psychiatric disorders and can lead to alterations on multiple levels. In this study we incorporated both points, in that we studied bidirectional emotion regulation through reappraisal strategies by simultaneous recording of self‐report, peripheral physiological (startle eyeblink and skin conductance response) and brain activation data (Fig. 1). Threat‐related pictures were presented to elicit an initial emotional response. A regulation instruction (increase, decrease, or view) then appeared in the center of the picture, signaling the subjects to regulate their emotional responses using reappraisal strategies [Gross, 2002] they had practiced in a training session. In increase trials subjects were to engage themselves with the depicted situation, while in decrease trials they were to distance themselves from the depicted situation. During the regulation phase an acoustic startle probe was presented and after the regulation phase subjects had to rate their success in regulation. Threat‐related pictures were chosen because they have been shown to reliably elicit emotional re sponses evidenced in neural [amygdala activity; Phan et al., 2002] and behavioral measures [fear‐potentiated startle; Balaban and Taussig, 1994]. Furthermore, the question of whether and how reactions to threat‐related stimuli can be voluntarily controlled is of importance with regard to anxiety disorders.
Figure 1.

Experimental paradigm. Pictures were presented for 2.5 s, after which the regulation instruction (increase, decrease, or view) appeared in the center of the picture for 0.5 s. From this point on subjects were to regulate their emotions for 6 s; at 2 s into the regulation phase an acoustic startle probe was delivered. After the regulation phase subjects had to rate their success in regulation on a scale from 1–5 by button presses. Before the next trial began a gray square appeared, indicating the subjects to relax. [Color figure can be viewed in the online issue, which is available at www.interscience.wiley.com.]
We predicted that the amygdala would respond to threat‐related pictures and would be sensitive to regulation, in that its activity would be decreased or increased in the respective conditions in comparison to a condition of simply viewing threat‐related pictures. The emotion induction and regulation effects should also be observable in peripheral physiological variables such as skin conductance responses [SCR; Gross, 1998], which are an indicator of autonomic arousal [Lang et al., 1993], and startle eyeblink responses [Jackson et al., 2000], which index the emotional value of the subject's affective state [Lang et al., 1990]. Furthermore, we expected a network of prefrontal regions, namely, the ACC, DLPFC, and OFC, to be involved in up‐ as well as downregulation. To characterize amygdala and prefrontal activations that are associated with regulation‐related changes in affective state, correlation analyses were carried out with self‐reported ratings of regulation success.
SUBJECTS AND METHODS
Subjects
Twenty‐four healthy right‐handed female volunteers (age: 18–28 years; mean: 23.3) participated in this study. Only female subjects were studied because we wanted to avoid confounding effects of gender differences [e.g., Kring and Gordon, 1998]. The study was approved by the Ethics Committee of the University of Tuebingen Medical School. All subjects gave written informed consent prior to participation.
Stimuli
Pictures were selected from the International Affective Picture System [IAPS; Lang et al., 1999] (see Table I for a list of the stimuli employed in this study) on the basis of normative female valence and arousal ratings to produce two sets: one neutral set (12 pictures with neutral valence and low arousal) and one negative set (36 pictures with negative valence and high arousal). The negative set was further divided into three sets (balanced for content, valence, and arousal), which resulted in four conditions depending on instruction and picture type: neutral‐view, negative‐view, negative‐increase, and negative‐decrease. fMRI sessions were balanced for conditions, picture content, valence, and arousal. A pseudo‐randomized order was created with the limitation that any condition did not occur more than three times consecutively. The presentation order of the sessions was varied and negative pictures were counterbalanced across subjects for the type of instruction.
Table I.
IAPS stimuli used in the current study
| Description | IAPS number |
|---|---|
| Neutral stimuli | |
| Lizard | 1121 |
| Cow | 1670 |
| Secretary | 2383 |
| Woman | 2514 |
| Propeller | 2575 |
| Boat | 5395 |
| Desert | 5900 |
| Card dealer | 7503 |
| Office | 7550 |
| Traffic | 7590 |
| Jet | 7620 |
| Tissue | 7950 |
| Threat‐related stimuli | |
| Snake | 1050 |
| Snake | 1052 |
| Snake | 1120 |
| Spider | 1201 |
| Spider | 1220 |
| Pit bull | 1300 |
| Mutilation | 3010 |
| Mutilation | 3061 |
| Mutilation | 3062 |
| Severed hand | 3400 |
| Electric chair | 6020 |
| Terrorist | 6213 |
| Aimed gun | 6230 |
| Aimed gun | 6243 |
| Aimed gun | 6260 |
| Knife | 6300 |
| Attack | 6350 |
| Attack | 6370 |
| Attack | 6510 |
| Gang | 6821 |
| Tank | 6940 |
| HIV tattoo | 9006 |
| Oil fires | 9120 |
| Sliced hand | 9405 |
| Corpse | 9490 |
| Injection | 9592 |
| Ship | 9600 |
| Plane crash | 9611 |
| Shipwreck | 9620 |
| Ship | 9621 |
| Jet | 9622 |
| Skinhead | 9800 |
| Auto accident | 9910 |
| Car accident | 9911 |
| Auto accident | 9920 |
| Fire | 9921 |
Stimuli are sorted according to stimulus set (neutral and threat‐related) and ordered by International Affective Picture System (IAPS) stimulus number.
While the IAPS is based on a dimensional model of emotion, Lang et al. [ 1993] showed that these pictures also elicit specific emotions, with fear being the most common of the negative emotions. We placed emphasis on selecting only pictures with threat‐related content (e.g., frightening animals, weapons, attacks) for the negative picture set in order to exclude pictures associated with other negative emotions such as disgust or sadness. To provide an additional check, we asked subjects directly after the experiment (see Experimental Paradigm, below) to indicate for each picture whether it was perceived as frightening/threatening, disgusting, or not eliciting an emotion (subjects could choose more than one label for each stimulus). Disgust was chosen as a control, because according to Lang et al. [ 1993] it is the second most common negative emotion elicited by the IAPS. The results of this additional check are shown in Figure 2: 64% of the negative pictures were rated as frightening/threatening by more than 50% of the subjects, while only 14% of the negative pictures were rated as disgusting by at least 50% of the subjects.
Figure 2.

Subjects' threat and disgust ratings. Directly after scanning, subjects viewed all previously seen pictures again and indicated for each picture whether it was perceived as frightening/threatening, disgusting, or not eliciting an emotion; 64% of the negative pictures were rated as frightening/threatening by more than 50% of the subjects, while only 14% of the negative pictures were rated as disgusting by more than 50% of the subjects.
Experimental Paradigm
Participants received a training session 1–4 days prior to the experiment to ensure that they completely understood the reappraisal strategies they were to use and to give them practice in using these strategies. Participants were asked to regulate their emotional reactions to sample pictures (different from the ones used in the actual experiment) according to single‐word instructions—view, decrease, or increase—using the following strategies. View: subjects should view the picture attentively without trying to alter their emotional reactions. Decrease: subjects should decrease their emotional reactions by distancing themselves from the picture, by becoming a detached observer through thinking that the depicted situation is not real, only a picture; subjects were told not to substitute negative emotions with positive emotions. Increase: subjects should increase their emotional reactions by engaging themselves with the situation through thinking that it is real, happens to them. Subjects did not regulate emotional responses to neutral pictures. After appropriate coaching, the training ended with completion of 16 practice trials that were similar to one experimental session.
The experimental paradigm (Fig. 1) is a modified version from Jackson et al. [ 2000]. Subjects underwent three fMRI sessions, each consisting of 16 trials. Each trial consisted of the following phases: induction, instruction, regulation, rating, and pause. Pictures (visual angle: ∼25° × 20°) were projected onto a translucent screen in front of the scanner that subjects could see through a tilted mirror mounted on the headcoil. At the beginning of each trial a picture appeared on the screen for 2.5 s. During this time subjects were to view the picture and allow their emotional reactions to occur (induction phase). The instruction (view, increase, or decrease) then appeared in the center of the picture, signaling the subjects to regulate their emotions according to the practiced strategies. Participants were told before the experiment to not close their eyes or avert them from the pictures and to view the pictures attentively the whole time, regardless of instruction type. After 500 ms the instruction was replaced with a red crosshair in the middle of the picture for the whole 6 s of the regulation phase; subjects had to fixate this crosshair to allow for startle eyeblink recordings. A startle probe (a 50 ms white noise burst, loudness adjusted individually to reliably elicit startle eyeblinks and to be unpleasant but not painful) was presented through headphones (HD 570, Sennheiser, Germany; modified after Baumgart et al. [ 1998]) at 2 s into the regulation phase. After the regulation phase, the picture was replaced for 3 s by a rating scale, on which subjects had to indicate their success in regulating their emotion (scale from 1 (not successful at all) to 5 (very successful)) by button presses. To hold motor activation comparable across trial types, subjects were asked to press the button twice in the view trials. After the rating, a gray rectangle appeared on the screen for 10–14 s, indicating that the subjects should relax. In a postscan session subjects rated the pictures shown during scanning 1) regarding their initial affective response in terms of valence and arousal on a 9‐point scale [Self‐Assessment Manikin; Bradley and Lang, 1994], and 2) whether they perceived each picture as frightening/threatening, disgusting, or not eliciting an emotion. Additionally, they filled out a strategy questionnaire in which they had to rate their overall regulatory success (scale from 1–5) in increasing and decreasing and to describe the strategies they employed for emotion regulation.
As used here, in‐scan success ratings can also be conceptualized as “affect change scores,” since subjects were instructed to give a high success rating only when they managed to modify the initial emotional reaction elicited by the picture, i.e., subjects had to think of their initial emotional reaction as a baseline in relation to which they had to judge their regulatory success. We did not record self‐reported affect at the end of each trial since self‐reports of affect during scanning likely reflect 1) the affect elicited by the picture, and 2) the success in regulating this affect and thus preclude any statements about the effectiveness of regulation for a specific trial. Using affect ratings is feasible if a mean over all trial‐by‐trial ratings is calculated [Ochsner et al., 2004] or if only one rating is given for a blocked presentation of several images [Phan et al., 2005], thereby ruling out effects of a single picture, but it is not feasible in a study such as this, where ratings are used as covariates for trial‐by‐trial correlation analysis with fMRI data.
Data Acquisition
Whole‐brain fMRI data were acquired using a 1.5 T scanner (Magnetom Sonata, Siemens, Erlangen, Germany) equipped with a standard headcoil. Functional T2*‐weighted images were acquired in coronal orientation using echo‐planar imaging (EPI) with a repetition time (TR) of 4 s (field of view (FOV) = 192 mm, matrix = 64 × 64, flip angle = 90°, echo time (TE) = 45 ms). Each functional volume comprised 44 slices (thickness: 3 mm, 0.5 mm gap). The first 5 of 101 volumes of each session were discarded prior to image analysis to suppress T1 saturation effects. The intertrial interval (mean: 24 s) was varied in 2‐s steps between 22–26 s. High‐resolution anatomical T1‐weighted images (MPRAGE, voxel size: 1 × 1 × 1 mm3) of each subject were acquired after functional imaging. Additionally, peripheral physiological responses were acquired during scanning: 1) startle eyeblink data were recorded at 1000 Hz from the subjects' right eye using infrared oculography (IOG)‐based fMRI compatible equipment (eyetracker, Cambridge Research Systems, Cambridge, UK) [Anders et al., 2004a], and 2) skin conductance responses (SCR) were recorded at 16 Hz with fMRI‐compatible equipment (Varioport, Becker Meditec, Karlsruhe, Germany) using standard Ag/AgCl electrodes filled with unibase electrolyte affixed to the thenar and hypothenar of the left hand.
Self‐Report and Physiological Data Analysis
Post‐scan ratings of valence and arousal were analyzed for differences between the neutral and negative picture set with paired t‐tests over subjects' mean ratings of valence and arousal for each set. From one subject no post‐scan ratings of valence and arousal could be obtained. Paired t‐tests were also used to assess differences between decrease‐ and increase‐scores in the in‐scan (i.e., during scanning) and post‐scan (i.e., after scanning) success ratings, respectively. SCR and startle data analysis was performed with custom‐made scripts using Matlab 6.5 (MathWorks, Natick, MA). SCR data were smoothed with a 200‐ms (full‐width at half‐maximum, FWHM) Gaussian kernel and amplitudes were determined 1) for emotion induction as the largest difference between a maximum and a preceding minimum in the 2.5 s induction phase (1–3.5 s after stimulus onset), and 2) for emotion regulation as the difference between the maximum in the induction phase (1–3.5 s after stimulus onset) and the maximum in the regulation phase (4–10 s after stimulus onset). SCR amplitudes were then log transformed (log([1+SCR[μS]])). IOG startle data were smoothed with a 10‐ms (FWHM) Gaussian kernel. Startle eyeblink amplitudes were determined as the maximum in the interval from 21 ms to 120 ms after startle probe onset, compared to the mean of a 20‐ms baseline beginning with startle probe onset; amplitudes were scaled to session mean. From one subject no startle data could be obtained. To test for effects of emotion induction on the SCR and startle eyeblink amplitudes we used paired t‐tests. To assess effects of emotion regulation on SCR and startle eyeblink amplitudes in the negative picture sets, we conducted a one‐factorial repeated measures analysis of variance (ANOVA) with three levels (negative‐view, negative‐decrease, negative‐increase).
fMRI Data Analysis
Image pre‐processing and statistical data analysis were performed with Statistical Parametric Mapping software (SPM2, Wellcome Department of Imaging Neuroscience, London, UK). The functional images of each subject were realigned to the first scan of the first session to correct for head movements and unwarped to account for susceptibility‐by‐movement interactions [Andersson et al., 2001]. As startle probes might have introduced additional head movement [Lang et al., 1990], we compared estimated mean movement amplitudes (translation and rotation in x, y, and z direction) for scans with startle probe delivery and scans without startle probe delivery. This comparison revealed that movement during startle probe delivery was not larger than movement during the rest of the trial in any direction. Images were then coregistered, spatially normalized to a standard template, and smoothed with a 3D isotropic Gaussian kernel (FWHM: 12 mm). The functional data were temporally filtered using an autoregressive model and a high‐pass filter with a cut‐off period of 55 s. A General Linear Model was applied to the time‐course of each voxel. Separate regressors were defined for each event: the instruction and the startle probe were modeled as stick functions convolved with a canonical hemodynamic response function (hrf). The picture presentation phase, the regulation phase, and the rating phase were modeled using boxcar functions of varying lengths (2.5, 6, and 3 s) convolved with the hrf. Each increase and decrease trial during the regulation phase was modeled separately to allow for correlation analyses with in‐scan success ratings on a trial‐by‐trial basis [Anders et al., 2004b].
To assess effects of emotion induction in the amygdala, we subtracted parameter estimates of regressors representing neutral pictures from those representing negative pictures in the induction phase. To investigate the effects of emotion regulation in the negative picture set during the 6‐s regulation period, we specified three contrasts: increase‐ minus‐view, decrease‐minus‐view, and view‐minus‐decrease. Contrasts were computed for every subject and the resulting individual contrast images were included in a random‐effects analysis.
To identify regions that showed common activity in the increase‐minus‐view and decrease‐minus‐view contrasts (meaning regions that are activated in both regulation conditions) we used a conjunction [Nichols et al., 2005] in a random‐effects analysis over the respective contrasts. Complementary to that analysis, we used an inclusive masking procedure (see Results for details) to test for brain regions active when decreasing that are not or less active when increasing and vice versa. Additionally, to test for brain activation (relative to simply viewing the pictures) associated with regulation‐related changes in subjective measures we 1) carried out trial‐by‐trial correlation analyses using as covariates the in‐scan success ratings in the decrease and increase conditions, respectively (assessing within‐subject correlations), and 2) carried out correlation analyses across subjects on second level contrasts using subjects post‐scan success ratings.
Analyses were performed within the regions of interest (amygdala, ACC, DLPFC, and OFC) and results are reported meeting a height threshold of P < 0.05 (corrected for the respective region of interest (ROI) according to random field theory [Worsley et al., 1996]). ROIs were defined using the Automated Anatomical Labeling (AAL) software [Tzourio‐Mazoyer et al., 2002]: for the amygdala and the ACC we made use of the regions defined by Tzourio‐Mazoyer et al. [ 2002], while for the DLPFC and the OFC we created masks by combining regions defined by the AAL (right/left DLPFC: superior frontal gyrus, middle frontal gyrus, and the opercular and triangular part of the inferior frontal gyrus with cut‐offs at x = ±12 and z = 0; OFC: inferior, medial, middle, and superior orbitofrontal gyri and the gyrus rectus). Only clusters larger than 10 voxels are reported. Coordinates of activated voxels are reported in MNI space (Montreal Neurological Institute) and activation maxima are labeled according to the AAL. Additionally, a whole‐brain analysis was carried out; results are reported meeting a height threshold of P < 0.05 (corrected for the entire brain according to random field theory [Worsley et al., 1996]) and shown in Table II.
Table II.
Results of the whole‐brain analysis
| Region | x | y | z | Z‐score |
|---|---|---|---|---|
| Contrast: view‐minus‐decrease | ||||
| No significant activation | ||||
| Contrast: decrease‐minus‐view | ||||
| Supplementary motor area (left) | 0 | 18 | 54 | 5.45 |
| Middle cingulate gyrus (right) | 6 | 24 | 36 | 5.41 |
| Anterior cingulate gyrus (left) | −6 | 30 | 27 | 4.93 |
| Contrast: increase‐minus‐view | ||||
| Precuneus (right) | 12 | −48 | 9 | 5.83 |
| Supplementary motor area (left) | 0 | 15 | 57 | 5.71 |
| Cerebellum (left) | −6 | −39 | −18 | 5.38 |
| Hippocampus (left) | −24 | −33 | −6 | 5.35 |
| Anterior cingulate gyrus (left) | −6 | 27 | 15 | 5.09 |
| Cerebellum (right) | 30 | −63 | −24 | 5.08 |
| Supplementary motor area (left) | −6 | −12 | 63 | 5.04 |
| Calcarine fissure (left) | −9 | −51 | 6 | 4.99 |
| Superior frontal gyrus (right) | 15 | 9 | 54 | 4.98 |
| Precuneus (left) | −21 | −51 | 12 | 4.85 |
| Cerebellum (left) | −27 | −57 | −24 | 4.85 |
| Supplementary motor area (right) | 9 | −6 | 66 | 4.70 |
P < 0.05, corrected for the entire brain; coordinates are in MNI space.
RESULTS
Confound Control
As neural responses to threat‐related stimuli can differ according to anxiety levels [Bishop et al., 2004a, b], we wanted to assure that our sample of subjects did not differ from the population in this respect. All subjects rated their trait anxiety (36.3 ± 1.4; standard error, SE) during the training session and their state anxiety before (39.5 ± 1.4) and after the experiment (37.9 ± 2.0) using the State‐Trait‐Anxiety Inventory [STAI; Spielberger et al., 1970; German version by Laux et al., 1981]. These scores deviated less than one standard deviation (SD) from the mean of their age group, showing the group of subjects to be a representative sample of the population.
All subjects received training in using the reappraisal strategies and most of them reported in the strategy questionnaire to have used the specified strategies in the experiment. To assess biases in subjects' responses regarding the use of the strategies they were asked to complete a social desirability scale [SDS‐CM; Crowne and Marlowe, 1960; German version by Lueck and Timaeus, 1969] during the training session. The scores on this scale were low (9.79 ± 3.2) and deviated less than 1 SD from the mean of the population. To further assure that ratings of emotion regulation success (which were used for correlation analyses with fMRI data) were not driven by demand characteristics, the social desirability scores were correlated with success ratings. No significant correlations were found, neither for the in‐scan success ratings (decrease: P < 0.17, increase: P < 0.21) nor for the post‐scan success ratings (decrease: P < 0.45, increase P < 0.27).
To exclude the possibility that subjects closed their eyes—which might serve as an effective way of lessening the emotional impact of the pictures in the downregulation condition—the eyetracker signal was monitored online. A loss of signal indicated that subjects closed their eyes. Such signal loss was not observed. Offline control was provided by the startle data, which could only be obtained if the subjects kept their eyes open.
Emotion Induction
Self‐report and physiological data
To assess the intended emotion induction, subjects were shown all the previously seen pictures in a post‐scan session and were asked to rate their initial affective response to them. These post‐scan ratings of affect are assumed to not be biased by in‐scan regulation [Ochsner et al., 2002]. Analyses of subjects' mean ratings of valence and arousal for the negative and neutral picture sets showed that subjects rated the affect induced by the negative picture set as more arousing (t(22) = 14.85, P < 0.001) and more negatively valenced (t(22) = 10.94, P < 0.001) than the affect induced by the neutral picture set. SCR and startle data also showed the intended emotion induction: SCR amplitude during the induction phase was significantly greater for the negative picture set than for the neutral picture set (t(23) = 2.85, P < 0.05) and startle amplitude was significantly greater in the negative‐view than in the neutral‐view condition (t(22) = 2.18, P < 0.05).
fMRI data
To assess effects of emotion induction on brain activity, we subtracted the brain activity associated with viewing the neutral picture set from that associated with viewing the negative picture set in the 2.5‐s induction phase and focused on the amygdala as an ROI. We observed significant bilateral amygdala activity (Z = 4.94, P < 0.001, coordinates: x = −24, y = −3, z = −12; Z = 4.29, P < 0.001, coordinates: x = 30, y = −3, z = −12; all P small volume‐corrected).
Emotion Regulation
Self‐report and physiological data
The grand average of the in‐scan ratings of emotion regulation success across all subjects was 3.26 ± 0.54 (mean and SD) on a scale from 1–5. There was no significant difference between the averages for the increase (3.34 ± 0.48) and decrease (3.17 ± 0.59) condition (t(23) = 1.43, P < 0.17). Post‐scan ratings of overall emotion regulation success also showed no significant difference between increase (3.50 ± 0.78) and decrease (3.04 ± 0.96), although a trend for higher success in increasing was observed (t(23) = 1.80, P < 0.09). A one‐factorial repeated‐measures analysis of variance (ANOVA) with three levels (conditions: view, increase, decrease) revealed a significant effect of instruction on SCR amplitudes during the regulation phase (F(2,46) = 9.68, P < 0.001). Planned post‐hoc t‐tests revealed a significant increase in subjects' SCR amplitude for increase compared to view (t(23) = 4.15, P < 0.001), a significant increase for increase compared to decrease (t(23) = 2.62, P < 0.05), and a nonsignificant increase for decrease compared to view (t(23) = 1.57, P < 0.13; Fig. 3). For startle data the repeated‐measures ANOVA did not reveal a significant effect of instruction (F(2,44) = 1.87, P < 0.17). Planned post‐hoc t‐tests revealed a nonsignificant increase in subjects' startle amplitude for increase compared to view (t(22) = 1.18, P < 0.17) and for increase compared to decrease (t(22) = 1.29, P < 0.14), but no significant change for decrease compared to view (t(22) = 0.17, P < 0.94). The trend in these results became stronger when we tested for effects of instruction on startle amplitudes only in successful regulators (by median‐splitting the group of subjects according to mean in‐scan success ratings for the increase and decrease conditions separately). t‐tests revealed a significant increase of startle amplitudes for increase compared to view (t(11) = 1.85, P < 0.05), and a nonsignificant decrease for decrease compared to view (t(11) = 0.58, P < 0.29; Fig. 3).
Figure 3.

Startle eyeblink and SCR amplitudes in the regulation phase. Upregulation (increase) significantly enhanced startle eyeblink and SCR amplitudes in comparison to the condition of viewing the pictures. Downregulation (decrease) showed a nonsignificant attenuation of startle eyeblink responses and a trend toward a significant enhancement of SCR amplitudes. Startle amplitudes are depicted separately for increase‐view and decrease‐view because each graph depicts only successful regulators in that condition as determined by success ratings. Error bars denote standard error of the mean. [Color figure can be viewed in the online issue, which is available at www.interscience.wiley.com.]
fMRI data
The left amygdala was the only region of interest that showed less activity in the decrease condition compared to the baseline condition of viewing the pictures (Table III; Fig. 4). In contrast, the ACC (left anterior cingulate gyrus), the OFC (left inferior orbitofrontal gyrus), and left DLPFC (inferior frontal gyrus, middle frontal gyrus) were more strongly activated in the decrease condition compared to the baseline condition (Table III). The contrast increase‐minus‐view—showing regions more active in the increase condition compared to the view condition—revealed significant activation in all regions of interest (Table III): amygdala (right and left; Fig. 4), left DLPFC (superior frontal gyrus, middle frontal gyrus), right DLPFC (superior frontal gyrus, inferior frontal gyrus), ACC (left and right anterior cingulate gyrus), and OFC (left inferior orbitofrontal gyrus, left gyrus rectus). The amygdala was thus the only ROI whose activity was modulated in opposite directions in the decrease and increase conditions compared to the view condition (Fig. 4). While we did not test for lateralization differences or within amygdala differences, we note that only the left amygdala was up‐ and downregulated, whereas the right amygdala showed a significant upregulation but only a nonsignificant downregulation and that up‐ and downregulation did not involve the same areas of the amygdala.
Table III.
Results of the ROI analysis
| Region | x | y | z | Z‐score |
|---|---|---|---|---|
| Contrast: view‐minus‐decrease | ||||
| Amygdala (left) | −27 | −3 | −21 | 3.88 |
| Contrast: decrease‐minus‐view | ||||
| Left DLPFC (inferior frontal gyrus) | −45 | 15 | 3 | 4.42 |
| (inferior frontal gyrus) | −42 | 21 | 0 | 4.15 |
| (middle frontal gyrus) | −30 | 3 | 57 | 4.05 |
| (inferior frontal gyrus) | −60 | 24 | 6 | 3.94 |
| ACC (left) | −6 | 30 | 27 | 4.93 |
| (left) | −3 | 24 | 30 | 4.90 |
| OFC (left inferior orbitofrontal gyrus) | −45 | 18 | −3 | 4.16 |
| Contrast: increase‐minus‐view | ||||
| Amygdala (right) | 21 | 3 | −18 | 3.97 |
| Amygdala (left) | −18 | 0 | −12 | 3.15 |
| Left DLPFC (superior frontal gyrus) | −12 | 9 | 54 | 4.23 |
| (superior frontal gyrus) | −15 | 9 | 60 | 4.15 |
| (middle frontal gyrus) | −30 | 0 | 54 | 3.93 |
| Right DLPFC (superior frontal gyrus) | 15 | 9 | 54 | 4.98 |
| (superior frontal gyrus) | 15 | −3 | 75 | 4.56 |
| (inferior frontal gyrus) | 51 | 9 | 6 | 4.02 |
| ACC (left) | −6 | 27 | 15 | 5.09 |
| (right) | 0 | 18 | 30 | 4.12 |
| (left) | −6 | 30 | 30 | 4.02 |
| (left) | −9 | 33 | 27 | 3.93 |
| OFC (left inferior orbitofrontal gyrus) | −45 | 18 | −3 | 4.25 |
| (left gyrus rectus) | −18 | 12 | −15 | 3.89 |
ROIs: Amygdala, left/right DLPFC, ACC, and OFC.
P < 0.05, small volume corrected; coordinates are in MNI space.
Figure 4.

Amygdala activation in the view‐minus‐decrease (top) and increase‐minus‐view (bottom) contrasts and corresponding time‐courses. In comparison to simply viewing the pictures, left amygdala activity was significantly downregulated when decreasing and right amygdala activity was significantly upregulated when increasing (left amygdala activity was also upregulated, but this cannot be seen on this coronal section). Activations are overlaid on subjects' mean anatomy at a level of P < 0.001 uncorrected (for visualization, images were masked by the amygdala region of interest mask); color scales denote t‐values. To depict temporal characteristics of amygdala activation, time‐courses were extracted from a 6‐mm sphere around the highest activated voxel; error bars in time‐courses denote standard error of the mean. The gray background represents the time range in which effects of regulation were expected. Assuming that the hemodynamic response exhibits a lag of about 4–6 s [Rosen et al., 1998] and regarding that a 3‐s interval (2.5 s picture presentation plus 0.5 s instruction) preceded the regulation phase regulatory effects are expected to start between 7–9 s after picture onset (zero on the time‐axis represents trial‐start). [Color figure can be viewed in the online issue, which is available at www.interscience.wiley.com.]
In order to characterize similarities and differences of prefrontal activation in both regulation conditions more explicitly, conjunction and masking analyses were carried out. To detect regions that show common activation in both regulation conditions compared to the baseline of viewing the pictures, a conjunction analysis [Nichols et al., 2005] over the contrasts increase‐minus‐view and decrease‐minus‐view was carried out. It revealed overlap of activation in left DLPFC (inferior frontal gyrus, middle frontal gyrus), ACC (left anterior cingulate gyrus), and OFC (left inferior orbitofrontal gyrus; Fig. 5; Table IV). To differentiate between activations specific for the increase or decrease condition, we used inclusive masking procedures [see also Ochsner et al., 2004]. These were carried out in the following way (here explained for increase > decrease): 1) identify regions that are associated with increasing through computing the increase‐minus‐view contrast, and 2) use this contrast to inclusively mask the increase‐minus‐decrease contrast to identify those regions more active during increasing than during decreasing that are also more active during increasing than during simply viewing the pictures. The amygdala (right and left), the right DLPFC (superior frontal gyrus; Fig. 5), the ACC (left anterior cingulate gyrus), and the OFC (right inferior orbitofrontal gyrus) showed significant activation in the “increase > decrease inclusive masking” analysis (Table IV). No significant activation could be observed at the level of P < 0.05 (small volume‐corrected) in the “decrease > increase inclusive masking” analysis. When using a less conservative height threshold of P < 0.001 uncorrected, two peaks were detected in left DLPFC (inferior frontal gyrus; Table IV; Fig. 5) and right DLPFC (inferior frontal gyrus; see Table IV).
Figure 5.
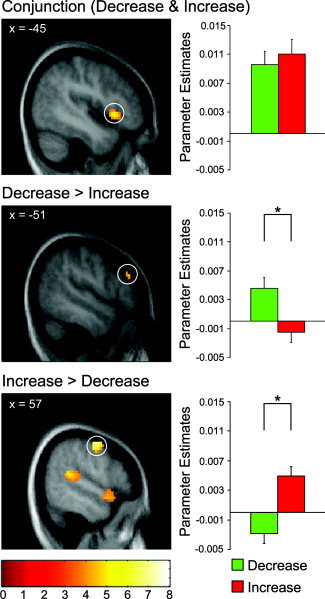
Prefrontal activation peaks and respective parameter estimates. Parameter estimates on the right side stem from the highest activated voxel in the cluster surrounded by the circle. The top panel shows that the OFC exhibits significant overlap of activation across downregulation and upregulation (as revealed by conjunction analysis: conjunction [(increase‐minus‐view) (decrease‐minus‐view)]). The middle panel shows a region in left DLPFC that was significantly stronger activated for downregulation than for upregulation (as revealed by inclusive masking of the decrease‐minus‐increase contrast with the decrease‐minus‐view contrast). The bottom panel shows a region in right DLPFC that was significantly stronger activated for upregulation than for downregulation (as revealed by inclusive masking of the increase‐minus‐decrease contrast with the increase‐minus‐view contrast). Activations are overlaid on subjects' mean anatomy at a level of P < 0.001 uncorrected; the color scale denotes t‐values. [Color figure can be viewed in the online issue, which is available at www.interscience.wiley.com.]
Table IV.
Results of the ROI conjunction and masking analysis
| Region | x | y | z | Z‐score |
|---|---|---|---|---|
| Conjunction: [(increase‐minus‐view) (decrease‐minus‐view)] | ||||
| Left DLPFC (inferior frontal gyrus) | −48 | 18 | 0 | 3.99 |
| (middle frontal gyrus) | −30 | 3 | 54 | 3.91 |
| ACC (left) | 0 | 18 | 30 | 4.12 |
| (left) | −6 | 30 | 30 | 3.93 |
| (left) | −9 | 33 | 27 | 4.76 |
| OFC (left inferior orbitofrontal gyrus) | −45 | 18 | −3 | 4.16 |
| Increase‐minus‐decrease masked inclusively by increase‐minus‐view | ||||
| Amygdala (Right) | 24 | 0 | −21 | 3.76 |
| (Left) | −24 | −9 | −12 | 3.37 |
| Right DLPFC (superior frontal gyrus) | 57 | −6 | 51 | 5.13 |
| ACC (Left) | −6 | 27 | 15 | 5.29 |
| (Left) | 0 | 24 | −6 | 3.63 |
| OFC (right inferior orbitofrontal gyrus) | 48 | 24 | −15 | 4.08 |
| (right inferior orbitofrontal gyrus) | 39 | 24 | −18 | 3.83 |
| Decrease‐minus‐increase masked inclusively by decrease‐minus‐view * | ||||
| Left DLPFC (inferior frontal gyrus) | −51 | 36 | 27 | 3.71 |
| Right DLPFC (inferior frontal gyrus) | 48 | 36 | 24 | 3.52 |
ROIs: Amygdala, left/right DLPFC, ACC, and OFC.
P < 0.05, small volume corrected; coordinates are in MNI space.
For this contrast, a less conservative threshold (P < 0.001 uncorrected) was used; see Results for details.
Correlation of fMRI and self‐report data
To determine regions associated with the subjective feeling of emotion regulation success, trial‐by‐trial correlation analyses [Anders et al., 2004b] between the in‐scan success ratings and brain activity were performed for both the increase and the decrease condition. Bilateral amygdala activation (left amygdala: Z = 3.32, P < 0.05, coordinates: x = −18, y = −3, z = −21; Fig. 6; right amygdala: Z = 3.17, P < 0.05, coordinates: x = 18, y = −3, z = −15) correlated positively with success ratings in the increase condition, whereas activation in the OFC (right medial orbitofrontal gyrus, Z = 4.10, P < 0.05, coordinates: x = 3, y = 54, z = −3) that extended into the ACC (right anterior cingulate gyrus, Z = 3.53, P < 0.05, coordinates: x = 0, y = 51, z = 0) correlated positively with success ratings in the decrease condition. To assess effects across subjects, a correlation analysis between post‐scan success ratings and brain activity was carried out that revealed a negative correlation in left amygdala (Z = 2.92, P < 0.055, coordinates: x = −30, y = −3, z = −21) and right DLPFC (inferior frontal gyrus, Z = 4.08, P < 0.05, coordinates: x = 42, y = 27, z = 18) in the decrease condition; i.e., higher decrease success‐ratings were associated with lower activity in left amygdala / right DLPFC.
Figure 6.

Correlation between left amygdala activation and trial‐by‐trial success ratings in the increase condition. On the left side, a horizontal section displays left amygdala activity that correlated positively with subjects' ratings of regulation success during scanning. Activations are overlaid on subjects' mean anatomy at a level of P < 0.001 uncorrected; the color scale denotes t‐values. For the regression plot on the right side data were extracted from a 6‐mm sphere around the highest activated voxel in the amygdala (denoted by the circle). Each data point represents one subject's mean hemodynamic response over trials with the same success rating. Note that not all categories were used by all subjects (i.e., some subjects did not use the rating “2,” others never rated their success above “4,” etc.). [Color figure can be viewed in the online issue, which is available at www.interscience.wiley.com.]
DISCUSSION
This study used fMRI in combination with recording of subjective and peripheral physiological responses to investigate voluntary regulation of emotional responses elicited by threat‐related pictures. Consistent with our hypotheses, we observed that amygdala activity was up‐ and downregulated in the respective conditions compared to a baseline of viewing the pictures and that during regulation trials activity in DLPFC, ACC, and OFC was increased. Furthermore, regulation modulated peripheral physiological responses and subjective regulation success correlated significantly with brain activity in predicted regions.
Emotion Induction
Through the inclusion of an induction phase before the experimental instruction, it was possible to investigate whether the emotional reaction, which should later be regulated, truly developed. To our knowledge, previous neuroimaging studies on emotion regulation did not assess this basic effect. Emotion induction through threat‐related pictures was successful, as evidenced on the subjective, peripheral physiological, and neural level: 1) when viewing threat‐related pictures subjects rated their initial affect as more arousing and more negatively valenced than when viewing neutral pictures; 2) startle eyeblink amplitudes and skin conductance responses were increased in response to threat‐related as compared to neutral pictures; and 3) bilateral amygdala activity in the induction phase was increased when viewing threat‐related compared to neutral pictures.
Emotion Regulation: Amygdala, Startle Eyeblink, and Skin Conductance Responses
The pattern of amygdala activity followed the regulatory instructions: during increase trials the amygdala response was amplified as compared to view trials, whereas during decrease trials the amygdala response was attenuated as compared to view trials. This modulation of the amygdala response is in line with previous studies of emotion regulation that showed decreased amygdala activity when downregulating sexual arousal [Beauregard et al., 2001], sadness [Levesque et al., 2003], and negative affect [Ochsner et al., 2002, 2004; Phan et al., 2005] and increased amygdala activity when maintaining [Schaefer et al., 2002] and upregulating negative affect [Ochsner et al., 2004] and extends these findings to the up‐ and downregulation of emotional responses elicited by threat‐related stimuli. The increase in bilateral amygdala activity correlated positively with self‐reported success during upregulation and the decrease in right amygdala activity correlated positively with self‐reported success during downregulation. This suggests that changing one's own affective state is mediated at least partly via regulation of amygdala activity.
The time‐courses of amygdala activity showed that in the increase condition amygdala activity was amplified relatively fast, whereas the attenuation of amygdala activity in the decrease condition occurred later during the regulation phase. This pattern of amygdala activity is in line with the effects of emotion regulation on peripheral physiological responses taken during scanning. Upregulation was associated with amplified SCR, indicating an increased level of arousal [Lang et al., 1993], and startle potentiation in successful regulators, indicating an increased negative affective state [Lang et al., 1990]. For downregulation a more diverse picture emerged. SCR amplitude did not decrease, but instead slightly increased. Startle amplitude only showed a nonsignificant reduction. An early study on downregulation of emotional responses to a threatening film found that decreases in SCR were greater when an instruction was given before than during the film [Lazarus et al., 1964], indicating that effective downregulation of autonomic responses might need some preparation. In line with this argument, we presume that startle probe delivery in our study might have been too early to reliably detect the effects of downregulation. Upon closer inspection of the data by Jackson et al. [ 2000] and Dillon and LaBar [ 2005], we observed that they also found only small decreases when the startle probe was delivered early, while much larger decreases were obtained at a later timepoint. In our study, startle probes were delivered before a reduction of amygdala activity was observed during downregulation. Taken together, these points suggest that the time‐course of up‐ and downregulation of emotional responses to threat‐related stimuli is not equivalent. Reversing the direction of an emotional response that is already under way seems to take longer than simply enhancing a response in the direction it is developing.
In sum, our data imply that cognitive strategies can alter peripheral physiological and amygdala responses to a threatening event and add weight to the suggestion that voluntary control of amygdala activation is possible [Ochsner et al., 2004; Posse et al., 2003]. They furthermore show that there are differences between processes of up‐ and downregulation with regard to their time‐course. Interestingly, during downregulation amygdala activity was decreased even below that associated with neutral stimuli, suggesting a possible desensitization of the amygdala via downregulation.
Contribution of Prefrontal Areas to Emotion Regulation
Brain activation associated with regulation was found in all prefrontal regions of interest (ACC, DLPFC, and OFC), with the exception of the right DLPFC in the decrease condition. When we directly tested for similarities and differences in prefrontal activation across regulation conditions, we observed significant overlap in regions of ACC, DLPFC, and OFC that might be involved in basic functions crucial for both up‐ and downregulation, such as the representation of similar components of the reappraisal strategies, or conflict detection and resolution. We also observed activations specific to each regulation condition, which indicates that cognitive transformation of emotional responses also recruits different mechanisms for up‐ and downregulation. It could be speculated that these specific activations, which were sometimes found in close proximity to regions exhibiting overlap across both regulation conditions, might be responsible for differentially altering amygdala activity. With regard to the role of each prefrontal region in emotion regulation, earlier studies point to different functions.
The ACC has been implicated in cognitive control, especially in the processing of conflicting information [Botvinick et al., 1999; Weissman et al., 2004] and is involved in the regulation of emotional responses [Beauregard et al., 2001; Ochsner et al., 2004]. It is divided into a ventral affective and a dorsal cognitive division. The latter is involved in control tasks such as response selection or competition monitoring [Bush et al., 2000]. Moreover, activity in this region has been shown to be negatively related to intensity of negative emotion [Ochsner et al., 2002; Phan et al., 2005]. We observed ACC activation in both regulation conditions in this study, with stronger activations in the increase condition. Except for one peak of activation in the very ventral affective division, which was observed when directly comparing increas ing vs. decreasing, all activations were clearly located in the dorsal cognitive division of the ACC. This suggests that whereas rostral/ventral ACC can be regulated by cognitive strategies [Kalisch et al., 2005], dorsal ACC is involved in the up‐ and downregulation of emotional responses. Dorsal ACC is involved in detecting conflicts, as they might arise from amygdalar bottom‐up evaluations concerning the emotional intensity of the threat‐related stimuli [Phan et al., 2004] and the opposing top‐down reappraisals that are an attempt to alter emotional intensity according to the respective instruction. Upon detection of a conflict, the dorsal ACC could exert rather direct influence on the amygdala—as recent data by Das et al. [ 2005] suggest, showing dorsal ACC mediated amygdala modulation in a fear perception task—or it might activate areas of DLPFC for control processes.
The DLPFC is a crucial component of the working memory system and is responsible for aspects of representing information [“keeping in mind”; Bunge et al., 2001] and executive processes that involve active manipulation of information [Cabeza and Nyberg, 2000; Smith and Jonides, 1999]. It has consistently been shown to be active in the downregulation of emotion [Beauregard et al., 2001; Levesque et al., 2003, 2004; Ochsner et al., 2002, 2004; Phan et al., 2005] and has also been found to participate in the upregulation of negative emotion [Ochsner et al., 2004]. In relation to our study, Bishop et al. [ 2004a] have shown that DLPFC is involved in controlling attention to threat‐related stimuli, and that this function is mediated by anxiety levels. In our study, DLPFC showed activation in up‐ and downregulation of emotional responses to threat‐related stimuli and exhibited significant overlap of activation across both regulation conditions. DLPFC‐dependent processes relevant for up‐ and downregulation include the representation of reappraisal strategies, the allocation of attention toward goal‐relevant aspects of the task, and suppression of distraction. DLPFC activation during downregulation did not reach significance in the right hemisphere, which contrasts with other studies [Ochsner et al., 2004] and with findings associating behavioral inhibition with right‐hemispheric activation [Garavan et al., 1999]. However, when directly comparing downregulation to upregulation we observed bilateral DLPFC activation. Surprisingly, we found a negative correlation across subjects between post‐scan ratings of regulation success and right DLPFC activation in the decrease condition; i.e., subjects who rated themselves to be successful in downregulation exhibited less activation in prefrontal cortex than subjects who rated themselves to be unsuccessful. While this finding awaits replication, it is in line with a recent study of Levesque et al. [ 2004], who found children to exhibit more prefrontal activations when downregulating sadness than adults, and attributed this to the immaturity of prefrontal‐limbic connections.
The DLPFC has only sparse connections to the amygdala [McDonald, 1998] and thus unlikely influences amygdala activity directly. It has been argued [Ochsner et al., 2002; Ochsner and Gross, 2005] that the DLPFC might influence the amygdala via modulating activity in posterior perceptual areas in parietal/occipital cortex that send information to the amygdala or that the DLPFC could influence the amygdala via the OFC, which is situated at the junction of prefrontal and limbic areas and exhibits dense connections to both DLPFC and amygdala [McDonald, 1998; Cavada et al., 2000]. While we did not test for functional connectivity between these areas, we found significant activation in lateral areas of OFC for both up‐ and downregulation and also a lateral area with significant overlap across both conditions. Previously, lateral areas of the OFC have been im plicated in the downregulation of negative affect [Ochsner et al., 2004] and more specifically in the suppression of sadness [Levesque et al., 2003, 2004], ascribing to them a regulatory role, which also fits with their involvement in processes of reversal learning [Kringelbach and Rolls, 2003]. In this study, the self‐induced changes in emotional intensity while the physical stimulus stays the same can be thought of as reversal processes. Lateral OFC areas, however, have also been implicated in representing negative valence and punishment [Anderson et al., 2003; O'Doherty et al., 2001], suggesting converging cognitive and emotional inputs. Along these lines, OFC activation was more pronounced for the increase condition as shown by the direct comparison of increasing vs. decreasing, likely due to the composite effects of increased emotional intensity and cognitive processes serving upregulation. A medial area of OFC showed no main effect of either up‐ or downregulation, but correlated positively with trial‐by‐trial success ratings in the decrease condition, in that higher success ratings were associated with stronger medial OFC activation. Medial OFC has consistently been implicated in appetitive processing and reward‐related behavior [Anderson et al., 2003; O'Doherty et al., 2001; for review, see O'Doherty, 2004]. This activation might reflect reward‐related processing in that it represents the combination of a successful reappraisal and a resulting decreased negative affective state. As no such correlation was found in the increase condition, possibly because the reward value of successful reappraisal is canceled out by the increased negative affective state, this is a further indication of differences in the processes of up‐ and downregulation.
Clinical Implications
Dysfunctions of emotion regulation processes can be found in clinical and nonclinical populations. It has been proposed that the exaggerated amygdala response found in anxiety and other psychiatric disorders [social phobia: Birbaumer et al., 1998; posttraumatic stress disorder: Rauch et al., 2000; depression: Drevets et al., 1992] might be due to a lack of prefrontal cortical inhibition [emotional instability and ACC dysfunction: Bush et al., 2000; depression and DLPFC dysfunction: Brody et al., 2001; posttraumatic stress disorder and ACC gray matter volume reduction: Yamasue et al., 2004; decreased ACC‐amygdala connectivity in depression: Anand et al., 2005; less DLPFC activation and high rumination scores: Ray et al., 2005]. Therefore, we tested whether some prefrontal regions would be exclusively involved in downregulation. We observed an almost symmetrical response specific for down‐regulation in left and right DLPFC (inferior frontal gyrus), the location of which is very similar to the right‐hemispheric regulatory region identified by Kalisch et al. [ 2005] in their study on anxiety reduction. These regions might be of interest for understanding the mechanisms by which (cognitive‐behavioral) psychotherapy exerts its effects as successful therapy of anxiety disorders is marked by changes in prefrontal activity [Paquette et al., 2003], along with diminished amygdala activity [Furmark et al., 2002]. These regions are also of interest for novel approaches to treat psychiatric disorders by means such as real‐time fMRI feedback [deCharms et al., 2005; Weiskopf et al., 2004]. With this technique one might train subjects to activate these regulatory regions and thereby inhibit or attenuate the overactive amygdala. Conversely, some psychotherapeutic approaches use the concept of paradox intervention (i.e., intentionally increasing one's symptoms) to give the patient the feeling of control over her/his symptoms and thereby increase the patient's self‐efficacy. We speculate that prefrontal regions specific for upregulation are involved in these processes. In line with this, such approaches are not limited to the cognitive‐behavioral level, but can be extended to the level of brain activation [see Adcock et al., 2005, for a real‐time fMRI study on symptom provocation and regulation in patients with obsessive‐compulsive disorder]. The increase condition is furthermore of interest with respect to psychopathic individuals, who show a lack of emotional responses to threat‐related stimuli on a behavioral (i.e., SCR) as well as on a neural level [i.e., OFC activation; Birbaumer et al., 2005]. Currently, real‐time fMRI studies are under way in our laboratory that investigate the relation between upregulation of prefrontal regions and fear processing in healthy controls and psychopaths.
Caveats and Open Questions
Several limitations of the present study are worth discussing. First, the startle probe might have interrupted regulatory processes. This could have occurred similarly during up‐ and downregulation, or only during downregulation, as the startle probe's aversive quality could interfere with processes involved in reducing an aversive affective state. While we did not control for this possible confound, future studies could do this by comparing regulation outcome on trials with and without startle delivery. Second, we cannot ascertain whether the observed prefrontal activations are due to nonspecific mechanisms or mechanisms specifically involved in regulating negative affect. One solution would be to include a condition in which subjects are presented with regulation instructions for neutral stimuli [see Kalisch et al., 2005] and then compare activation in prefrontal regions for these conditions. Third, this study does not allow making causal claims regarding influences one brain region might have on another. This issue could be investigated by connectivity analyses such as Dynamic Causal Modeling [Friston et al., 2003] or, as recently suggested by Kringelbach [ 2005], by the employment of Granger causality methods on magnetoencephalography (MEG) data to obtain results on a finer time‐scale. Finally, the results do not allow firm conclusions about the effects of downregulation, as no significant decreases in startle and skin conductance responses were observed. We have presented some arguments for the longer time‐period needed for downregulation to become effective. Future studies might address this issue by recording physiological responses at different timepoints in combination with giving instructions before and during stimulus presentation.
SUMMARY
This study investigated up‐ and downregulation of emotional responses via reappraisal strategies through integration of subjective, peripheral physiological, and neural measures. It showed voluntary up‐ and downregulation of the amygdala response to threat‐related stimuli through the use of cognitive strategies, which significantly correlated with subjective reports of regulatory success. The regulation period was characterized by modifications of startle eyeblink and skin conductance responses that partly mirrored amygdala modulation, and by activity peaks in the DLPFC, ACC, and OFC. There was a significant overlap of activated prefrontal regions across both regulation conditions, suggesting similar underlying mechanisms, but each condition also showed some distinctive features. Precisely delineating the prefrontal and limbic substrates involved in regulation of emotional responses can help to advance understanding of the neural mechanisms underlying psychotherapy and would allow the use of new therapeutic tools, such as real‐time fMRI feedback, to target the overactive amygdala found in many psychiatric disorders.
Acknowledgements
The authors thank B. Newport for technical help and S. Leiberg and R. Kalisch for helpful discussions on earlier versions of the article.
REFERENCES
- Adcock RA, Lutomski K, McLeod SR, Soneji DJ, Gabriele JDE ( 2005): Real‐time fMRI during the psychotherapy session: toward a methodology to augment therapeutic benefit, exemplary data. Abstract Presented at the Human Brain Mapping Conference 2005, Toronto, Canada.
- Anand A, Li Y, Wang Y, Wu J, Gao S, Bukhari L, Mathews VP, Kalnin A, Lowe MJ ( 2005): Activity and connectivity of brain mood regulating circuit in depression: a functional magnetic resonance study. Biol Psychiatry 57: 1079–1088. [DOI] [PubMed] [Google Scholar]
- Anders S, Weiskopf N, Lule D, Birbaumer N ( 2004a): Infrared oculography—validation of a new method to monitor startle eyeblink amplitudes during fMRI. Neuroimage 22: 767–770. [DOI] [PubMed] [Google Scholar]
- Anders S, Lotze M, Wildgruber D, Erb M, Grodd W, Birbaumer N ( 2004b): Brain activity underlying emotional valence and arousal: a response‐related fMRI study. Hum Brain Mapp 23: 200–209. [DOI] [PMC free article] [PubMed] [Google Scholar]
- Anderson AK, Christoff K, Stappen I, Panitz D, Ghahremani DG, Glover G, Gabrieli JD, Sobel N ( 2003): Dissociated neural representations of intensity and valence in human olfaction. Nat Neurosci 6: 196–202. [DOI] [PubMed] [Google Scholar]
- Andersson JL, Hutton C, Ashburner J, Turner R, Friston K ( 2001): Modeling geometric deformations in EPI time series. Neuroimage 13: 903–919. [DOI] [PubMed] [Google Scholar]
- Badre D, Wagner AD ( 2004): Selection, integration, and conflict monitoring: assessing the nature and generality of prefrontal cognitive control mechanisms. Neuron 41: 473–487. [DOI] [PubMed] [Google Scholar]
- Balaban MT, Taussig HN ( 1994): Salience of fear/threat in the affective modulation of the human startle blink. Biol Psychol 38: 117–131. [DOI] [PubMed] [Google Scholar]
- Baumgart T, Kaulisch T, Tempelmann C, Gaschler‐Markefski B, Tegeler C, Schindler F, Stiller D, Scheich H ( 1998): Electrodynamic headphones and woofers for application in magnetic resonance imaging scanners. Med Phys 25: 2068–2070. [DOI] [PubMed] [Google Scholar]
- Beauregard M, Levesque J, Bourgoin P ( 2001): Neural correlates of conscious self‐regulation of emotion. J Neurosci 21:RC165 : 1–6. [DOI] [PMC free article] [PubMed] [Google Scholar]
- Birbaumer N, Grodd W, Diedrick O, Klose U, Erb M, Lotze M, Schneider F, Weiss U, Flor H ( 1998): fMRI reveals amygdala activation to human faces in social phobics. Neuroreport 9: 1223–1226. [DOI] [PubMed] [Google Scholar]
- Birbaumer N, Veit R, Lotze M, Erb M, Hermann C, Grodd W, Flor H ( 2005): Deficient fear conditioning in psychopathy: a functional magnetic resonance imaging study. Arch Gen Psychiatry 62: 799–805. [DOI] [PubMed] [Google Scholar]
- Bishop SJ, Duncan J, Brett M, Lawrence AD ( 2004a): Prefrontal cortical function and anxiety: controlling attention to threat‐related stimuli. Nat Neurosci 7: 184–188. [DOI] [PubMed] [Google Scholar]
- Bishop SJ, Duncan J, Lawrence AD ( 2004b): State anxiety modulation of the amygdala response to unattended threat‐related stimuli. J Neurosci 24: 10364–10368. [DOI] [PMC free article] [PubMed] [Google Scholar]
- Botvinick MM, Nystrom LE, Fissell K, Carter CS, Cohen JD ( 1999): Conflict monitoring versus selection‐for‐action in anterior cingulate cortex. Nature 402: 179–181. [DOI] [PubMed] [Google Scholar]
- Bradley MM, Lang PJ ( 1994): Measuring emotion: the self‐assessment manikin and the semantic differential. J Behav Ther Exp Psychiatry 25: 49–59. [DOI] [PubMed] [Google Scholar]
- Brody AL, Barsom MW, Bota RG, Saxena S ( 2001): Prefrontal‐subcortical and limbic circuit mediation of major depressive disorder. Semin Clin Neuropsychiatry 6: 102–112. [DOI] [PubMed] [Google Scholar]
- Büchel C, Morris JS, Dolan RJ, Friston KJ ( 1998): Brain systems mediating aversive conditioning: an event‐related fMRI study. Neuron 20: 947–957. [DOI] [PubMed] [Google Scholar]
- Bunge SA, Ochsner KN, Desmond JE, Glover GH, Gabrieli JDE ( 2001): Prefrontal regions involved in keeping information in and out of mind. Brain 124: 2074–2086. [DOI] [PubMed] [Google Scholar]
- Bush G, Luu P, Posner MI ( 2000): Cognitive and emotional influences in anterior cingulate cortex. Trends Cogn Sci 4: 215–222. [DOI] [PubMed] [Google Scholar]
- Cabeza R, Nyberg L ( 2000): Imaging cognition II: an empirical review of 275 PET and fMRI studies. J Cogn Neurosci 12: 1–47. [DOI] [PubMed] [Google Scholar]
- Cavada C, Compañy T, Tejedor J, Cruz‐Rizzolo RJ, Reinoso‐Suárez F ( 2000): The anatomical connections of the macaque monkey orbitofrontal cortex. A review. Cereb Cortex 10: 220–242. [DOI] [PubMed] [Google Scholar]
- Crowne DP, Marlowe D ( 1960): A new scale of social desirability independent of psychopathology. J Consult Psychol 24: 349–354. [DOI] [PubMed] [Google Scholar]
- Das P, Kemp AH, Liddell BJ, Brown KJ, Olivieri G, Peduto A, Gordon E, Williams LM ( 2005): Pathways for fear perception: modulation of amygdala by thalamo‐cortical systems. Neuroimage 26: 141–148. [DOI] [PubMed] [Google Scholar]
- Davidson RJ, Putnam KM, Larson CL ( 2000): Dysfunction in the neural circuitry of emotion regulation—a possible prelude to violence. Science 289: 591–594. [DOI] [PubMed] [Google Scholar]
- Davidson RJ, Scherer KR, Goldsmith HH ( 2003): Handbook of affective sciences. New York: Oxford University Press. [Google Scholar]
- deCharms RC, Maeda F, Glover GH, Ludlow D, Pauly JM, Soneji D, Gabrieli JDE, Mackey SC ( 2005): Control over brain activation and pain learned by using real‐time functional MRI. Proc Natl Acad Sci U S A 102: 18626–18631. [DOI] [PMC free article] [PubMed] [Google Scholar]
- Dillon DG, LaBar KS ( 2005): Startle modulation during conscious emotion regulation is arousal‐dependent. Behav Neurosci 119: 1118–1124. [DOI] [PubMed] [Google Scholar]
- Dolan RJ, Morris JS, deGelder B ( 2001): Crossmodal binding of fear in voice and face. Proc Natl Acad Sci U S A 98: 10006–10010. [DOI] [PMC free article] [PubMed] [Google Scholar]
- Drevets WC, Videen TO, Price JL, Preskorn SH, Carmichael ST, Raichle ME ( 1992): A functional anatomical study of unipolar depression. J Neurosci 12: 3628–3641. [DOI] [PMC free article] [PubMed] [Google Scholar]
- Friston KJ, Harrison L, Penny W ( 2003): Dynamic causal modelling. Neuroimage 19: 1273–1302. [DOI] [PubMed] [Google Scholar]
- Furmark T, Tillfors M, Marteinsdottir I, Fischer H, Pissioa A, Langstrom B, Fredrikson M ( 2002): Common changes in cerebral blood flow in patients with social phobia treated with citalopram or cognitive‐behavioral therapy. Arch Gen Psychiatry 59: 425–433. [DOI] [PubMed] [Google Scholar]
- Garavan H, Ross TJ, Stein EA ( 1999): Right hemispheric dominance of inhibitory control: an event‐related functional MRI study. Proc Natl Acad Sci U S A 6: 8301–8306. [DOI] [PMC free article] [PubMed] [Google Scholar]
- Gross JJ ( 1998): Antecedent‐ and response‐focussed emotion regulation: divergent consequences for experience, expression, and physiology. J Pers Soc Psychol 74: 224–237. [DOI] [PubMed] [Google Scholar]
- Gross JJ ( 2002): Emotion regulation: affective, cognitive, and social consequences. Psychophysiology 39: 281–291. [DOI] [PubMed] [Google Scholar]
- Halgren E, Walter RD, Cherlow DG, Crandall PH ( 1978): Mental phenomena evoked by electrical stimulation of the human hippocampal formation and amygdala. Brain 101: 83–117. [DOI] [PubMed] [Google Scholar]
- Hamann SB, Ely TD, Hoffman JM, Kilts CD ( 2002): Ecstasy and agony: activation of the human amygdala in positive and negative emotion. Psychol Sci 13: 135–141. [DOI] [PubMed] [Google Scholar]
- Jackson DC, Malmstadt JR, Larson CL, Davidson RJ ( 2000): Suppression and enhancement of emotional responses to unpleasant pictures. Psychophysiology 37: 515–522. [PubMed] [Google Scholar]
- Kalisch R, Wiech K, Critchley HD, Seymour B, O'Doherty JP, Oakley DA, Allen P, Dolan RJ ( 2005): Anxiety reduction through detachment: subjective, physiological and neural effects. J Cogn Neurosci 17: 874–883. [DOI] [PubMed] [Google Scholar]
- Knight RT, Staines WR, Swick D, Chao LL ( 1999): Prefrontal cortex regulates inhibition and excitation in distributed neural networks. Acta Psychol 101: 159–178. [DOI] [PubMed] [Google Scholar]
- Kring AM, Gordon AH ( 1998): Sex differences in emotion: expression, experience, and physiology. J Pers Soc Psychol 74: 686–703. [DOI] [PubMed] [Google Scholar]
- Kringelbach ML ( 2005): The human orbitofrontal cortex: linking reward to hedonic experience. Nat Rev Neurosci 6: 691–702. [DOI] [PubMed] [Google Scholar]
- Kringelbach ML, Rolls ET ( 2003): Neural correlates of rapid reversal learning in a simple model of human social interaction. Neuroimage 20: 1371–1383. [DOI] [PubMed] [Google Scholar]
- Lang PJ, Bradley MM, Cuthbert BN ( 1990): Emotion, attention, and the startle reflex. Psychol Rev 97: 377–395. [PubMed] [Google Scholar]
- Lang PJ, Greenwald MK, Bradley MM, Hamm AO ( 1993): Looking at pictures: affective, facial, visceral and behavioral reactions. Psychophysiology 30: 261–273. [DOI] [PubMed] [Google Scholar]
- Lang PJ, Bradley MM, Cuthbert BN ( 1999): International affective picture system (IAPS): instruction manual and affective ratings. Technical Report A‐4. Gainesville, FL: Center for Research in Psychophysiology, University of Florida. [Google Scholar]
- Laux L, Glanzmann P, Schaffner P, Spielberger CD ( 1981): Das State‐Trait‐Angstinventar. Theoretische Grundlagen und Handanweisung. Weinheim: Beltz. [Google Scholar]
- Lazarus RS, Alfert E ( 1964): Short‐circuiting of threat by experimen tally altering cognitive appraisal. J Abnorm Psychol 69: 195– 205. [DOI] [PubMed] [Google Scholar]
- LeDoux JE ( 2000): Emotion circuits in the brain. Annu Rev Neurosci 23: 155–184. [DOI] [PubMed] [Google Scholar]
- Levesque J, Eugène F, Joanette Y, Paquette V, Mensour B, Beaudoin G, Leroux JM, Bourgoin P, Beauregard M ( 2003): Neural circuitry underlying voluntary suppression of sadness. Biol Psychiatry 53: 502–510. [DOI] [PubMed] [Google Scholar]
- Levesque J, Joanette Y, Mensour B, Beaudoin G, Leroux JM, Bourgouin P, Beauregard M ( 2004): Neural basis of emotional self‐regulation in childhood. Neuroscience 129: 361–369. [DOI] [PubMed] [Google Scholar]
- Lueck HE, Timaeus E ( 1969): Skalen zur Messung Manifester Angst (MAS) und sozialer Wünschbarkeit (SDS‐E und SDS‐CM). Diagnostica 15: 134–141. [Google Scholar]
- McDonald AJ ( 1998): Cortical pathways to the mammalian amygdala. Prog Neurobiol 55: 257–332. [DOI] [PubMed] [Google Scholar]
- Miller EK ( 2000): The prefrontal cortex and cognitive control. Nat Rev Neurosci 1: 59–65. [DOI] [PubMed] [Google Scholar]
- Morris JS, Frith CD, Perrett DI, Rowland D, Young AW, Calder AJ, Dolan RJ ( 1996): A differential neural response in the human amygdala to fearful and happy facial expressions. Nature 383: 812–815. [DOI] [PubMed] [Google Scholar]
- Murphy FC, Nimmo‐Smith I, Lawrence AD ( 2003): Functional neuroanatomy of emotions: a meta‐analysis. Cogn Affect Behav Neurosci 3: 207–233. [DOI] [PubMed] [Google Scholar]
- Nichols T, Brett M, Andersson J, Wager T, Poline JB ( 2005): Valid conjunction inference with the minimum statistic. Neuroimage 25: 653–660. [DOI] [PubMed] [Google Scholar]
- Ochsner KN, Gross JJ ( 2005): The cognitive control of emotion. Trends Cogn Sci 9: 242–249. [DOI] [PubMed] [Google Scholar]
- Ochsner KN, Bunge SA, Gross JJ, Gabrieli JDE ( 2002): Rethinking feelings: an fMRI study of the cognitive regulation of emotion. J Cogn Neurosci 14: 1215–1229. [DOI] [PubMed] [Google Scholar]
- Ochsner KN, Ray RD, Cooper JC, Robertson ER, Chopra S, Gabrieli JD, Gross JJ ( 2004): For better or for worse: neural systems supporting the cognitive down‐ and upregulation of negative emotion. Neuroimage 23: 483–499. [DOI] [PubMed] [Google Scholar]
- O'Doherty JP ( 2004): Reward representations and reward‐related learning in the human brain: insights from neuroimaging. Curr Opin Neurobiol 14: 769–776. [DOI] [PubMed] [Google Scholar]
- O'Doherty J, Kringelbach ML, Rolls ET, Hornak J, Andrews C ( 2001): Reward and punishment representations in the human orbitofrontal cortex. Nat Neurosci 4: 95–102. [DOI] [PubMed] [Google Scholar]
- Paquette V, Levesque J, Mensour B, Leroux JM, Beaudoin G, Bourgoin P Beauregard M ( 2003): “Change the mind and you change the brain”: effects of cognitive‐behavioral therapy on the neural correlates of spider phobia. Neuroimage 18: 401–409. [DOI] [PubMed] [Google Scholar]
- Phan KL, Wager T, Taylor SF ( 2002): Functional neuroanatomy of emotion: a meta‐analysis of emotion activation studies in PET and fMRI. Neuroimage 16: 331–348. [DOI] [PubMed] [Google Scholar]
- Phan KL, Taylor SF, Welsh RC, Ho SH, Britton JC, Liberzon I ( 2004): Neural correlates of individual ratings of emotional salience: a trial‐related fMRI study. Neuroimage 21: 768–780. [DOI] [PubMed] [Google Scholar]
- Phan KL, Fitzgerald DA, Nathan PJ, Moore GJ, Uhde TW, Tancer ME ( 2005): Neural substrates for voluntary suppression of negative affect: a functional magnetic resonance imaging study. Biol Psychiatry 57: 210–219. [DOI] [PubMed] [Google Scholar]
- Posse S, Fitzgerald D, Gao K, Habel U, Rosenberg D, Moore GJ, Schneider F ( 2003): Real‐time fMRI of temporolimbic regions detects amygdala activation during single‐trial self‐induced sadness. Neuroimage 18: 760–768. [DOI] [PubMed] [Google Scholar]
- Rauch SL, Whalen PJ, Shin LM, McInerney SC, Macklin ML, Lasko NB, Orr SP, Pitman RK ( 2000): Exaggerated amygdala response to masked facial stimuli in posttraumatic stress disorder: a functional fMRI study. Biol Psychiatry 47: 769–776. [DOI] [PubMed] [Google Scholar]
- Ray RD, Ochsner KN, Cooper JC, Robertson ER, Gabrieli JD, Gross JJ ( 2005): Individual differences in trait rumination and the neural systems supporting cognitive reappraisal. Cogn Affect Behav Neurosci 5: 156–168. [DOI] [PubMed] [Google Scholar]
- Rosen BR, Bruckner RL, Dale AM ( 1998): Event‐related functional MRI: past, present, and future. Proc Natl Acad Sci U S A 95: 773– 780. [DOI] [PMC free article] [PubMed] [Google Scholar]
- Schaefer SM, Jackson DC, Davidson RJ, Aguirre GK, Kimberg DY, Thompson‐Schill SL ( 2002): Modulation of amygdalar acitivity by the conscious regulation of negative emotion. J Cogn Neurosci 14: 913–921. [DOI] [PubMed] [Google Scholar]
- Smith EE, Jonides J ( 1999): Storage and executive processes in the frontal lobes. Science 283: 1657–1661. [DOI] [PubMed] [Google Scholar]
- Spielberger CD, Gorsuch RL, Lushene PE ( 1970): Manual for the state‐trait anxiety inventory. Palo Alto, CA: Consulting Psychologist Press. [Google Scholar]
- Tzourio‐Mazoyer N, Landeau B, Papathanassiou D, Crivello F, Etard O, Delcroix N, Mazoyer B, Joliot M ( 2002): Automated anatomical labelling of activations in SPM using a macroscopic anatomical parcellation of the MNI MRI single‐subject brain. Neuroimage 15: 273–289. [DOI] [PubMed] [Google Scholar]
- Weiskopf N, Scharnowski F, Veit R, Goebel R, Birbaumer N, Mathiak K ( 2004): Self‐regulation of local brain activity using real‐time functional magnetic resonance imaging (fMRI). J Physiol Paris 98: 357–373. [DOI] [PubMed] [Google Scholar]
- Weissman DH, Warner LM, Woldorff MG ( 2004): The neural mechanisms for minimizing cross‐modal distraction. J Neurosci 24: 10941–10949. [DOI] [PMC free article] [PubMed] [Google Scholar]
- Worsley KJ, Marrett S, Neelin P, Vandal AC, Friston KJ, Evans AC ( 1996): A unified statistical approach for determining significant voxels in images of cerebral activation. Hum Brain Mapp 4: 58–73. [DOI] [PubMed] [Google Scholar]
- Yamasue H, Kasai K, Iwanami A, Ohtani T, Yamada H, Abe O, Kuroki N, Fukuda R, Tochigi M, Furukawa S, Sadamatsu M, Sasaki T, Aoki S, Ohtomo K, Asukai N, Kato N ( 2004): Voxel‐based analysis of MRI reveals anterior cingulate gray‐matter volume reduction in posttraumatic stress disorder due to terrorism. Proc Natl Acad Sci U S A 100: 9039–9043. [DOI] [PMC free article] [PubMed] [Google Scholar]