

Abstract
If fatigue in multiple sclerosis (MS) is related to an abnormal activation of the sensorimotor brain network, the activity of such a network should vary with varying fatigue. We studied 22 patients treated with interferon beta 1a (IFNβ‐1a; Avonex, Biogen, Cambridge, MA) with no fatigue (10) and with reversible fatigue (12). fMRI examinations were performed: 1) the same day of IFNβ‐1a injection (no fatigue; entry), 2) the day after IFNβ‐1a injection (fatigue; time 1), and 3) 4 days after IFNβ‐1a injection (no fatigue; time 2). Patients performed a simple motor task with the right, clinically unaffected hand. At time 1, compared with entry and time 2, MS patients with reversible fatigue showed an increased activation of the thalamus bilaterally. In MS patients without fatigue thalamus was more activated at entry than at time 1. In both groups at entry the primary SMC and the SMA were more activated than at times 1 and 2. At entry and time 1, when compared to patients with reversible fatigue, those without showed increased activations of the SII. Conversely, patients with reversible fatigue had increased activations of the thalamus and of several regions of the frontal lobes. An abnormal recruitment of the fronto‐thalamic circuitry is associated with IFNβ‐1a‐induced fatigue in MS patients. Hum Brain Mapp, 2007. © 2006 Wiley‐Liss, Inc.
Keywords: multiple sclerosis, functional magnetic resonance imaging, interferon beta‐1a, fatigue
INTRODUCTION
During the last decade, great effort has been devoted to achieve a better understanding of the pathophysiology of fatigue in multiple sclerosis (MS). Such understanding is central for the development of effective treatment to cure this common and troublesome symptom of the disease [Krupp et al., 1988]. Electrophysiological [Leocani et al., 2001; Sandroni et al., 1992; Sheean et al., 1997] and imaging [Filippi et al., 2002; Roelcke et al., 1997] studies have supported the hypothesis of a central origin of fatigue in MS. In particular, a functional MRI (fMRI) study of the motor system in MS patients with fatigue [Filippi et al., 2002] has demonstrated an altered recruitment of the brain sensorimotor network (including the thalamus, the cerebellum, the frontal lobes, and the cingulum) in fatigued MS patients. The correlation found between the extent of activity of some of these regions and the severity of the clinical fatigue score also supports this notion [Filippi et al., 2002]. Against this background, we reasoned that if fatigue in MS is related to an abnormal recruitment of brain sensorimotor regions, the activity of such regions should vary with varying fatigue complaint. To this end, we assessed whether short‐term movement‐associated changes of cortical activations were detectable in patients treated with interferon beta‐1a (IFNβ‐1a) (Avonex, Biogen, Cambridge, MA; 30 μg intramuscularly (i.m.) weekly) complaining of reversible fatigue after drug administration.
MATERIALS AND METHODS
Patients
Among the MS population with clinically definite MS [Poser et al., 1983] and a relapsing‐remitting (RR) course [Lublin and Reingold, 1996] treated with intramuscular IFNβ‐1a once a week (Avonex, 30 μg i.m. weekly) from at least 1 year attending the Outpatient Clinic of our department, we recruited patients with either no side effects after IFNβ‐1a injection or, alternatively, complaining of subjective reversible fatigue as the unique adverse reaction to drug administration during the past 3 months. Local Ethical Committee approval and written informed consent from all patients were obtained prior to study initiation. To be included patients also had to have: 1) no clinical relapses for at least 6 months prior to study entry; 2) no other major medical conditions and no substance abuse; 3) no concomitant therapy with antidepressant, psychoactive, steroid, immunomodulant/immunosuppressive drugs as well as other drugs that can be used for the treatment of fatigue (e.g., amantadine); 4) no complaint of mood or sleep disorders and no evidence of depression (the Montgomery and Asberg Depression Rating Scale [Montgomery and Asberg, 1979] was administered to all subjects and all of them had to have a score ≤16); 5) no previous symptoms, based on clinical history, and completely normal functioning of the right upper and lower limbs.
We recruited 22 patients with right‐hand dominance (17 women and 5 men). In all patients, disability was evaluated using the Expanded Disability Status Scale (EDSS) [Kurtzke, 1983] and fatigue was assessed using the Fatigue Severity Scale (FSS) [Krupp et al., 1989]. This is a nine‐statement interview with a seven‐point scale response per statement. We calculated a global score by summing up the values obtained at each individual item of the scale [Filippi et al., 2002; Leocani et al., 2001]. Patients who had an FSS score of 25 1 day after IFNβ‐1a injection (mean + 2 SD from our normative data obtained from 46 sex‐ and age‐matched healthy volunteers) or higher were considered as having reversible fatigue [Filippi et al., 2002; Leocani et al., 2001]. All patients were assessed clinically by a single neurologist, who was unaware of the MRI and fMRI results.
Functional Assessment
Right limb motor functional assessment was performed in all the subjects on the same day of fMRI acquisitions. For the upper limbs, the nine‐hole peg test (9‐HPT) and the maximum finger‐tapping frequency were used [Herndon, 1997]. The maximum finger‐tapping rate was observed for two 30‐s trial periods outside the magnet and the mean frequency to the nearest 0.5 Hz entered the analysis. For the right lower limbs, the maximum foot‐tapping frequency was used [Reddy et al., 2000]. No difference was found in the performance of these tests between MS patients with and without reversible fatigue (Table I).
Table I.
Main demographic and clinical characteristics of MS patients without and with reversible fatigue after IFNβ‐1a injection
| MS patients without fatigue | MS patients with reversible fatigue | |
|---|---|---|
| Mean age (range) | 33.1 (21–44) | 34.1 (22–42) |
| Median disease duration (range) | 5.0 (2–11) | 6.0 (2–15) |
| Median EDSS score (range) | 1.0 (0.0–2.0) | 1.0 (0.0–3.0) |
| Mean time to complete the nine‐hole peg test (range) [sec] | 20.2 (17–22) | 22.0 (19–24) |
| Mean maximum finger tapping rate (range) [/sec] | 3.5 (2.5–3.8) | 3.5 (2.6–3.8) |
| Mean maximum foot tapping rate (range) [/sec] | 3.1 (2.6–3.8) | 3.2 (2.6–4.0) |
| Mean IFN beta‐1a treatment duration (range) [years] | 2.5 (1–4) | 3.4 (1.5–5) |
| Entry mean FSS score (range) | 24 (11–23) | 23 (11–24) |
| Time 1 mean FSS score (range) | 21 (9–23) | 41 (29–59) |
| Time 2 mean FSS score (range) | 21 (9–23) | 22 (9–24) |
FSS, fatigue severity scale; EDSS, expanded disability status scale; MS, multiple sclerosis; IFN, interferon; SD, standard deviation. For statistical analysis, see text.
Experimental Design
Using a block design (ABAB), where epochs of activation were alternated with epochs of rest (each period of activation and rest consisting of five measurements), all patients performed two different tasks (to test result reproducibility), each of them consisting of 60 measurements. Task 1 consisted of repetitive flexion‐extension of the last four fingers of the right hand moving together. Task 2 consisted of repetitive flexion‐extension of the right hand and right foot, in a phasic manner. During scanning, all tasks were paced by a metronome at a 1‐Hz frequency. To correct for intersession variability of fMRI activations, during each fMRI session each task was repeated twice. Patients were trained before performing the experiments. Subjects were instructed to keep their eyes closed during fMRI acquisition and were monitored visually during scanning to ensure accurate task performance and to assess for additional (e.g., mirror) movements. Tasks were performed adequately by all subjects.
fMRI Acquisition
Each patient underwent three fMRI examinations: 1) on the same day of IFNβ‐1a injection, but before it, when no patient was fatigued (entry/time 0); 2) the day after IFNβ‐1a injection, when some patients were fatigued (time 1); and 3) 4 days after IFNβ‐1a injection, when, again, no patient was fatigued (time 2). Body temperature was measured in all patients before fMRI acquisition at time 1; there was no statistical difference between the two groups of patients (mean body temperature ± SD: 36.4 ± 0.5°C in nonfatigued MS patients vs. 36.2 ± 0.6°C in fatigued MS patients, P = n.s.). For within‐group comparisons, each patient served as his/her own control. Brain MRI scans were obtained using a 1.5 T machine (Vision, Siemens, Erlangen, Germany). Sagittal T1‐weighted images were acquired to define the anterior–posterior commissural (AC‐PC) plane. Functional MR images were acquired using a T2*‐weighted echo‐planar imaging (EPI) sequence (TE = 66 ms, flip angle = 90°, matrix size = 128 × 128, field of view = 256 × 256 mm, TR = 5.5 s). Twenty‐four axial slices, parallel to the AC‐PC plane, with a thickness of 5 mm, covering the whole brain were acquired during each measurement. Shimming was performed for the entire brain using an auto‐shim routine, which yielded satisfactory magnetic field homogeneity.
Structural MRI Acquisition
Using the same magnet, the following sequences of the brain were also acquired: 1) dual‐echo turbo spin echo sequence (TSE) (TR = 3300 ms, first echo TE = 16 ms, second echo TE = 98 ms, echo train length = 5), and 2) pulsed‐gradient spin‐echo (PGSE) echo‐planar sequence (inter‐echo spacing = 0.8, TE = 123), with diffusion gradients applied in 8 noncollinear directions, chosen in order to cover 3D space uniformly [Jones et al., 1999]. The duration and maximum amplitude of the diffusion gradients were 25 ms and 21 mTm−1, giving a maximum b factor in each direction of 1044 s mm−2. To optimize the measurement of diffusion only two b factors were used (b1 ≈ 0, b2 = 1044 s mm−2) [Bito et al., 1995]. Fat saturation was performed using a four radio frequency (RF) pulse binomial pulse train to avoid the chemical shift artifact. A birdcage headcoil of ∼300 mm diameter was used for RF transmission and for signal reception. For the TSE scans, 24 contiguous interleaved axial slices were acquired with 5 mm slice thickness, 256 × 256 matrix and 250 × 250 mm2 FOV. The slices were positioned to run parallel to a line that joins the most inferoanterior and inferoposterior parts of the corpus callosum [Miller et al., 1991]. For the PGSE scans, 10 axial slices with 5 mm slice thickness, 128 × 128 matrix and 250 × 250 mm2 FOV were acquired, with the same orientation as the dual echo scans, with the second‐to‐last caudal slice positioned to match exactly the central slices of the dual‐echo sets. This brain portion was chosen because the periventricular area is a common location for MS lesions. In addition, these central slices are less affected by the distortions due to B0 field inhomogeneity, which can affect image coregistration.
fMRI Analysis
All image postprocessing was performed on an independent computer workstation (Sun Sparcstation, Sun Microsystems, Mountain View, CA) by a single experienced observer, unaware of to whom the scans belonged and blinded to the structural MRI results. fMRI data were analyzed using statistical parametric mapping (SPM99) software [Friston et al., 1995]. Prior to statistical analysis, all images were realigned to the first one to correct for subject motion, spatially normalized into the standard space of SPM, and smoothed with a 10‐mm, 3D‐Gaussian filter.
Structural MRI Postprocessing
All structural MRI analysis was performed by a single experienced observer, unaware of to whom the scans belonged and blinded to the fMRI results. Brain lesions were identified on the proton‐density (PD)‐weighted scans (T2‐weighted images were always used to increase confidence in lesion identification), and lesion volumes were measured using a segmentation technique based on local thresholding, as previously described [Filippi et al., 2001]. Since the presence of T2 lesions in the pyramidal tracts was shown to affect the fMRI pattern of activations related to simple motor task performance [Rocca et al., 2004], the presence/absence of these lesions was also recorded in each patient. PGSE images were first corrected for distortion induced by eddy currents using an algorithm that maximizes mutual information between the diffusion unweighted and weighted images [Studholme et al., 1996]. Then the diffusion tensor was calculated and mean diffusivity (MD) and fractional anisotropy (FA) derived for every pixel, as previously described [Filippi et al., 2001]. The diffusion images were interpolated to the same image matrix size as the dual‐echo, and then the b = 0 step of the PGSE scans (T2‐weighted, but not diffusion‐weighted) were coregistered with the dual‐echo T2‐weighted images using a 3D rigid‐body coregistration algorithm based on mutual information [Studholme et al., 1996]. The final step consisted of automatic transfer of lesion outlines onto the MD and FA maps to calculate average lesion MD and FA. To study the MD and FA of normal‐appearing brain tissue (NABT), pixels lying inside lesion outlines were nulled out and MD and FA histograms of the NABT were produced [Filippi et al., 2001]. For each histogram, the average MD and FA and the peak height (i.e., the proportion of pixels at the commonest MD and FA value) were measured. Given the strong correlation existing between average histogram measures and the histogram peak location [Rovaris et al., 2001], the latter quantity was not considered for this study, in order to minimize the number of comparisons and, therefore, reduce the risk of type I errors.
Statistical Analysis
Changes in blood oxygenation level‐dependent (BOLD) contrast associated with the performance of the motor tasks were assessed on a pixel‐by‐pixel basis using the general linear model [Friston et al., 1995] and the theory of Gaussian fields [Worsley and Friston, 1995]. Specific effects were tested by applying appropriate linear contrasts. Significant hemodynamic changes for each contrast were assessed using t statistical parametric maps (SPMt). For the analysis, we obtained a mean contrast for each task at each session. The intragroup activations and comparisons between groups were investigated using a random‐effect analysis [Friston et al., 1999], with a one‐sample or two‐sample t‐test performed as appropriate. We also performed an analysis of interactions to investigate the effect of IFNβ‐1a on movement‐related activity during the fatigued session (time 1) in the fatiguing population relative to the other two sessions (entry and time 2) in comparison with the nonfatiguing population. For this analysis, the following contrast was performed: [time 1 activation −(entry+time 2 activation) fatiguing population] − [time 1 activation −(entry+time 2 activation) nonfatiguing population]. Within‐group activations were tested at a threshold of P < 0.05, corrected for multiple comparisons. For between‐group comparisons, cluster of voxels with a height threshold P < 0.001 (uncorrected) and an extent threshold P < 0.05 (corrected) were considered significant. The comparison of structural MRI derived metrics between MS patients with and without reversible fatigue was performed using a t‐test for not‐paired data. To assess the correlation of BOLD changes with quantities derived from structural MRI, these metrics were entered into the SPM design matrix using basic models and linear regression analysis [Friston et al., 1999]. Univariate correlations between FSS and structural MR metrics were investigated using the Spearman Rank Correlation Coefficient (SRCC).
RESULTS
Clinical and Structural MRI Findings
There were 12 patients complaining of reversible fatigue at time 1 and 10 patients without fatigue at any time point. Only one patient in each group had a mild motor impairment in the left upper limb, while three patients in the group complaining of reversible fatigue and one in that without fatigue had mild left lower limb motor impairment. The main demographic and clinical characteristics of the two groups of patients are shown in Table I. By definition, the only clinical variable that differed between the two groups was the mean FSS score at time 1 (P = 0.005). At time 1 no difference was found in the FSS between the two groups in domains not directly related to motor activity. The mean fatigue duration in those patients complaining of reversible fatigue was 11 h (SD 8 h). In Table II the main structural MRI quantities obtained in the two groups of patients are also shown. No difference was found for any of these quantities. Pyramidal tract lesions were seen in four patients complaining of reversible fatigue and in two patients without fatigue (this difference was not significant). No significant correlation was found between FSS and any of the above structural MRI metrics (data not shown).
Table II.
Main structural MRI characteristics of MS patients without and with reversible fatigue after IFNβ‐1a injection
| MS patients without fatigue | MS patients with reversible fatigue | |
|---|---|---|
| Mean dual‐echo lesion load (ml) (SD) | 6.3 (7.7) | 13.1 (15.4) |
| NABT average MD (SD) [×10−3 mm2 s−1] | 1.03 (0.06) | 1.05 (0.09) |
| NABT mean MD histogram peak height (SD) | 90.8 (9.7) | 85.8 (16.8) |
| NABT average FA (SD) | 0.18 (0.01) | 0.18 (0.01) |
| NABT mean FA histogram peak height (SD) | 54.2 (4.9) | 55.1 (6.4) |
NABT, normal appearing brain tissue; MD, mean diffusivity; FA, fractional anisotropy; MS, multiple sclerosis; SD, standard deviation. For statistical analysis, see text.
Functional MRI
All subjects performed the tasks correctly and no additional movements were observed during fMRI acquisition.
Within‐group comparisons
MS patients with reversible fatigue, task 1.
At time 1, compared with entry and time 2, MS patients with reversible fatigue showed increased activations of the thalamus bilaterally (SPM space coordinates: 16, −24, −8 and −14, −24, 2; t‐values: 6.79 and 6.58). At time 1, compared with time 2, they showed increased recruitment of the contralateral primary sensorimotor cortex (SMC) (SPM space coordinates: −16, −26, 68 and −60, −28, 44; t‐values: 4.38 and 4.03), and contralateral superior frontal sulcus (SFS) (SPM space coordinates: −28, −12, 62; t‐value: 4.12) (Fig. 1B). At entry, the ipsilateral primary SMC was more activated than at times 1 and 2 (SPM space coordinates: 56, −10, 38; t‐value: 9.32) (Fig. 1A).
Figure 1.
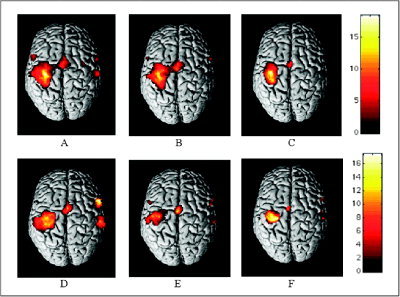
Cortical activations on a rendered brain (neurological convention) from MS patients with reversible fatigue after IFNβ‐1a injection (A–C) and MS patients without fatigue (D–F) during the performance of a simple motor task with their clinically unimpaired, fully normal functioning, and dominant right hands (within‐group analysis; one‐sample t‐test) at three time points: entry (A,D), time 1 (B,E), and time 2 (C,F). Activated foci are shown with a significance threshold set at P < 0.05, corrected for multiple comparisons (color‐coded t‐values). In both groups, a progressive decrease of the activation of the primary sensorimotor cortex, bilaterally, is visible. See text for further details.
MS patients with reversible fatigue, task 2.
At time 1, compared with entry and time 2, MS patients with reversible fatigue had an increased recruitment of the thalami (SPM space coordinates: 14, −4, 2 and −16, −24, 8; t‐values: 5.67 and 4.99) and basal ganglia (SPM space coordinates: 18, 18, −4 and −26, −6, −2; t‐values: 4.49 and 4.56). At time 1, compared with time 2, they showed increased activations of the primary SMC bilaterally (SPM space coordinates: −38, −30, 52 and 30, −32, 58; t‐values: 4.21 and 4.30) and the posterior portion of cingulate motor area (CMA) (SPM space coordinates: 0, −52, 28; t‐value: 4.99). At entry, the primary SMC, bilaterally, was more activated than at times 1 and 2 (SPM space coordinates: 54, −30, 52 and −56, −22, 48; t‐values: 5.40 and 5.34).
MS patients without reversible fatigue, task 1.
At time 1, compared with time 2, MS patients without fatigue showed increased activations of the contralateral secondary sensorimotor cortex (SII) (SPM space coordinates: −58, −18, 10; t‐value 6.03), and precentral gyrus (SPM space coordinates: −54, 4, 40; t‐value 5.84) (Fig. 1E). At entry, the primary SMC bilaterally (SPM space coordinates: 48, −32, 52 and −54, −26, 42; t‐values: 8.18 and 5.36) (Fig. 1D) and the ipsilateral inferior frontal gyrus (IFG) (SPM space coordinates: 56, 12, 12; t‐value: 4.99) were more activated than at times 1 and 2. In addition, compared with time 1, at entry there was also an increased recruitment of the contralateral cerebellum (SPM space coordinates: −30, −68, −34; t‐value: 5.79) and ipsilateral thalamus (SPM space coordinates: 18, −16, 6; t‐value: 4.64).
MS patients without reversible fatigue, task 2.
At time 1, compared with time 2, MS patients without fatigue showed an increased recruitment of the contralateral SFS (SPM space coordinates: −30, 50, 18; t‐value: 4.84). At entry, the primary SMC bilaterally (SPM space coordinates: 38, −36, 48 and −26, −26, 48; t‐values: 5.71 and 6.88) and contralateral cerebellum (SPM space coordinates: −24, −52, −34; t‐value: 5.68) were more activated than at times 1 and 2. In addition, when entry fMRI data were contrasted with time 1, there was also an increased recruitment of the thalamus bilaterally (SPM space coordinates: 20, −20, 6 and −16, −16, 4; t‐values: 8.17 and 5.22).
Between‐group comparisons
Task 1.
Table III reports the areas with an increased activation at the different time points in MS patients with reversible fatigue when contrasted with those without (Fig. 2). Table IV reports the areas with an increased activation at the different time points when the opposite contrast was performed.
Table III.
Brain areas that showed an increased activation at the different time points and during both motor tasks in MS patients with reversible fatigue when compared with those without
| Activation sites | Entry | Time 1 | Time 2 | ||||
|---|---|---|---|---|---|---|---|
| SPM space coordinates X, Y, Z | t‐values | SPM space coordinates X, Y, Z | t‐values | SPM space coordinates X, Y, Z | t‐values | ||
| Task 1 | L SMC | −52, −14, 48 | 5.8 | — | — | ||
| L thalamus | −6, −8, −8 | 4.49 | — | — | |||
| R thalamus | — | 22, −16, 8 | 4.57 | — | |||
| L SFS | −18, −38, 50 | 4.24 | — | — | |||
| L CMA | −8, 40, 24 | 4.11 | −8, 40, 32 | 3.94 | — | ||
| −6, 50, −8 | 4.28 | — | — | ||||
| B precuneus | 20, −70, 28 | 4.88 | — | — | |||
| −10, −68, 22 | 3.88 | — | — | ||||
| B MFG | — | 32, 30, 46 | 3.66 | — | |||
| — | 34, 26, 30 | 4.29 | — | ||||
| — | −42, 22, 28 | 4.81 | — | ||||
| — | 18, −12, 8 | 3.94 | — | ||||
| Task 2 | L SMC | −54, −14, 48 | 4.16 | −52, −12, 52 | 4.05 | — | |
| R basal ganglia | 22, 8, −8 | 4.71 | — | — | |||
| R thalamus | — | 18, −12, 8 | 4.35 | — | |||
| L precentral gyrus | — | −44, −4, 38 | 4.19 | — | |||
L, left; R, right; B, bilateral; SMC, primary sensorimotor cortex; SFS, superior frontal sulcus; CMA, cingulated motor area; MFG, middle frontal gyrus.
Figure 2.
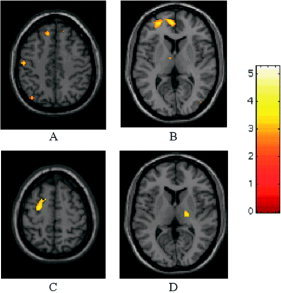
Relative cortical activations of MS patients with reversible fatigue after IFNβ‐1a injection during the performance of a simple motor task with their clinically unimpaired, fully normal functioning, and dominant right hands (two‐sample t‐test, height threshold P < 0.001 (uncorrected), extent threshold P < 0.05 (corrected)). At entry (A,B), compared to MS patients without fatigue, these patients showed increased recruitment of the contralateral primary SMC (A), thalamus (B), superior frontal sulcus (A,B), and cingulate motor area (B). At time 1 (C,D), compared with MS patients without fatigue, these patients showed increased recruitment of the ipsilateral thalamus (D), and contralateral middle frontal gyrus (C). Note that the activations have been superimposed on a high‐resolution T1‐weighted scan obtained from a single, healthy subject and normalized into standard SPM space (neurological convention).
Table IV.
Brain areas that showed an increased activation at the different time points and during both motor tasks in MS patients without reversible fatigue when compared with those who complained of fatigue
| Activation sites | Entry | Time 1 | Time 2 | ||||
|---|---|---|---|---|---|---|---|
| SPM space coordinates X, Y, Z | t‐values | SPM space coordinates X, Y, Z | t‐values | SPM space coordinates X, Y, Z | t‐values | ||
| Task 1 | L SMA | −8, −12, 60 | 4.85 | — | — | ||
| B postcentral gyrus | 28, −60, 56 | 3.81 | — | — | |||
| −48, −38, 58 | 4.91 | — | — | ||||
| B SII | 58, −38, 24 | 4.55 | — | — | |||
| −64, −38, 20 | 3.75 | −64, −20, −4 | 5.25 | — | |||
| L cerebellum | −28, −64, 20 | 4.12 | — | — | |||
| −34, −66, −34 | 3.80 | — | — | ||||
| Task 2 | L SPL | 24, −64, 50 | 3.81 | — | — | ||
| B cerebellum | 32, −74, −24 | 4.73 | — | — | |||
| −6, −62, −24 | 3.75 | — | — | ||||
| B SII | — | 66, −20, 34 | 4.77 | — | |||
| — | −56, −6, 10 | 4.07 | — | ||||
L, left; R, right; B, bilateral; SMA, supplementary motor area; SII, secondary sensorimotor cortex; SPL, superior parietal lobule.
Analysis of interaction between “change in patients with reversible fatigue” vs. “change in patients without reversible fatigue” during the fatiguing session in comparison with the other two sessions confirmed the aforementioned findings. In particular, compared with MS patients without fatigue, those complaining of reversible fatigue had an increased recruitment of the ipsilateral thalamus (SPM space coordinates: 22, −16, 4; t‐value: 4.32), contralateral CMA (SPM space coordinates: −8, 40, 30; t‐value 3.76), and regions located in the MFG, bilaterally (SPM space coordinates: 36, 32, 24; 34, 8, 2, 58; 18, −6, 60; −22, 34, 28 and −14, −10, 63; t‐values ranging from 3.65 to 4.12). They also showed increased recruitment of the primary SMC bilaterally (SPM space coordinates: −42, −14, 56 and 30, −32, 58; t‐values: 4.20 and 3.87) and of the SMA bilaterally (SPM space coordinates 2, −36, 54; t‐value: 4.32) (Fig. 3). On the contrary, compared with MS patients with reversible fatigue, those without had increased activations of the contralateral SII (SPM space coordinates: −60, −18, 4; t‐value: 4.53) (Fig. 3).
Figure 3.
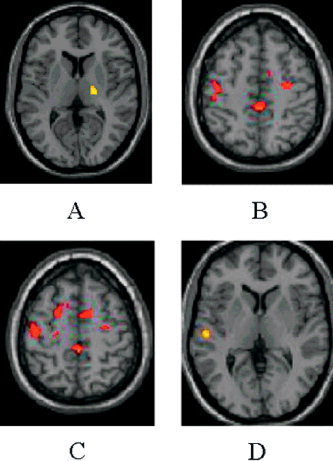
Results of the analysis of interaction between “change in patients with reversible fatigue” vs. “change in patients without reversible fatigue” during the fatiguing session in comparison with the other two sessions during the performance of a simple motor task with their clinically unimpaired, fully normal functioning, and dominant right hands (two‐sample t‐test, height threshold P < 0.001 (uncorrected), extent threshold P < 0.05 (corrected)). Compared to MS patients without fatigue (A–C), those complaining of reversible fatigue had an increased recruitment of the ipsilateral thalamus (A), CMA (B,C), bilateral MFG (B,C), primary SMC (B,C), and the SMA, bilaterally (B,C). Compared to MS patients with reversible fatigue (D), those without had increased activations of the contralateral SII (D). Note that the activations have been superimposed on a high‐resolution T1‐weighted scan obtained from a single, healthy subject and normalized into standard SPM space (neurological convention).
Task 2.
Table III reports the areas with an increased activation at the different time points in MS patients with reversible fatigue when contrasted with those without. Table IV reports the areas with an increased activation at the different time points when the opposite contrast was performed.
Analysis of interaction between “change in patients with reversible fatigue” vs. “change in patients without reversible fatigue” during the fatiguing session in comparison with the other two sessions confirmed the aforementioned findings. In particular, when fMRI data from MS patients with reversible fatigue were contrasted with fMRI data from those without, increased activations of the thalamus bilaterally (SPM space coordinates: 16, −14, 6 and −20, −22, 4; t‐values: 4.45 and 4.12), contralateral primary SMC (SPM space coordinates: −24, −26, 52; t‐value: 4.34), and contralateral precentral gyrus (SPM space coordinates: −44, −4, 38; t‐value: 3.89) were found. On the contrary, when MS patients without reversible fatigue were contrasted with those with, the former group had increased recruitment of the contralateral SII (SPM space coordinates: −54, −6, 10; t‐value: 4.57).
Correlations between fMRI and Structural MRI Findings
During both tasks, no correlation was found between structural MRI metrics and the extent of recruitment of brain‐activated areas.
DISCUSSION
Neurophysiologic [Leocani et al., 2001; Sandroni et al., 1992; Sheean et al., 1997], proton MR spectroscopy (1H‐MRS) [Tartaglia et al., 2004], PET [Roelcke et al., 1997], and fMRI [Filippi et al., 2002] studies have convincingly shown that MS‐related fatigue is likely to have a central origin. In detail, electrophysiological studies have suggested an impaired input to the primary motor cortex secondary to a damage/dysfunction of circuitries involved in motor planning [Sandroni et al., 1992; Sheean et al., 1997]. In line with this, the assessment of the EEG oscillations related to voluntary movements in MS patients has shown an involvement of cortical structures associated with motor programming and a failure of the inhibitory intracortical mechanisms acting after movement termination [Leocani et al., 2001]. More recently, using 1H‐MRS, a reduced N‐acetylaspartate (NAA)/creatine (Cr) ratio has been found in MS patients complaining of fatigue when compared with nonfatigued MS patients, suggesting an association between fatigue and diffuse axonal dysfunction in MS [Tartaglia et al., 2004]. Using PET, a reduced glucose metabolism in the frontal cortex and in the basal ganglia of fatigued MS patients compared with nonfatigued patients was found [Roelcke et al., 1997], suggesting the involvement in the former group of the cortico‐subcortical dorsolateral prefrontal pathway related to motor programming and executive functions. These results have been confirmed by an fMRI study [Filippi et al., 2002] of the motor system in MS, which showed a decreased recruitment of several regions of the frontal lobes, basal ganglia, and thalamus in fatigued MS patients, which was strictly related to the severity of fatigue.
All these studies evaluated MS patients with stable and chronic fatigue. Nevertheless, it is well known that MS‐related fatigue can be reversible, for instance, in patients treated with IFNβ‐1a [Filippini et al., 2003; Neilley et al., 1996; Walther and Hohlfeld, 1999]. In this study, to further clarify our understanding of the pathophysiology of fatigue in MS, we assessed the short‐term changes of brain activations in patients complaining of this symptom exclusively after weekly injection of IFNβ‐1a. We chose to study these patients because the weekly frequency of administration enabled us to investigate fMRI changes before and after the appearance of fatigue. Admittedly, patients with reversible fatigue had higher dual‐echo lesion loads than patients without reversible fatigue; however, this difference was not statistically significant. As a consequence, we believe that this variable should not have influenced our results a great deal. Another variable that might have influenced our results is the presence of lesions along the cortico‐spinal tracts. Although only a minority of our patients had lesions in the brain portion of this pathway, spinal cord imaging was not performed, due to time constraints. Therefore, we can not exclude an involvement of the cord portion of the cortico‐spinal tracts in our patients, which might have had some influence on our results as well [Rocca et al., 2003].
Despite these limitations, we showed a progressive reduction of the activation of the primary SMC during follow‐up, independently of the presence/absence of fatigue, in the two groups of patients. This is in line with studies performed in healthy individuals showing that the stereotyped repetition of a simple hand movement leads to cortical adaptation [Dirnberger et al., 2004; Karni et al., 1995; Morgen et al., 2004a]. In particular, the repetition of a simple sequence within a brief time window, as was the case for the present study, typically results in a reduced recruitment of the primary SMC, due to habituation [Dirnberger et al., 2004; Karni et al., 1995; Morgen et al., 2004a]. More recently [Morgen et al., 2004a], a change in the degree of activation of the parietal lobe from healthy volunteers has also been described after motor training. Such changes were not found in MS patients [Morgen et al., 2004b]. On the contrary, we showed a time‐related modification of cortical activations also in patients with MS. Differences in the setting of the fMRI experiments and in the statistical analysis might contribute to explain the discrepancy between our findings and previous observations [Morgen et al., 2004b]. However, considering that, at present, a large effort is being devoted to elucidate the mechanisms of functional recovery in several neurological conditions, including MS and stroke [Calautti and Baron, 2003; Filippi and Rocca, 2004], further longitudinal fMRI studies are needed to clarify the neurophysiological substrates of task repetition effects.
The within‐group analysis of fMRI changes in this study also showed different patterns of brain recruitment in MS patients with and without reversible fatigue. In particular, during both tasks, MS patients with reversible fatigue after IFNβ‐1a injection showed increased activations of the basal ganglia (thalami and/or lenticular nuclei). Conversely, in MS patients without reversible fatigue, before IFNβ‐1a injection, the thalamus was more activated, as well as the cerebellum. At time 1, changes in the pattern of activations of some frontal areas (e.g., the precentral gyrus and the SFG) and SII of these patients were also observed.
The between‐group comparison of fMRI activations confirmed the results of the within‐group analysis and demonstrated additional differences in the pattern of activations between the two groups of patients. In particular, compared to MS patients with reversible fatigue, those without tended to have an increased recruitment of the SII, cerebellum, and several regions in the parietal lobes (e.g., the postcentral gyrus and the SPL). Conversely, MS patients with reversible fatigue showed increased activations of the primary SMC, basal ganglia, thalami, SMA, CMA, and several regions located in the frontal lobes. Although all these regions are part of the human brain sensorimotor network, each of them has a specific role in movement execution. SII is considered to function as a high‐order processing area for somatosensory perception, and its activation seems also to be related to attention, manual dexterity, and coordination [Hamalainen et al., 2000; Karhu and Tesche, 1999]. The parietal cortex is formed by a multiplicity of independent areas, each of which deals with specific aspects of sensory information [Rizzolatti et al., 1997]. The cerebellum has a somatotopic organization of the movements [Nitschke et al., 1996], and its activation has been related to motor imagery [Grafton et al., 1996] and motor learning [Sakai et al., 1998]. The frontal cortex contains many areas contributing to the motor network [Picard and Strick, 1996; Rizzolatti and Luppino, 2001]. The rostral portion of the frontal cortex has essentially cognitive function, whereas the caudal portion is related to the control of movements [Picard and Strick, 1996; Rizzolatti and Luppino, 2001]. The SMA contributes to preparation, coordination, temporal course, and execution of movements [Lee et al., 1999; Ohara et al., 2000; Sadato et al., 1997]. CMA activation has been found to be related to presentation of new motor tasks and perhaps reflects relative task difficulty [Jenkins et al., 1994; Paus et al., 1993; Rao et al., 1993]. It is worth noting that basal ganglia, thalamus, and the frontal lobes are part of an associative loop considered to be involved in the genesis of central fatigue [Chaudhuri and Behan, 2000].
Considering that baseline fatigue severity did not differ between the two groups of patients, our results would suggest a paroxysmal influence of IFNβ‐1a. However, given the fact that all the patients included were treated with IFNβ‐1a for at least 1 year, we cannot provide definitive answers as to whether baseline variability in fMRI parameters between the two groups is a reflection of differences related to the pharmacogenomics of IFNβ‐1a and, in particular, to the effect that this drug exerts on the cytokine system or, conversely, are secondary to intrinsic disease‐related differences. Albeit the study of baseline fMRI characteristics of patients complaining of IFNβ‐1a‐induced fatigue after a drug holiday or the study of the fMRI changes induced by IFNβ‐1a in healthy individuals might contribute to answer this question, we did not perform such additional experiments on the basis of ethical considerations.
Several factors might be advocated to explain the discrepancies between the findings of this study (increased activation of basal ganglia, thalami, and frontal lobes) and those of previous studies aimed at investigating the neuronal basis of fatigue in MS (reduced activation of basal ganglia, thalami, and frontal lobes) [Filippi et al., 2002; Roelcke et al., 1997]. First, all the patients of the previous studies had established, chronic fatigue, and did not complain of reversible fatigue, likely related to IFNβ treatment. Second, to avoid possible bias related to IFNβ treatment on fatigue, in our previous study [Filippi et al., 2002] we recruited only patients who were not treated with immunomodulatory drugs. Finally, whereas patients of the previous studies were compared with healthy subjects, in the present study we compared the brain patterns of activations between two groups of patients. As a consequence, we cannot speculate as to whether the patterns of activations we observed are similar or dissimilar to those of healthy controls.
Nevertheless, by combining the results of this study with those of the previous ones [Filippi et al., 2002; Roelcke et al., 1997], it is a tempting speculation to suggest that some MS patients might have an increased susceptibility to fatigue, which is related to a different sensorimotor circuitry recruitment during the performance of motor activity. In particular, it seems likely that potentially fatigable MS patients tend to have a baseline “overactivation” of the basal ganglia, frontal lobes, and cingulum. With time, this “overactivation” might result in a depletion of the functional properties of these regions and in their inability to undergo the dynamic changes observed in MS patients without reversible fatigue and, as a consequence, lead to the onset of “chronic” fatigue. Albeit we recognize that only longitudinal studies on patients developing established fatigue can definitively prove this hypothesis, we also believe that our results are robust, since they have been obtained by the analysis of two different motor tasks.
REFERENCES
- Bito Y, Hirata S, Yamamoto E (1995): Optimal gradient factors for ADC measurements. Proc Int Soc Mag Reson Med 2: 913. [Google Scholar]
- Calautti C, Baron JC (2003): Functional neuroimaging studies of motor recovery after stroke in adults: a review. Stroke 34: 1553–1566. [DOI] [PubMed] [Google Scholar]
- Chaudhuri A, Behan PO (2000): Fatigue and basal ganglia. J Neurol Sci 179: 34–42. [DOI] [PubMed] [Google Scholar]
- Dirnberger G, Duregger C, Lindinger G, Lang W (2004): Habituation in a simple repetitive motor task: a study with movement‐related cortical potentials. Clin Neurophysiol 115: 378–384. [DOI] [PubMed] [Google Scholar]
- Filippi M, Rocca MA (2004): Cortical reorganisation in patients with MS. J Neurol Neurosurg Psychiatry 75: 1087–1089. [DOI] [PMC free article] [PubMed] [Google Scholar]
- Filippi M, Cercignani M, Inglese M, Horsfield MA, Comi G (2001): Diffusion tensor magnetic resonance imaging in multiple sclerosis. Neurology 56: 304–311. [DOI] [PubMed] [Google Scholar]
- Filippi M, Rocca MA, Colombo B, Falini A, Codella M, Scotti G, Comi G (2002): Functional magnetic resonance imaging correlates of fatigue in multiple sclerosis. Neuroimage 15: 559–567. [DOI] [PubMed] [Google Scholar]
- Filippini G, Munari L, Incorvaia B, Ebers GC, Polman CH, D'Amico R, Rice G (2003): Interferons in relapsing remitting multiple sclerosis: a systematic review. Lancet 361: 545–552. [DOI] [PubMed] [Google Scholar]
- Friston KJ, Holmes AP, Poline JB, Grasby PJ, Williams SC, Frackowiack RS, Turner R (1995): Analysis of fMRI time‐series revisited. Neuroimage 2: 45–53. [DOI] [PubMed] [Google Scholar]
- Friston KJ, Holmes AP, Price CJ, Buchel C, Worsley KJ (1999): Multisubject fMRI studies and conjunction analyses. Neuroimage 10: 385–396. [DOI] [PubMed] [Google Scholar]
- Grafton ST, Arbib MA, Fadiga L, Rizzolatti G (1996): Localization of grasp representations in humans by positron emission tomography. 2. Observation compared with imagination. Exp Brain Res 112: 103–111. [DOI] [PubMed] [Google Scholar]
- Hamalainen H, Hiltunen J, Titievskaja I (2000): fMRI activations of SI and SII cortices during tactile stimulation depend on attention. Neuroreport 11: 1673–1676. [DOI] [PubMed] [Google Scholar]
- Herndon RM ( 1997): Handbook of neurologic rating scales. New York: Demos Vermande. [Google Scholar]
- Jenkins IH, Brooks DJ, Nixon PD, Frackowiak RS, Passingham RE (1994): Motor sequence learning: a study with positron emission tomography. J Neurosci 14: 3775–3790. [DOI] [PMC free article] [PubMed] [Google Scholar]
- Jones DK, Horsfield MA, Simmons A (1999): Optimal strategies for measuring diffusion in anisotropic systems by magnetic resonance imaging. Magn Reson Med 42: 515–525. [PubMed] [Google Scholar]
- Karhu J, Tesche CD (1999): Simultaneous early processing of sensory input in human primary (SI) and secondary (SII) somatosensory cortices. J Neurophysiol 81: 2017–2025. [DOI] [PubMed] [Google Scholar]
- Karni A, Meyer G, Jezzard P, Adams MM, Turner R, Ungerleider LG (1995): Functional MRI evidence for adult motor cortex plasticity during motor skill learning. Nature 377: 155–158. [DOI] [PubMed] [Google Scholar]
- Krupp LB, Alvarez LA, La Rocca NG, Scheinberg LC (1988): Fatigue in multiple sclerosis. Arch Neurol 45: 435–437. [DOI] [PubMed] [Google Scholar]
- Krupp LB, La Rocca NG, Muir‐Nash J, Steinberg AD (1989): The fatigue severity scale. Application to patients with multiple sclerosis and systemic lupus erythematosus. Arch Neurol 46: 1121–1123. [DOI] [PubMed] [Google Scholar]
- Kurtzke JF (1983): Rating neurological impairment in multiple sclerosis: en expanded disability status scale (EDSS). Neurology 33: 1444–1452. [DOI] [PubMed] [Google Scholar]
- Lee KM, Chang KH, Roh JK (1999): Subregions within the supplementary motor area activated at different stages of movement preparation and execution. Neuroimage 9: 117–123. [DOI] [PubMed] [Google Scholar]
- Leocani L, Colombo B, Magnani G, Martinelli‐Boneschi F, Cursi M, Rossi P, Martinelli V, Comi G (2001): Fatigue in multiple sclerosis is associated with abnormal cortical activation to voluntary movement‐EEG evidence. Neuroimage 13: 1186–1192. [DOI] [PubMed] [Google Scholar]
- Lublin FD, Reingold SC, the National Multiple Sclerosis Society (USA) Advisory Committee on Clinical Trials of New Agents in Multiple Sclerosis (1996): Defining the clinical course of multiple sclerosis: results of an international survey. Neurology 46: 907–911. [DOI] [PubMed] [Google Scholar]
- Miller DH, Barkhof F, Berry I, Kappos L, Scotti G, Thompson AJ (1991): Magnetic resonance imaging in monitoring the treatment of multiple sclerosis: concerted action guidelines. J Neurol Neurosurg Psychiatry 54: 683–688. [DOI] [PMC free article] [PubMed] [Google Scholar]
- Montgomery SA, Asberg M (1979): A new depression scale designed to be sensitive to change. Br J Psychiatry 134: 382–389. [DOI] [PubMed] [Google Scholar]
- Morgen K, Kadom N, Sawaki L, Tessitore A, Ohayon J, Frank J, McFarland H, Martin R, Cohen LG (2004a): Kinematic specificity of cortical reorganization associated with motor training. Neuroimage 21: 1182–1187. [DOI] [PubMed] [Google Scholar]
- Morgen K, Kadom N, Sawaki L, Tessitore A, Ohayon J, McFarland HF, Frank J, Martin R, Cohen LG (2004b): Training‐dependent plasticity in patients with multiple sclerosis. Brain 127: 2506–2517. [DOI] [PubMed] [Google Scholar]
- Neilley LK, Goodin DS, Goodkin DE, Hauser SL (1996): Side effect profile of interferon beta‐1b in MS: results of an open label trial. Neurology 46: 552–554. [DOI] [PubMed] [Google Scholar]
- Nitschke MF, Kleinschmidt A, Wessel K, Frahm J (1996): Somatotopic motor representation in the human anterior cerebellum. A high‐resolution functional MRI study. Brain 119: 1023–1029. [DOI] [PubMed] [Google Scholar]
- Ohara S, Ikeda A, Kunieda T, Yazawa S, Baba K, Nagamine T, Taki W, Hashimoto N, Mihara T, Shibasaki H (2000): Movement‐related change of electrocorticographic activity in human supplementary motor area proper. Brain 123: 1203–1215. [DOI] [PubMed] [Google Scholar]
- Paus T, Petrides M, Evans AC, Meyer E (1993): Role of the human anterior cingulate cortex in the control of oculomotor, manual, and speech responses: a positron emission tomography study. J Neurophysiol 70: 453–469. [DOI] [PubMed] [Google Scholar]
- Picard N, Strick PL (1996): Motor areas of the medial wall: a review of their location and functional activation. Cereb Cortex 6: 342–353. [DOI] [PubMed] [Google Scholar]
- Poser CM, Paty DW, Scheinberg L, McDonald WI, Davis FA, Ebers GC, Johnson KP, Sibley WA, Silberberg GH, Tourtelotte WW (1983): New diagnostic criteria for multiple sclerosis: guidelines for research protocols. Ann Neurol 13: 227–231. [DOI] [PubMed] [Google Scholar]
- Rao SM, Binder JR, Bandettini PA, Hammeke TA, Yetzkin FAZ, Jesmanowicz A, Lisk LM, Morris GL, Mueller WM, Estkowski LD (1993): Functional magnetic resonance imaging of complex human movements. Neurology 43: 2311–2318. [DOI] [PubMed] [Google Scholar]
- Reddy H, Narayanan S, Matthews PM, Hoge RD, Pike GB, Duquette P, Antel J, Arnold DL (2000): Relating axonal injury to functional recovery in MS. Neurology 54: 236–239. [DOI] [PubMed] [Google Scholar]
- Rizzolatti G, Luppino G (2001): The cortical motor system. Neuron 31: 889–901. [DOI] [PubMed] [Google Scholar]
- Rizzolatti G, Fogassi L, Gallese V (1997): Parietal cortex: from sight to action. Curr Opin Neurobiol 7: 562–567. [DOI] [PubMed] [Google Scholar]
- Rocca MA, Mezzapesa DM, Ghezzi A, Falini A, Agosta F, Martinelli V, Scotti G, Comi G, Filippi M (2003): Cord damage elicits brain functional reorganization after a single episode of myelitis. Neurology 28: 1078–1085. [DOI] [PubMed] [Google Scholar]
- Rocca MA, Gallo A, Colombo B, Falini A, Scotti G, Comi G, Filippi M (2004): Pyramidal tract lesions and movement‐associated cortical recruitment in patients with MS. Neuroimage 23: 141–147. [DOI] [PubMed] [Google Scholar]
- Roelcke U, Kappos L, Lechner‐Scott J, Brunnschweiler H, Huber S, Ammann W, Plohmann A, Dellas S, Maguire RP, Missimer J, Radu EW, Steck A, Leenders KL (1997): Reduced glucose metabolism in the frontal cortex and basal ganglia of multiple sclerosis patients with fatigue: a 18F‐fluorodeoxyglucose positron emission tomography study. Neurology 48: 1566–1571. [DOI] [PubMed] [Google Scholar]
- Rovaris M, Bozzali M, Santuccio G, Ghezzi A, Caputo D, Montanari E, Bertolotto A, Bergamaschi R, Capra R, Mancardi G, Martinelli V, Comi G, Filippi M (2001): In vivo assessment of the brain and cervical cord pathology of patients with primary progressive multiple sclerosis. Brain 124: 2540–2549. [DOI] [PubMed] [Google Scholar]
- Sadato N, Yonekura Y, Waki A, Yamada H, Ishii Y (1997): Role of the supplementary motor area and the right premotor cortex in the coordination of bimanual finger movements. J Neurosci 17: 9667–9674. [DOI] [PMC free article] [PubMed] [Google Scholar]
- Sakai K, Takino R, Hikosaka O, Miyauchi S, Sasaki Y, Putz B, Fujimaki N (1998): Separate cerebellar areas for motor control. Neuroreport 9: 2359–2363. [DOI] [PubMed] [Google Scholar]
- Sandroni P, Walker C, Starr A (1992): ‘Fatigue’ in patients with multiple sclerosis. Motor pathway conduction and event‐related potentials. Arch Neurol 49: 517–524. [DOI] [PubMed] [Google Scholar]
- Sheean GL, Murray NM, Rothwell JC, Miller DH, Thompson AJ (1997): An electrophysiological study of the mechanism of fatigue in multiple sclerosis. Brain 120: 299–315. [DOI] [PubMed] [Google Scholar]
- Studholme C, Hill DLG, Hawkes DJ (1996): Automated three‐dimensional registration of magnetic resonance and positron emission tomography brain images by multiresolution optimization of voxel similarity measures. Med Phys 24: 25–35. [DOI] [PubMed] [Google Scholar]
- Tartaglia MC, Narayanan S, Francis SJ, Santos AC, De Stefano N, Lapierre Y, Arnold DL (2004): The relationship between diffuse axonal damage and fatigue in multiple sclerosis. Arch Neurol 61: 201–207. [DOI] [PubMed] [Google Scholar]
- Walther EU, Hohlfeld R (1999): Multiple sclerosis: side effects of interferon beta therapy and their management. Neurology 53: 1622–1627. [DOI] [PubMed] [Google Scholar]
- Worsley KJ, Friston KJ (1995): Analysis of fMRI time‐series revisited—again. Neuroimage 2: 173–181. [DOI] [PubMed] [Google Scholar]