

Abstract
MNI coordinates determined using SPM2 and FSL/FLIRT with the ICBM‐152 template were compared to Talairach coordinates determined using a landmark‐based Talairach registration method (TAL). Analysis revealed a clear‐cut bias in reference frames (origin, orientation) and scaling (brain size). Accordingly, ICBM‐152 fitted brains were consistently larger, oriented more nose down, and translated slightly down relative to TAL fitted brains. Whole brain analysis of MNI/Talairach coordinate disparity revealed an ellipsoidal pattern with disparity ranging from zero at a point deep within the left hemisphere to greater than 1‐cm for some anterior brain areas. MNI/Talairach coordinate disparity was generally less for brains fitted using FSL. The mni2tal transform generally reduced MNI/Talairach coordinate disparity for inferior brain areas but increased disparity for anterior, posterior, and superior areas. Coordinate disparity patterns differed for brain templates (MNI‐305, ICBM‐152) using the same fitting method (FSL/FLIRT) and for different fitting methods (SPM2, FSL/FLIRT) using the same template (ICBM‐152). An MNI‐to‐Talairach (MTT) transform to correct for bias between MNI and Talairach coordinates was formulated using a best‐fit analysis in one hundred high‐resolution 3‐D MR brain images. MTT transforms optimized for SPM2 and FSL were shown to reduced group mean MNI/Talairach coordinate disparity from a 5‐13 mm to 1‐2 mm for both deep and superficial brain sites. MTT transforms provide a validated means to convert MNI coordinates to Talairach compatible coordinates for studies using either SPM2 or FSL/FLIRT with the ICBM‐152 template. Hum Brain Mapp 2007. © 2007 Wiley‐Liss, Inc.
Keywords: spatial normalization, Talairach coordinates, MNI coordinates, reference frame bias, ICBM‐152 template, MNI‐305 template
INTRODUCTION
Spatial normalization is an important preprocessing step used to reduce intersubject anatomical variability in human brain mapping studies [Fox et al., 1995]. The most basic form of spatial normalization uses landmarks and a 9‐parameter affine transform to adjust position, orientation, and size of an individual brain to match a reference brain [Lancaster and Fox, 2000]. For many years, the 1988 Talairach Atlas brain [Talairach and Tournoux, 1988] served as the ad hoc standard for reporting locations of activation foci in functional brain mapping studies in part to its detailed anatomical labeling.
Automated spatial normalization using an average 3‐D brain image template to guide fitting has evolved as a popular alternative to earlier landmark‐based methods [Ashburner and Friston, 1999; Chau et al., 2005; Collins et al., 1994]. The initial template (MNI‐305) was an average of 305 3‐D MR brain image volumes, each registered to the 1988 Talairach Atlas brain [Evans et al., 1993; Collins et al., 1994]. The current template (ICBM‐152) was formulated using higher‐resolution MR images acquired as part of the ICBM project [Mazziotta et al., 1995, 2001a, b], each registered to the MNI‐305 template before averaging. Unfortunately, coordinates from brains spatially normalized using MNI/ICBM templates differ substantially from those of the Talairach standard [Brett et al., 2001, 2002; Carmack et al., 2004; Chau et al., 2005] (Fig. 1), and this disparity varies by location leading to confusion in interpretation and comparison.
Figure 1.

Midsagittal images of the same brain spatially normalized using SPM2 with the ICBM‐152 template (Left) and the Talairach method TAL (Right). Upper and lower dotted lines show differences in S–I size. The dotted arrow shows difference in A–P size. The middle dotted line approximates the AC–PC line in the TAL image.
MNI/Talairach coordinate disparity clearly impacts BrainMap [Fox et al., 1994, 1995, 1998] and Talairach Daemon (TD) [Lancaster et al., 1999] databases, both which are based on Talairach coordinates. Several functional image analysis software applications (AFNI, MedX, Turbofire) now use the TD database and its Talairach coordinate indexing methodology, so the coordinate disparity problem is certainly far‐reaching. Brett et al. (2001, 2002) formulated “mni2tal” transforms to adjust from MNI to Talairach coordinates (http://www.mrc-cbu.cam.ac.uk/Imaging/Common/mnispace.shtml). While several authors have used the mni2tal transforms in an attempt to make MNI coordinates Talairach compatible [Calder et al., 2001; Duncan et al., 2000; Pujol et al., 2004], these transforms were provided with cautionary statements and without validation.
MNI/Talairach coordinate disparity can be modeled as bias in reference frames (position, orientation) and scaling (size) of MNI fitted brains relative to Talairach template fitted brains. Affine coordinate transforms, commonly used to fit brain images to these brain templates, have individual parameters for adjusting these properties (translations for position, rotations for orientation, and scales for size). Analysis of affine transforms of MNI and Talairach fitted brains provides a means to synthesize MNI‐to‐Talairach (MTT) affine transforms that can be used to adjust reference frames and scaling to substantially reduce bias. In this study, we analyze a large group of normal brain images to formulate a best‐fit MTT transform and validate its use to reduce MNI/Talairach coordinate bias.
MNI Templates
The MNI‐305 template is available from the MNI McConnell Brain Imaging Center (BIC) web site (http://www.bic.mni.mcgill.ca), but differs from the MNI‐305 template provided with the SPM2 distribution (http://www.fil.ion.ucl.ac.uk/spm/software/spm2/). The MNI/BIC version has finer sampling (voxel spacing <1 mm) than the SPM2 version (2‐mm spacing). Based on dimensions estimated in Table I, the 2‐mm spacing SPM2 template (142, 180, 134 mm) is an adequate rendering of the more finely spaced BIC MNI‐305 templates (142, 181, 132 mm). The ICBM‐152 template replaced the MNI‐305 template with the release of SPM99. It was made using higher‐resolution 3‐D MR brain images (1‐mm3) acquired as part of the ICBM project [Mazziotta et al., 2001b] each registered to the MNI‐305 before averaging to maintain compatibility [Brett et al., 2002]. Average and smoothed 2‐mm spacing ICBM‐152 templates are provided with the SPM2 distribution (Table I). A deskulled version of the ICBM‐152 template is provided with the FSL distribution (http://www.fmrib.ox.ac.uk/fsl/). Since the ICBM‐152 template was spatially matched to the MNI‐305 template, coordinates produced using either template will be called MNI coordinates.
Table I.
Cerebral dimensions of brain templates
| Template | Source | Sampling | Brain dimensions (mm) | Volume ratio | ||
|---|---|---|---|---|---|---|
| L–R | A–P | S–I | ||||
| Talairach | 1988 Atlas | Variable | 136 | 172 | 118 | 1.000 |
| ICBM‐152 T1 average | FSL | 2 mm | 144 | 180 | 132 | 1.240 |
| ICBM‐152 T1 average | SPM2 | 2 mm | 144 | 180 | 132 | 1.240 |
| ICBM‐152 T1 smooth | SPM2 | 2 mm | 140 | 176 | 130 | 1.160 |
| MNI‐305 | MNI‐BIC | <1 mm | 142 | 181 | 132 | 1.229 |
| MNI‐305 average | SPM2 | 2 mm | 142 | 180 | 134 | 1.241 |
Templates for T1 weighted, T2 weighted, and proton density weighted images are available with the SPM2 distribution. The T1 weighted ICBM‐152 template was used to develop and validate MTT coordinate transforms. Since transformed brains might also differ due to fitting method, we investigated two popular automated spatial normalization software applications: (1) SPM2 and (2) the intermodality registration software FLIRT provided with FSL.
METHODS
Disparity in MNI and Talairach coordinates arises from various sources including differences in image types (average MRI vs. book atlas), differences in fitting methods (automated brain fitting using the MNI template vs. Talairach landmark‐based template fitting), and differences in coordinate reference frames (orientation and origin). A pseudotemplate image derived from the Talairach atlas and aligned with the MNI template might seem like a proper approach for developing a “mni2tal” transform [Brett et al., 2001, 2002]; however, there is no guarantee that MR brain images will fit the MNI template in the same manner as a pseudo‐Talairach template. Conversely, MNI and Talairach coordinates include all sources of disparity and served as the basis to determine best‐fit MTT transforms for this study.
Average Brain Template Cerebral Dimensions
Direct comparison between the cerebral dimensions that define the Talairach brain size (Table I) and corresponding dimensions for MNI templates is confounded by the lack of detail in the average brain templates. A 3‐D edge enhancement filter was used to improve clarity of brain borders for MNI template brains. Filtering was done using the 3 × 3 × 3 Sobel filter provided within MEDx (Sensor Systems, Sterling, Virginia). Sobel filtering produces high pixel values at brain borders where the grey‐scale 3‐D image gradient is maximal. Two‐dimensional local maxima filters were used to highlight x‐, y‐, and z‐directed maxima along brain borders. Filtered template images were inspected to determine cerebral bounding box dimensions. Processing was repeated to verify that dimensional estimates were reproducible for each template.
Brain Images
High‐resolution 3‐D T1‐weighted brain images from 100 normal subjects, each enrolled under the ICBM research protocol [Mazziotta et al., 2001b], were retrieved from a local ICBM image archive. All images were acquired with informed consent approved by the UTHSCSA institutional review board. The 100 MR images served as a test database of normal brains in the age range of 20–40 years (mean = 27.8 years; SD = 5.1 years). There were 52 males and 48 females, with approximately 1/7th being left handed (87 right/13 left). The group consisted of 70 Caucasian, 26 Hispanic, and 4 Afro‐American volunteers. Images were acquired on a 1.9 Tesla GE/Elscint Prestige MR imager using a 3‐D T1‐weighted spoiled gradient‐echo sequence (TR/TE = 24/6 ms, flip angle = 25°, NEX = 1, with flow comp). Slice direction was sagittal (190 mm) with a rectangular field of view 256 × 256 mm2 in the AP and SI directions. The 1‐mm isotropic spacing brain images were centered within a standard 2563 16‐bit integer array using a padding technique to simplify subsequent processing.
Talairach Registration
The Talairach registration method (TAL) has been used at the Research Imaging Center for over 10 years with 3‐D MR images and leads to coordinates with good correspondence to labels from the Talairach atlas [Lancaster et al., 1995, 1999, 2000]. Talairach registration uses standards and rules for consistent determination of reference frames (origin, orientation) and scale (brain size). The Talairach specified origin is a single anatomical landmark, at the intersection of posterior and superior margins of the anterior commissure (AC) on the midhemispheric plane. However, we used the center of the AC as the coordinate origin, since it can be more consistently determined in MR images and is less affected by differences in spatial resolution. The orientation is determined from unit vectors directed along +x and +y brain axes. The +y unit vector is parallel to the AC–PC line, arises from the AC, and directed anteriorly. The +x unit vector is perpendicular to the interhemispheric plane and directed to the right side of the brain. A third +z unit vector is formed as the vector cross product of the x‐ and y‐unit vectors and is directed superiorly. Collectively, these 3 unit vectors define the right‐handed Talairach reference frame. We use four landmarks within the midsagittal plane to determine the y‐axis since this approach is less affected by errors in AC/PC assignment or their anatomical variability and leads to a y‐axis that is consistently AC–PC oriented [Lancaster et al., 1995, 1999]. As in the Talairach atlas bounding cerebral dimensions of the aligned brain determine brain size. With high‐resolution MR images all landmarks needed for Talairach registration can be reproducibly determined. One person (DT‐G) performed all TAL registrations after training to ensure accurate and reproducible registration. Intraoperator reproducibility was good with standard deviations for landmarks consistently under 2 mm. The TAL method produced a9‐parameter, 4 × 4 affine transform matrix.
Automated Template Fitting
The smoothed average T1‐weighted ICBM‐152 template was used with SPM2 as recommended, and the unsmoothed deskulled average T1‐weighted ICBM‐152 template was used with FSL's FLIRT [Jenkinson et al., 2002]. Following suggested guidelines additional smoothing (FWHM = 8 mm) was applied to brain images when fitting using SPM2. FSL fitting used the default FLIRT (correlation‐ratio) cost function [Roche et al., 1998]. Twelve‐parameter affine transforms were used for both SPM2 and FSL methods. While these transforms include skew parameters, which are not needed for reference frame matching, skew parameters were included since many users of SPM2 and FSL also use them. The nonlinear transform feature of SPM2 [Friston et al., 1995] was not used, since it does not support direct affine mapping needed to formulate individual MTT coordinate transforms (Fig. 2). FSL preprocessing included deskulling the brain for each MR image using FSL's brain extraction tool (BET). Similar to TAL registration one person (DT‐G) performed template fitting after training to ensure proper use of the software. Both SPM2 and FSL produced 12‐parameter, 4 × 4 affine transform matrices.
Figure 2.

Individual MNI‐to‐Talairach (MTT) coordinate transforms. Each brain‐image volume (Braini) is transformed using SPM2, FSL, and Talairach (TAL) spatial normalization methods. Resulting 4 × 4 image‐to‐coordinate transforms [MNI]i and [TAL]i can be used to formulate exact individual 4 × 4 MNI‐to‐Talairach coordinate transforms [MTT]i.
MTT Transforms
Individual 4 × 4 affine transform matrices were determined for each of 100 brain image volumes using SPM2, FSL, and TAL template registration methods. Raw transforms were taken from “_sn.mat” files for SPM2, user‐saved transform matrix files for FSL, and “.aln” files for TAL, all in text format. These raw transforms were corrected for differences in coordinate sense and origins to support comparisons. We verified that our transform‐derived coordinates, calculated from the centroid of eight spherical landmarks, matched those reported using each of the three spatial normalization methods. Individual transforms from image‐to‐MNI coordinates (MNI) and from image‐to‐Talairach coordinates (TAL) were used to formulate individual MTT coordinate‐to‐coordinate transforms as MTT = TAL · MNI−1 for each of the 100 brains (Fig. 2). Translation, orientation, and scale parameters were extracted from the MNI and TAL matrices (Appendix) to analyze reference frame and scaling bias.
A single MTT transform was needed to support MTT coordinate conversion for more broad usage. This need led to the development of a MTT transform that would best fit a set of fixed landmarks by minimizing mean square error across 100 brains (see Fig. 3). We analyzed eight point landmarks for this procedure, one centered in each octant of the standard 2563 image matrix. These landmark positions were selected to avoid positional bias that might occur with brain‐based landmarks. MNI and Talairach coordinates of each of the eight landmarks were calculated for each subject using individual MNI and TAL coordinate transforms. A Moore–Penrose pseudoinverse least‐square error method [Penrose, 1955] was used to determine the 4 × 4 affine transform that best fit the full set of MNI coordinates to the corresponding set of TAL coordinates. Using more landmarks was tested but did not significantly improve precision of results.
Figure 3.

Best‐fit MNI‐to‐Talairach (MTT) coordinate transform. Image coordinates (i, j, k) for eight point landmarks (grey spheres) are transformed to Talairach (x″, y″, z″) and MNI (x′, y′, z′) coordinates using individual 4 × 4 [TAL]i and [MNI]i transforms. The MTT transform that best fits MNI to paired TAL coordinates for all 100 subjects is determined using the Moore–Penrose pseudoinverse method. Subscripts m,n are sphere number, brain number.
Site‐Specific Testing
Deep and superficial landmark sites were selected to directly measure coordinate disparity for the three fitting methods. Ten brain volumes were randomly selected for this testing. Image coordinates were recorded in transformed images for each of three spatial normalization methods at the AC, the PC, and at six cerebral extremities (anterior, posterior, left, right, superior, and inferior). Sites for each landmark were determined by visual inspection of the high‐resolution 3‐D MR brain images using SN software [Lancaster et al., 1995] by one individual (DT‐G). These landmarks were determined separately from those used for TAL spatial normalization.
Full‐Brain Testing
A full‐brain evaluation of differences between MNI and Talairach coordinates was done to investigate the spatial distribution of coordinate disparity. The Talairach Daemon (TD) served as the basis for visual comparison since each location within its 3‐D volume has an assigned Talairach coordinate. A binary 3‐D image of the TD was made, zero outside the brain and unity inside. MNI coordinates were estimated for each Talairach coordinate within this binarized image using an inverse best‐fit MTT transform matrix MTT −1. Disparity between estimated MNI coordinates and TAL coordinates was calculated as distance in millimeter for each TD coordinate. A mathematical model of coordinate disparity was formulated to predict key features of coordinate disparity (Appendix).
RESULTS
Template Brain Dimensions
Cerebral dimensions of template brains from MNI‐305 and ICBM‐152 templates were all larger than those for the 1988 Talairach atlas brain (Table I). The most striking difference was for the superior–inferior (S–I) dimension where MNI/ICBM template dimensions were ∼12% larger. Volume ratios, based on the product of dimensions, indicate that the ICBM‐152 template volume is ∼24% larger than the Talairach template volume. The smoothed average ICBM‐152 template was smaller than the unsmoothed average ICBM‐152. The MNI‐305 template volume ratio was similar to that for the ICBM‐152 average template. No attempt was made to correct for mismatched orientations between templates, so bounding volume ratios are approximations since dimensions of the Talairach atlas are defined in a standard orientation.
Individual Transform Analysis (N = 100 brains)
The largest difference between SPM2/FSL and TAL transform parameters was in z‐scale factors and rotation about the x‐axis (Table II), somewhat consistent with observations reported by others [Brett et al., 2001; Chau et al., 2005]. Differences in the mean orientation about the x‐axis of −3.5° for FSL and −5.3° for SPM2 are consistent with the more nose‐down orientation for SPM2/FSL fitted brain images (Fig. 1). As anticipated from head positioning variability, orientation variability about the x‐axis was largest; 3–4 times that for the y‐axis. An interesting finding is that net volume scaling for the TAL method was nearest to unity (1.055×). In fact, for the TAL method, mean scale factors for x and y were within 1% of unity, with the largest scale difference (+4%) for the z‐direction. Conversely, net volume scale factors for FSL and SPM2 using the ICBM‐152 template were larger, 1.294 and 1.349. Mean scale factors for both SPM2 and FSL were 5% above unity for x‐ and y‐directions and more than 10% above unity for the z‐direction. The FSL‐to‐TAL volume ratio of 1.227 was similar to the 1.240 value predicted from template dimensions alone (Table I), while that from SPM2 (1.279) was larger than the 1.160 value predicted from the smoothed template. The standard error of the mean for all scale factors was small (0.4–0.5%). All average scale parameters for the TAL method were near unity indicating that average brain dimensions for the 100 subjects were close to the dimensions of the Talairach atlas brain.
Table II.
Transform parameter analysis for spatial normalization by the manual Talairach (TAL) method, and by FSL and SPM2 methods using the ICBM‐152 template
| Method | Rotation (°) | Scale | Net scale | ||||
|---|---|---|---|---|---|---|---|
| x | y | z | x | y | z | ||
| TAL | 2.58 ± 6.63 | −0.10 ± 1.67 | 0.28 ± 2.90 | 1.012 ± 0.044 | 1.000 ± 0.042 | 1.040 ± 0.043 | 1.055 ± 0.102 |
| FSL | −0.98 ± 6.20 | −0.40 ± 1.72 | −0.21 ± 2.65 | 1.068 ± 0.045 | 1.052 ± 0.045 | 1.149 ± 0.040 | 1.294 ± 0.118 |
| SPM2 | −2.71 ± 5.63 | −0.96 ± 1.80 | 0.05 ± 2.86 | 1.091 ± 0.046 | 1.067 ± 0.043 | 1.156 ± 0.045 | 1.349 ± 0.130 |
Volume ratios are 1.227 for FSL/TAL and 1.279 for SPM2/TAL.
Data are mean ± SD (N = 100).
Correlations between TAL, SPM2, and FSL rotation and scale parameters were measured, and all correlation coefficients were significant and positive (ρA,B > 0.256; P < 0.01). Rotations about x‐, y‐, and z‐axes included negative and positive angles for all methods with the largest range of rotation about the x‐axis (−14 to +21° TAL; −16 to +15° FSL; −16 to +13° SPM2). Accordingly, rotations about the x‐axis had the highest correlations (ρFSL,TAL = 0.95; ρSPM2,TAL = 0.94). Linear regression for x‐axis rotations gave a slope of 0.89 for FSL vs. TAL nearer to unity slope than the 0.79 for SPM2 vs. TAL. Volume scaling for FSL correlated better with TAL (ρFSL,TAL = 0.95) than did SPM2 (ρSPM2,TAL = 0.78). The higher correlations for FSL rotation and scale parameters suggest that a best‐fit MTT transform might be more effective in reducing coordinate bias for FSL.
MTT Transform Analysis (N = 100)
Separate best‐fit MTT transforms were determined for SPM2 and FSL [Eqs. (1) and (2)]. The MTT transforms were decomposed into 12 parameters (Table III) to better assess reference frame and scale biases. This decomposition leads to a volume ratio estimate of 1.232 for FSL/TAL, similar to that predicted from template dimensions (1.240, Table I). The volume ratio of 1.288 for SPM2/TAL was larger than predicted from template dimensions (1.160) suggesting a potential template fitting bias for SPM2. Most of the scale difference between MNI and Talairach coordinates was due to z‐scale factors. All skew parameters were less than 1% indicating effective axis orthogonality for the MNI reference frame, an inherent property of the TAL reference frame. Similar to individual transform parameter analyses, a nose‐down rotation about the x‐axis of approximately 4–6° was indicated for the MNI reference frame relative to the Talairach reference frame. Other rotational differences were one degree or less.
 |
(1) |
 |
(2) |
Key findings for scale, x‐axis rotation, and z‐axis translation parameters in MTTFSL were similar to those estimated from data in Chau et al. [2005], who used a template‐matching approach and SPM99 with an in‐house formulated Talairach average brain template. A best‐fit MTT transform was also formulated pooling SPM2 and FSL data [Eq. (3)].
 |
(3) |
This transform can be used to substantially reduce coordinate bias for either SPM2 or FSL fitting methods.
Table III.
12‐Parameter decompositon of MTT transform matrices
| Transform | Translation (mm) | Rotation (°) | Scale | Skew | ||||||||
|---|---|---|---|---|---|---|---|---|---|---|---|---|
| x | y | z | x | y | z | x | y | z | Kxy | Kxz | Kyz | |
| MTTSPM2 | −1.02 | −1.77 | 4.09 | 5.65 | −0.97 | −0.30 | 0.925 | 0.936 | 0.897 | −0.0013 | 0.0047 | 0.0055 |
| MTTFSL | −1.07 | −1.02 | 3.18 | 3.92 | −0.34 | −0.50 | 0.946 | 0.950 | 0.903 | −0.0047 | −0.0035 | 0.0076 |
Translations and scales are along and positive rotations are CCW about x, y, and z axes. Skew for Kxy increases x as y increases. Volume ratios are 1.232 for FSL/TAL and 1.288 for SPM/TAL.
Disparity in mni2tal/MTT Transforms
When formulating the mni2tal transforms Brett et al. (2001, 2002) assumed that the MNI coordinate system origin matched that of the Talairach system, so no translation terms were provided. However, best‐fit MTT transforms show that the origin in the Talairach reference frame is nearly one‐half centimeter from the origin in the MNI reference frame casting doubt on the validity of that assumption. Brett et al. (2001, 2002) also assumed that the only difference in orientation was due to rotation about the x‐axis. Our study suggests that this was a reasonable assumption (Table III). Unfortunately, the x‐axis rotation in the mni2tal transforms is directed opposite to that of the best‐fit MTT transforms, producing a nose down rather than a nose up correction. A nose‐up rotation correction similar to that for the MTT transforms was also seen in the coordinate data from Chau et al. [2005]. Large differences in shape between the single Talairach atlas brain and the ICBM‐152 average brain template combined with restricted transform control made accurate alignment of reference frames virtually impossible, consistent with our findings. The disparity for mni2tal adjusted MNI coordinates varies throughout the brain, being worse than uncorrected MNI coordinates in some brain areas (anterior and superior) and better in inferior areas, i.e. the temporal lobe (Fig. 4).
Figure 4.
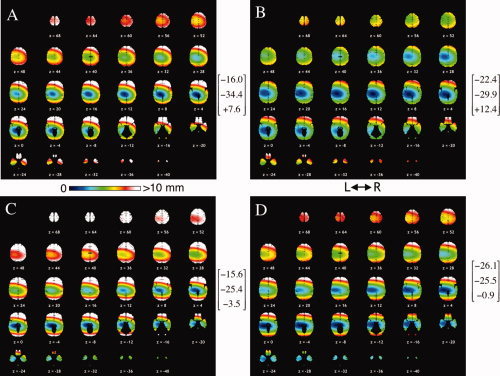
Coordinate disparity in the Talairach model of the cerebrum for SPM2 (A), FSL (B), mni2tal‐transformed SPM2 (C), and mni2tal FSL coordinates (D). X‐Y‐Z coordinates for no disparity points are provided in brackets. For mni2tal the z < 0 transform was used for no disparity calculations.
MNI‐305/ICBM‐152 Comparison
To investigate differences between the MNI‐305 and the ICBM‐152 template, we fitted a small number of brains to each template (N = 4). Preliminary analysis using the TAL fitting method showed a variety of brain sizes (one increased volume by 1%, one decreased 1%, and others increased by 14% and 32%) and orientations (x‐axis rotations ranged from −2° to +15°). The analysis was done using FSL with both non‐deskulled and deskulled templates. An x‐axis rotational difference (consistently more nose‐down) was seen for the MNI‐305 template in each of the four brains, (−4.4 ± 0.78)°. Volume‐scale factors were (13.8 ± 0.02)% smaller for the MNI‐305 template, mostly due to a smaller z‐scale (9.0 ± 0.01% smaller). Similar findings but of lesser magnitude (−3° rotation and 9% volume‐scale differences) were seen when fitting a deskulled MNI‐305 template to the deskulled ICBM‐152 and back. Brains fitted using the ICBM‐152 template were less nose‐down, but larger than those fitted using the MNI‐305 template. These data suggest that x‐axis rotation and z‐scale are inherently problematic when formulating average brain templates.
Site Specific Testing (N = 10)
As expected, the mean x‐y‐z coordinate in millimeters for the AC was closest to the theoretical value of (0, 0, 0) for the TAL method (−0.6, 0.4, −1.6) (Table IV). Mean AC coordinates for FSL (0.3, 1.4, −4.4) and SPM2 (−0.5, 1.4, −6.1) were well below the targeted z = 0 value, consistent with predictions from the best‐fit MTT transforms. The PC location was similar for all three methods. Coordinate variability for AC and PC was smallest for x, similar for y and z, and largest for the SPM2 method. Mean AC–PC orientation for the TAL method was 2.0° nose‐down from the theoretical value, though much closer to 0° than the 6.7° (FSL) and 9.4° (SPM2) nose‐down orientations. Best‐fit MTT transforms led to coordinate disparity at the AC and PC of ∼1 mm for both SPM2 and FLS (Table V), correcting for the primary disparity in reference frames due to z‐coordinate bias. Importantly, mean AC–PC orientation for both SPM2 and FSL was within 1° of TAL values after application of best‐fit MTT transforms, verifying the ability to reduce orientation bias.
Table IV.
Mean coordinates of landmarks following spatial normalization using SPM2, FSL, and TAL methods
| Landmark | SPM2a | FSLa | TAL | ||||||
|---|---|---|---|---|---|---|---|---|---|
| x | y | z | x | Y | z | x | y | z | |
| Anterior | 6.3 | 75.1 | 5.9 | 6.6 | 73.4 | 10.5 | 5.7 | 67.5 | 17.1 |
| Superior | 4.8 | −29.0 | 81.8 | 3.6 | −32.6 | 80.1 | 2.1 | −37.9 | 72.7 |
| Inferior | −6.6 | 1.2 | −52.4 | −4.4 | 3.1 | −49.7 | −4.9 | 5.4 | −43.2 |
| Posterior | −20.6 | −106.4 | 6.3 | −19.3 | −105.2 | 3.2 | −19.7 | −101.5 | −2.5 |
| Right | 73.7 | −26.0 | 7.0 | 72.7 | −25.4 | 8.3 | 68.3 | −26.9 | 8.3 |
| Left | −71.9 | −33.4 | 11.2 | −70.2 | −34.8 | 9.9 | −68.0 | −34.2 | 8.4 |
| AC | −0.5 (0.48) | 1.4 (0.85) | −6.1 (0.69) | 0.3 (0.25) | 1.4 (0.53) | −4.4 (0.48) | −0.6 (0.32) | 0.4 (0.39) | −1.6 (0.44) |
| PC | 0.1 (0.38) | −29.2 (0.53) | −1.0 (0.73) | 0.8 (0.23) | −29.1 (0.27) | −0.8 (0.43) | −0.2 (0.26) | −29.0 (0.41) | −0.6 (0.54) |
Mean coordinates in millimeters; N = 10 brains.
Standard error of mean for AC and PC in parentheses.
Bold indicates x, y, and/or z with disparity >5 mm.
Table V.
Distance (mm) between mean MNI and Talairach coordinates (coordinate disparity) for select landmark sites
| Landmark | SPM2 | FSL | ||||
|---|---|---|---|---|---|---|
| MNI | mni2tala | MTTb | MNI | mni2tala | MTTb | |
| Anterior | 13.6 ± 1.1 | 16.2 ± 1.3 | 1.3 ± 0.8 | 8.9 ± 0.7 | 11.7 ± 0.9 | 0.5 ± 0.4 |
| Superior | 13.0 ± 1.6 | 14.3 ± 1.6 | 2.7 ± 1.0 | 9.2 ± 1.2 | 10.3 ± 1.4 | 1.4 ± 0.9 |
| Inferior | 10.3 ± 1.2 | 6.8 ± 1.5 | 2.3 ± 0.9 | 7.0 ± 0.7 | 4.7 ± 1.0 | 1.8 ± 0.5 |
| Posterior | 10.2 ± 1.8 | 13.7 ± 1.7 | 2.6 ± 0.6 | 6.9 ± 1.3 | 10.7 ± 1.2 | 2.1 ± 0.6 |
| Right | 5.6 ± 0.9 | 5.1 ± 0.9 | 1.6 ± 0.9 | 4.6 ± 0.5 | 4.6 ± 0.6 | 1.5 ± 0.3 |
| Left | 4.9 ± 1.1 | 5.4 ± 1.1 | 1.8 ± 0.8 | 2.7 ± 0.9 | 3.0 ± 0.9 | 1.2 ± 0.8 |
| AC | 4.6 ± 0.7 | 3.6 ± 0.6 | 1.0 ± 0.5 | 3.0 ± 0.4 | 2.4 ± 0.4 | 1.0 ± 0.3 |
| PC | 0.6 ± 0.3 | 1.4 ± 0.3 | 1.4 ± 0.4 | 1.0 ± 0.3 | 1.9 ± 0.4 | 1.4 ± 0.4 |
Distance ± SE of the mean; N = 10 brains.
MNI coordinates transformed using the piecewise mni2tal transforms.
MNI coordinates transformed using the best‐fit MTT transforms.
MNI/TAL coordinate disparity at extremity landmarks varied by site and was consistently smaller for FSL than for SPM2. Largest disparities were seen for anterior, posterior, superior, and inferior extremity sites (Table V), mostly due to z‐component differences (Table IV). Anterior and posterior site disparities were attributed to large differences in x‐axis orientations. Superior and inferior site disparities were attributed to the differences in z‐scaling. The disparity for the right landmark was larger than for the left landmark and directed laterally. MNI coordinate adjustment using the mni2tal transform provided mixed results, mostly increasing disparity of anterior, posterior, and superior extremity landmarks and reducing disparity for inferior landmarks. Notably, landmark sites with disparities exceeding 7–13 mm were reduced to disparities of 1–2 mm in most cases by the best‐fit MTT transforms. These findings show that MNI/TAL coordinate bias associated with reference frame (position and orientation) and scale (brain size) can be substantially reduced using the best‐fit MTT transforms [Eqs. (1) and (2)]. These results support the use of best‐fit MTT transforms to reduce MNI/TAL coordinate bias in databases such as BrainMap and the Talairach Daemon.
Full‐Brain Disparity Analysis
The MNI/Talairach bias between reference frames and brain sizes leads to a complex pattern of coordinate disparity throughout the brain (Fig. 4). The first feature of interest is the no‐disparity site (centered in blue region), calculated using Eq. (A3). This is the location where various components of the MTT transform cancel, i.e. where MNI and TAL coordinates are equal. MNI and TAL coordinates are most consistent (disparity <2 mm) in the darker blue regions of Figure 4. The no‐disparity site for FSL was approximately one‐half centimeter superior, left, and anterior to that for SPM2. The mni2tal transform moved the no‐disparity site to a more inferior location for both SPM2 and FSL leading to increased disparity superiorly and decreased disparity inferiorly.
The second feature of interest in Figure 4 is the ellipsoidal shape of the disparity pattern, which has increasing disparity away from the no‐disparity site. The semimajor axis dimensions of the disparity ellipsoids in Table AI are the distances from the no‐disparity site where disparity has reached 1‐mm. The volume of brain within this ≤1‐mm disparity range was largest for FSL approximately twice that for SPM2. All disparity ellipsoids had smaller A–P and S–I dimensions indicating a more rapid change in coordinate disparity in these directions. As expected from site‐specific analyses (Table V) disparity was generally highest for anterior regions, lower on the left side, and less with FSL than SPM2. The mni2tal transform generally led to worse coordinate disparity for anterior, posterior, and superior regions and better disparity for inferior regions.
Table AI.
Semimajor axis dimensions (mm) of disparity ellipsoids arranged by size
| Transform | Large | Medium | Small |
|---|---|---|---|
| SPM2 mni2tal × SPM2 | 12.5 | 8.7 | 6.2 |
| 14.5 | 10.4 | 5.1 | |
| FSL mni2tal × FSL | 17.8 | 12.7 | 7.6 |
| 22.0 | 14.1 | 6.2 |
mni2tal calculations for z < 0 since null point was for z < 0.
DISCUSSION
MNI/Talairach Coordinate Disparity
Disparity between MNI and Talairach coordinates can lead to a displacement in the mean coordinate and increased spatial variability when analyzing data sets containing both MNI and Talairach coordinates. Formal studies of the relationship between MNI and Talairach coordinates have been hampered by the inability to make direct comparisons between MNI templates and the individual brain template of the 1988 Talairach atlas. Brett et al. (2001) attempted to evaluate template differences using a 3‐D Talairach brain model made from the Talairach Daemon, but the resulting mni2tal transform was not validated. Chau et al.(2005) recently studied MNI and Talairach coordinate differences increasing our understanding of MNI/Talairach coordinate disparity. However, their study mixed global affine with regional template registration methods, and regional methods can alter coordinates in a manner that cannot be accurately compared using global affine transforms. The present study uses only global affine transforms (Figures 2 and 3), which support direct estimation of the bias between MNI and Talairach coordinates due to differences in reference frames and brain sizes. These transforms lead to consistent mean coordinate calculations for groups containing both MNI and Talairach coordinates and can reduce spatial variability. MNI/Talairach coordinate corrections are especially important when performing analyses using an assortment of MNI and Talairach coordinates from databases such as BrainMap and the Talairach Daemon.
Average Brain Templates
A possible cause of MNI/Talairach coordinate disparity is incorrect Talairach registration during average brain template development. The initial step in the MNI‐305 template development registered 305 MR images into what was referred to as “stereotaxic space.” Although the MNI method targeted Talairach space, it used a fitting method with many landmarks rather than just those used to define the reference frame and brain size in the Talairach atlas. The difference in fitting methods possibly led to the observed disparity in orientation and size [Carmack et al., 2004]. Another possible cause of MNI/TAL coordinate disparity is that averaging brains following linear registration might lead to a template with features incongruent with those of individual brains (i.e. individual‐average brain or I–A disparity). For example, rotation and scale variability (errors) can lead to large absolute positional differences, which increase with increasing distance from the origin [5° error (9 mm displacement at 100 mm); 5% scale error (5 mm displacement at 100 mm)]. Combined with translational errors, the net result could be an average brain of unusual size and shape. The I–A disparity theory is supported by results of the template dimension study where all average brain templates were larger than the Talairach brain (Table I). I–A shape disparity might also explain why brains fit more nose‐down. However, I–A disparity does not explain why the ICBM‐152 template was less nose‐down than the MNI‐305 template. Causality of MNI/Talairach coordinate disparity remains a question.
The large differences in MNI/TAL coordinate disparity for SPM2 and FSL were major disappointment in this study (Table IV, Fig. 4). We suspect that these differences were mostly due to differences in brains and templates used in fitting (deskulled brain and template by FSL vs. full‐head image and template by SPM2). Differences in cost functions, additional smoothing of individual brains, and SPM2's use of a priori constraints are also possible contributors to the observed global spatial differences. Another disappointment was that the MNI‐305 and ICBM‐152 template brains also differed in orientation and scale. These findings raise concern about the robustness of coordinates determined using average brain templates, which can vary by both template and fitting software.
An affine transform could be used to adjust the ICBM‐152 template to match the reference frame and brain size features of the Talairach brain. The smoothness of average brain templates would be conserved ensuring continued template support for automated spatial normalization methods. Additionally, a Talairach standardized ICBM‐152 template would be closer in size to the average human brain, perhaps improving fit quality. While best‐fit MTT coordinate transforms provide a good starting point for developing a Talairach standardized ICBM‐152 template, transforms to optimally achieve this are different when applied before vs. after fitting and in dealing with image vs. coordinate transformation. Additionally, differences between SPM2 and FSL fitting algorithms need further clarification in order to reduce methodological biases. A pooled analysis such as was done to develop the pooled MTT in Eq. (3) might be appropriate to deal with this issue.
Coordinate Standardization
Since affine transforms can directly correct for differences in reference frames and scaling, it would be prudent to adopt a single template's standards for these features. We prefer the 1988 Talairach atlas standard, since standardized images can be readily verified, and it has been widely used by the human brain mapping community for many years. This approach to coordinate standardization supports existing as well as to‐be‐developed brain templates. Additionally, coordinate standardization can be used as a preprocessing step in the application of high degree‐of‐freedom transforms.
New 3‐D Brain Template
While affine transforms can manage differences in global anatomical features between an individual brain and a template brain, they cannot account for differences in finer anatomical detail (i.e. regional differences). This latter challenge is for high degree‐of‐freedom regional transforms. Unfortunately, neither the ICBM‐152 nor Talairach template is adequate for use with such regional transforms: the average ICBM‐152 template fails due to its excessive anatomical smoothness and the Talairach template fails due to its poor spatial sampling. A solution would be to develop a suitable 3‐D brain template using high‐detail 3‐D MR brain images. Analysis of a large number of MRI brain images could guide in the determination of a representative or median anatomical template. For such a template to be attractive, it should be provided with extensive metadata, such as accurately determined anatomical, functional, and cytoarchitectonic labels [Mazziotta et al., 2001a, b]. This is the challenge we now face.
CONCLUSIONS
MNI/Talairach coordinate disparity can be modeled as differences in reference frames and brain sizes. Large differences in coordinates were seen for brains transformed using different software packages (FSL and SPM2) with the same brain template (ICBM‐152) as well as different templates (MNI‐305 vs. ICBM‐152) with the same software package. The popular mni2tal transform provided decreased disparity inferiorly, but increased disparity in anterior, posterior, and superior regions. Best‐fit MTT coordinate transforms were formulated that substantially reduce disparity between MNI and Talairach coordinates throughout the brain.
Acknowledgements
Thanks to Pablo García‐Fernández, Ph.D., for his help with the analysis of disparity ellipsoids.
Analysis of 4 × 4 Affine Transform Matrices
Decomposition of 4 × 4 affine transform matrices (M) into 12 parameters was based on the following model equation:
 |
where Tx, Ty, and Tz are translation parameters, Kxy, Kxz, and Kyz skew parameters, Sx, Sy, and Sz scale parameters, and α, β, and θ are counter‐clockwise rotations about the positive x, y, and z axes in a right‐handed coordinate system. M was expanded to determine expressions for each term and these expressions solved analytically to extract transform parameters. Nine‐parameter decomposition was done without the skew matrix. Transformed coordinates (r′) are calculated from raw coordinates (r) as r′ = M·r using the following equation:
 |
An equivalent equation for calculating r′ separates the 3 × 3 rotate‐scale‐skew terms from the 3 × 1 translation terms
 |
Analysis of Disparity
The component‐wise disparity (Δr) between estimated MNI (r′) and TAL (r) coordinates is calculated as follows:
| (A1) |
where MTT −1·r is the estimated MNI coordinate, I the identity matrix, and MI the matrix used to calculate Δr from r. It is helpful to express the Δr vector using the equivalent form
| (A2) |
where the x‐y‐z coordinate label p is used for clarity. In the case of no disparity Δr will be all zeros, and solving Eq. (A2) for p leads to the position (p 0) where TAL and
MNI coordinates are the same.
| (A3) |
Equation (A3) was used to calculate coordinates of the no disparity sites illustrated in Figure 4.
Analysis of the square of displacement (i.e. square of distance) is helpful to model its spatial distribution as illustrated in Figure 4. The square of distance is calculated as follows:
| (A4a) |
| (A4b) |
| (A4c) |
| (A4d) |
| (A4e) |
Each of the three terms in Eq. (A4e) provides a specific component of distance squared (Δ2). The first term (Δ1 2), which is second order in p, leads to the ellipsoidal distribution of Δ2 in Figure 4. The second term (Δ2 2) is linear in p, while the third term is constant. Further examination of Δ1 2 helps to understand the ellipsoidal nature of the disparity seen in Figure 4. Since M T M in Δ is a symmetric square matrix it can be decomposed using an orthogonal matrix V of Eigenvectors and a diagonal matrix D with three Eigenvalues Di ,i. The decomposition is as follows:
| (A5) |
so that
| (A6a) |
| (A6b) |
| (A6c) |
| (A6d) |
where p′ = V 1 p are coordinates expressed within the rotated ellipsoid's frame, i.e. with coordinate axes aligned with the ellipsoid axes. V and D were calculated using the Eigenvalue and Eigenvector procedures provided in Mathcad Plus 6 for MacIntosh (MathSoft, Cambridge, MA). Expanding Eq. (A6d) reveals a standard‐form ellipsoid equation with distance Δ1 calculated as follows:
| (A7) |
The semimajor axes of the ellipsoid are given by
| (A8) |
and Di ,i are the three Eigenvalues taken from the diagonals of D.
REFERENCES
- Ashburner J,Friston KJ ( 1999): Spatial normalization In: Toga AW, editor. Brain Warping. San Diego: Academic Press; pp 27–44. [Google Scholar]
- Brett M,Christoff K,Cusack R,Lancaster J ( 2001): Using the Talairach atlas with the MNI template. NeuroImage 13: S85. [Google Scholar]
- Brett M,Johnsrude IS,Owen AM ( 2002): The problem of functional localization in the human brain. Nat Rev Neorosci 3: 243–249. [DOI] [PubMed] [Google Scholar]
- Calder AJ,LAwerence AD,Young AW ( 2001): Neuropsychology of fear and loathing. Nat Rev Neurosci 2: 353–363. [DOI] [PubMed] [Google Scholar]
- Carmack PS,Spense J,Gunst RF,Schucany WR,Woodward WA,Haley RW ( 2004): Improved agreement between Talairach and MNI coordinate spaces in deep brain regions. NeuroImage 22: 367–371. [DOI] [PubMed] [Google Scholar]
- Chau W,McIntosh AR ( 2005): The Talariach coordinate of a point in the MNI space: How to interpret it. NeuroImage 25: 408–416. [DOI] [PubMed] [Google Scholar]
- Collins DL,Neelin P,Peters TM,Evans AE ( 1994): Automatic 3D intersubject registration of MR columetric data in standardized Talairach space. J Comput Assist Tomogr 18: 192–205. [PubMed] [Google Scholar]
- Duncan J,Seitz RJ,Kolodny J,Bor D,Herzog H,Ahmed A,Newell FN,Emslie H ( 2000): A neural basis for general intelligence. Science 289: 457–460. [DOI] [PubMed] [Google Scholar]
- Evans AC,Collins DL,MIlls SR,Brown ED,Kelly RL,Peters TM ( 1993). 3D statistical neuroanatomical models from 305 MRI volumes. In: Proceedings of IEEE‐Nuclear Science Symposium and Medical Imaging Conference. pp 1813–1817.
- Fox PT ( 1995): Spatial normalization: Origins, objectives, applications and alternatives. Hum Brain Mapp 3: 161–164. [Google Scholar]
- Fox PT,Mikiten S,Davis G,Lancaster JL ( 1994): BrainMap: A database of human functional brain mapping In: Thatcher RW,Zeffiro T, Huerta M, editors. Advances in Functional Neuroimaging: Technical Foundations. Orlando: Academic Press; pp 98–106. [Google Scholar]
- Fox PT,Lancaster JL ( 1995): Neuroscience on the net. Science 266: 994–995. [DOI] [PubMed] [Google Scholar]
- Fox PT,Lancaster JL ( 1998): BrainMap: Electronic integration of mind and brain In: Gulyas B,Muller‐Gartnes HW, editors. Positron Emission Tomography: A Critical Assessment of Recent Trends. Netherlands: Kluwer Academic. [Google Scholar]
- Friston KJ,Ashburner J,Frith CD,Poline J‐B,Heather JD,Frackowiak RSJ ( 1995): Spatial registration and normalization of images. Hum Brain Mapp 2: 165–189. [Google Scholar]
- Jenkinson M,Bannister PR,Brady JM,Smith SM ( 2002): Improved optimisation for the robust and accurate linear registration and motion correction of brain images. NeuroImage 17: 825–841. [DOI] [PubMed] [Google Scholar]
- Lancaster JL,Glass TG,Lankipalli BR,Downs H,Mayberg H,Fox PT ( 1995): A modality‐independent approach to spatial normalization. Hum Brain Mapp 3: 209–223. [Google Scholar]
- Lancaster JL,Fox PT,Downs H,Nickerson D,Hander T,El Mallah M,Zamarripa F ( 1999): Global spatial normalization of the human brain using convex hulls. J Nucl Med 40: 942–955. [PubMed] [Google Scholar]
- Lancaster JL,Woldorff MG,Parsons LM,Liotti M,Freitas CS,Rainey L,Kochunov PV,Nickerson D,Mikiten SA,Fox PT ( 2000): Automated Talairach atlas labels for functional brain mapping. Hum Brain Mapp 10: 120–131. [DOI] [PMC free article] [PubMed] [Google Scholar]
- Lancaster JL,Fox PT ( 2000): Talairach space as a tool for intersubject standardization in the brain In: Bankman IN,editor. Handbook of Medical Imaging Processing and Analysis. San Diego: Academic Press; pp 555–567. [Google Scholar]
- Mazziotta JC,Toga AW,Evans A,Lancaster JL,Fox PT ( 1995): A probabilistic atlas of the human brain: Theory and rational for its development. NeuroImage 2: 89–101. [DOI] [PubMed] [Google Scholar]
- Mazziotta J,Toga A,Evans A,Fox P,Lancaster J,Zilles K,Simpson G,Woods R,Paus T,Pike B,Holmes C,Collins L,Thompson P,MacDonald D,Schormann T,Amunts K,Palomero‐Gallagher N,Parsons L,Narr K,Kabani N,LeGoualher G,Boomsma D,Cannon T,Kawashima R,Mazoyer B ( 2001b): A probabilistic atlas and reference system for the human brain. Philos Trans R Soc Lond B Biol Sci 356: 1293–1322. [DOI] [PMC free article] [PubMed] [Google Scholar]
- Mazziotta J,Toga A,Evans A,Fox P,Lancaster J,Zilles K,Simpson G,Woods R,Paus T,Pike B,Holmes C,Collins L,Thompson P,MacDonald D,Schormann T,Amunts K,Palomero‐Gallagher N,Parsons L,Narr K,Kabani N,LeGoualher G,Boomsma D,Cannon T,Kawashima R,Mazoyer B. ( 2001a): A four‐dimensional atlas of the human brain. J Am Med Inform Assoc 8: 401–430. [DOI] [PMC free article] [PubMed] [Google Scholar]
- Penrose R ( 1955): A generalized inverse for matrices. Proc Camb Phil Soc 51: 406–413. [Google Scholar]
- Pujol J,Soriano‐Mas C,Alonso P,Cardoner N,Menchon JM,Deus J,Vallejo J ( 2004): Mapping structural brain alterations in obsessive‐compulsive disorder. Arch Gen Psychiatry 61: 720–730. [DOI] [PubMed] [Google Scholar]
- Roche A,Malandain G,Pennec X,Ayache N ( 1998): The correlation ratio as a new similarity measure for multimodal image registration. In: Proceedings MICCAI '98. Lectures Notes in Computer Science, Vol. 1496. Berlin: Springer Verlag. pp 1115–1124.
- Talairach J,Tournoux P ( 1988): Co‐planar stereotaxic atlas of the human brain: 3‐Dimensional proportional system—An approach to cerebral imaging. New York: Thieme. [Google Scholar]