

Abstract
To evaluate baboons (Papio hamadryas) as a primate model for the study of the genetic control of brain size and internal structure, we performed high resolution (<500 μm) magnetic resonance imaging on 109 pedigreed baboons. Quantitative genetic analysis of these MR images using a variance components approach indicates that native (untransformed) brain volume exhibits significant heritability among these baboons (h 2 = 0.52, P = 0.0049), with age and sex also accounting for substantial variation. Using global spatial normalization, we transformed all images to a standard population‐specific reference, and recalculated the heritability of brain volume. The transformed images generated heritability estimates of h 2 = 0.82 (P = 0.00022) for total brain volume, h 2 = 0.86 (P = 0.0006) for cerebral volume, h 2 = 0.73 (P = 0.0069) for exposed surface area of the cerebrum and h 2 = 0.67 (P = 0.01) for gray matter volume. Regional differences in the genetic effects on brain structure were calculated using a voxel‐based morphometry (VBM) approach. This analysis of regional variation shows that some areas of motor cortex and the superior temporal gyrus show relatively high heritability while other regions (e.g. superior parietal cortex) exhibit lower heritability. The general pattern of regional differences is similar to that observed in previous studies of humans. The present study demonstrates that there is substantial genetic variation underlying individual variation in brain size and structure among Papio baboons, and that broad patterns of genetic influence on variation in brain structure may be similar in baboons and humans. Hum Brain Mapp, 2007. © 2007 Wiley‐Liss, Inc.
Keywords: brain size, gray matter volume, cerebral surface area, primate, regional heritability, voxel based morphometry
INTRODUCTION
The size and structure of the brain varies among individuals and this interindividual neuroanatomic variation has a number of important correlates. For example, gross brain volume is correlated with intelligence or g, as measured by standardized tests (Gignac et al., 2003; Posthuma et al., 2002). Normal variation in temperament and personality is associated with variation in specific brain structures, including the anterior cingulate cortex (Pujol et al., 2002). In addition, individual variation in specific regions or structures of the brain is associated with various psychiatric and neurological illnesses (McDonald et al., 2006). Schizophrenia (Wright et al., 2000, Harris et al., 2004), bipolar depression (Monkul et al., 2005), and post‐traumatic stress disorder (Hull, 2002) have all been associated with global parameters such as total gray matter volume, with localized variation in specific brain structures, or both. A detailed explanation of the causes and consequences of variation in human brain structure would have wide significance and numerous implications for neuroscience, neurology, and psychiatry.
Previous human neuroimaging studies demonstrate that genetic differences account for a large proportion of neuroanatomic variation (see Toga and Thompson, 2005 for a recent review). The available data suggest that genetic effects are strongest with regard to total brain size and gray matter volume, with lobar volumes showing somewhat lower heritability (Baare et al., 2001; Geschwind et al., 2002; Posthuma et al., 2002). Furthermore, individual genes have been identified that may influence specific aspects of brain variation (Evans et al., 2005; Mekel‐Bobrov et al., 2005), and specific mutations have been associated with pathologic changes (Woods, 2004). However, although it is clear that genes influence brain size and structure, the specific genes or genetic mechanisms involved in normal variation remain poorly understood.
Nonhuman primates are widely used as animal models in biomedical research because they exhibit close anatomical, physiological, biochemical, and genetic similarity to humans. Studies of nonhuman primates play an important role in many aspects of biomedical research, but especially in neurobiology, neurophysiology, and behavioral studies such as addiction research. Baboons (Papio hamadryas) are unique among nonhuman primates in their suitability as an animal model for the genetic analysis of individual variation in brain structure. Baboons are Old World monkeys, the branch of the primate evolutionary tree that includes rhesus macaques, cynomolgus macaques and vervet monkeys. No species other than the apes is more closely related to humans than is Papio hamadryas (Stewart and Disotell, 1998). But Papio baboons are unusual among Old World monkeys in having significantly larger brains than any macaque or other commonly used laboratory monkey. Indeed the cerebral volume in adult baboons is more than twice that of adult rhesus macaques (Martin, 1990; Leigh, 2004), although the ratio of brain size to body size is higher in rhesus macaques. Because of their larger absolute brain volume, opportunities for detailed structural imaging and the analysis of inter‐individual anatomical variation are greater in baboons. Other primate species that are more similar to humans and thus are outstanding models for human neuroanatomy (i.e. chimpanzees and gorillas) present only minimal opportunities for intraspecies genetic analyses due to the lack of extensive multigeneration pedigrees. In contrast, extended pedigrees of baboons have been used to map quantitative trait loci that influence a number of complex quantitative phenotypes directly related to human health and disease (e.g. Havill et al., 2005; Rainwater et al., 2003; Tejero et al., 2005). Thus, the analysis of complex phenotypes in baboons can lead to new information about the genetic basis of individual variation in biomedically important traits. Mahaney et al. (1993) used 282 adult Papio baboons from the multigeneration pedigrees maintained at the Southwest National Primate Research Center to examine the heritability of postmortem brain weight, reporting that the heritability was h 2 = 0.409. Prior studies in other nonhuman primate species have also found significant heritability of total brain size (Cheverud et al., 1990) or hippocampus volume (Lyons et al., 2001). In the present study, we used magnetic resonance imaging to quantify individual variation in brain size among living pedigreed baboons, and then conducted quantitative genetic analyses on a series of neuroanatomical phenotypes.
METHODS AND MATERIALS
Animal Subjects
Adult baboons were selected from the pedigreed colony maintained by the Southwest National Primate Research Center (SNPRC) at the Southwest Foundation for Biomedical Research (San Antonio, TX). This colony was established more than forty years ago and now consists of six generations and more than 2000 living individuals. The animals are housed in large outdoor enclosures that contain social groups of 12–25 animals. The 109 individuals we examined consisted of 51 males and 58 females. All were olive baboons (Papio hamadryas anubis) or crosses between olive and yellow baboons (P. h. cynocephalus). Only subjects greater than six years old were included because growth in brain size among baboons is not completed until six years of age (Leigh, 2004). The average age of the study subjects at imaging was 16.0 ± 4.2 years (range 7–28 years). The genealogical relationships among all study animals are known, and include 22 parent–offspring pairs, 27 full sib pairs, 341 half‐sib pairs, and a larger number of other more distant kinship relationships.
Handling and Anesthesia of Live Animal
Animals were transported from SNPRC to the animal preparation area at the Research Imaging Center (RIC). Fifteen minutes prior to scanning, each animal was sedated with ketamine (10 mg/kg) and intubated with an MR‐compatible tracheal tube. Once placed in the scanner, the anesthesia was maintained with an MR‐compatible gas anesthesia machine with 5% isofluorane. This protocol and all animal procedures were reviewed and approved by the Institutional Animal Care and Use Committee of the Southwest Foundation for Biomedical Research.
Imaging Equipment
All imaging was performed at the RIC using a Siemens 3 Tesla Trio, MRI scanner (Siemens, Earlagen, Germany). An 8‐channel receive‐only coil was used because it provided full brain coverage and excellent signal‐to‐noise ratio (SNR) for baboons.
MR Pulse Sequence Development
In order to develop the optimal imaging sequence, we measured gray matter (GM) and white matter (WM) T1/T2 relaxation times and proton density (PD) in five animals. An in‐house multiple single‐echo, spin‐echo imaging protocol was used to obtain a set of images with Echo Times (TE) of 7, 20, 50, and 100 ms and Repetition Time (TR) of 500 ms, and a second set with TRs of 500, 700, 1200, 3000, and 4000 ms at TE of 7 ms. A least‐square multiexponential fitting method was used to calculate T1 and T2 times and relative proton density for GM and WM compartments (MathCad, MathSoft, Cambridge, MA), and thus provide optimal contrast and SNR in high‐resolution images of the baboon brain.
High‐resolution (isotropic 500 μm), T1‐weighted images were acquired using a 3D TurboFlash sequence and a retrospective motion‐corrected protocol (Kochunov et al., 2006). This adiabatic inversion recovery contrast pulse with linear phase encoding schema was employed primarily because it led to a uniform tissue contrast across the imaging volume. Based on analytical solutions to Bloch equations (Deichmann et al., 2000) and a target 25% GM/WM contrast, we established the optimum T1 (795 ms), TR (2000 ms) and FLASH flip angle (10°). The sequence parameters were verified in a group of 5 animals, where group‐average WM‐GM contrast was calculated to be 25.2 ± 2% (range 22%–26%). The population (n = 109) average signal‐to‐noise ratio was calculated to be 24.3 ± 3.2, and the average WM/GM contrast was 23.5%. Given the approximately 8:1 ratio of brain size in humans vs. baboons, this imaging sequence provides resolution equivalent to 1 mm isotropic in the human brain.
Image Pre‐Processing
The structural image processing pipeline used to extract features for genetic analysis (Fig. 1) included four major steps: (a) automated removal of nonbrain tissue, (b) correction for RF‐inhomogeneity and global spatial normalization to population‐based reference frame, (c) tissue classification, and (d) extraction of volumetric and surface area phenotypes. The removal of nonbrain tissue used both automatic (Smith, 2002) and manual methods. Correction for RF‐inhomogeneity and tissue segmentation was performed using the FMRIB automated segmentation tool (Smith et al., 2004). Global spatial normalization reduces intersubject variability in global brain size, shape and orientation, and was performed using the FMRIB linear image registration tool (Smith et al., 2004). A population‐based (n = 32), pseudo‐Talairach, median‐geometry atlas was developed to serve as the target brain for global spatial normalization, using methods previously described for humans (Kochunov et al., 2005).
Figure 1.
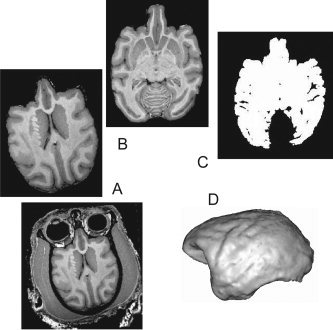
Image Pre‐processing Pipeline. (A) automated removal of nonbrain tissue, (B) correction for RF‐inhomogeneity and global spatial normalization to population‐based reference frame, (C) tissue thresholding and classification, and (D) extraction of volumetric and surface area phenotypes.
Neuroimaging Phenotypes
We calculated global measurements of brain and gray matter volume as well as local shape changes (with VBM). The following global measurements were obtained: brain volume (cerebrum + cerebellum) before (native) and after spatial normalization (normalized), cerebral volume (excluding the cerebellum), gray matter volume (excluding the cerebellum) and cerebral surface area. Cerebral surface area is defined as the area of the cerebrum that is not hidden in the sulcal folds and was estimated with a marching cube algorithm to produce a triangular mesh with uniform spacing of one voxel (0.4 mm) representing the exposed surface of the cerebrum. Cerebral surface area was calculated as the sum of the areas of the triangles composing the mesh.
In order to investigate local shape differences, we employed Voxel‐Based Morphometry (VBM; Ashburner and Friston, 2000). In VBM, images are spatially normalized to a stereotactic reference frame and a voxel‐wise comparison of the local concentration of tissue is performed using voxel‐wise parametric statistical tests. We used a VBM approach where the entire brain volume was considered as a single tissue class, a method we previously used in humans (Kochunov et al., 2003; Lancaster et al., 2003; Soares et al., 2005). Individual images were thresholded at the intensity level of cerebrospinal fluid, and those thresholded images were downsampled with a cubic kernel of 3 × 3 × 3 voxels to produce spatial maps of tissue probability (Fig. 2). Tissue probability varied from 3.7% when there was a single occupied voxel within the range of the processing kernel to 100% occupation. Only 3 × 3 × 3 voxel clusters that showed variation among the study baboons were analyzed.
Figure 2.
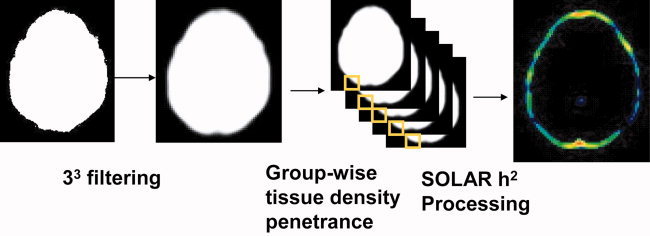
Processing of brain images for region‐specific analysis of genetic effects. The initial images are down‐filtered into 3 × 3 × 3 kernels of voxels, then the penetrance of brain tissue within each kernel is calculated and compared across study subjects to estimate the heritability of brain size and shape at each point along the brain surface.
Quantitative Genetic Analysis
Variance components methods, as implemented in SOLAR (Almasy and Blangero, 1998), were used to estimate the heritability of brain measures. The algorithms in SOLAR employ maximum likelihood variance decomposition methods and are an extension of the strategy developed by Amos (1994). The covariance matrix for a pedigree is given by:
| (1) |
where σg 2 is the genetic variance due to residual additive genetic factors, Φ is the kinship matrix representing the pairwise kinship coefficients among all animals, σ is the variance due to individual‐specific environmental effects, and I is an identity matrix. Significance of heritability was tested by comparing the likelihood of the model in which σ is constrained to zero with that of a model in which σ is estimated. Twice the difference between the two loge likelihoods of these models yields a test statistic, which is asymptotically distributed as a 1/2:1/2 mixture of a χ1 2 variable and a point mass at zero. Prior to testing for the significance of heritability, brain measures were adjusted for age, sex, age by sex interaction, age2, and age2 by sex interaction.
This model makes simultaneous use of all the genetic information available in the pedigree by using all possible pairs of individuals (Blangero et al., 2001). This is achieved by calculating pairwise kinship coefficients among all pedigree members for inclusion in the kinship matrix (Φ). Whenever a phenotype is influenced by genetic variation segregating in the pedigree, the phenotypic covariance among pairs depends on the kinship values. Variance components methods model the phenotypic covariance based on these values. A combination of breeding records and molecular genetic testing is used at the Southwest National Primate Research Center to determine parent–offspring relationships among baboons. These parent–offspring pairs are then combined to construct large full‐ and half‐sibships, and ultimately a full multigenerational pedigree that summarizes the genetic relationships among all individuals. Specific kinship coefficients are calculated using SOLAR based on this known genealogy. For additional explanation of the variance components approach in this context, see Almasy and Blangero (1998) and Blangero et al. (2001).
For analyses of brain volume and, cerebral surface area, a single value per animal was used for each genetic analysis. For the analysis of regional differences in genetic effects, we used approximately 56,000 3 × 3 × 3 voxel kernels for each baboon, and conducted separate heritability analyses for each kernel. Calculations were performed in parallel using approximately 1200 processors on our Solaris‐based supercomputing cluster maintained in the AT&T Genomics Center at SFBR. This highly computationally intensive analysis took less than 10 min. These heritability estimates were then mapped onto the baboon atlas for visualization.
RESULTS
Average Brain Size
The average volume of the brain (cerebrum and cerebellum) across 109 baboons was 173.1 ± 21.1 cubic centimeters (cc). However, both brain and body size differ significantly between male and female baboons (Leigh, 2004). The mean brain volume for 58 females was 158.5 ± 11.6 cc, and for 51 males was 189.7 ± 16.6 cc. This difference between sexes is highly significant, but because the study subjects are related, simple tests for differences of means that assume independence among subjects are not valid (see quantitative genetic results below for simultaneous analysis of sex difference and genealogical relatedness). Figure 3 shows the relationships among brain volume, sex and body size in this dataset. The mean of the cerebrum volume across these baboons was 144.3 cc, while the mean cerebellar volume was 25.8 cc. The mean volume of gray matter was 80.6 cc, which represents 55.8% of the total cerebral volume.
Figure 3.
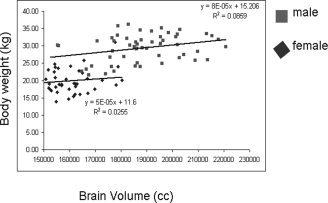
Distribution of brain volume and body weight in male and female baboons.
Heritability of Brain Volume and Surface Area
Quantitative genetic analyses show that brain size is highly heritable (Table 1). The estimated heritability of native brain volume (prior to spatial normalization) was h 2 = 0.520 (p = 0.0049). In this initial analysis, age, sex and age x sex interaction are all significant covariates, with sex particularly significant (p = 1.7 × 10⁻¹⁴). Together these three covariates account for 58.8% of the total phenotypic variation. The residual heritability of h 2 = 0.520 indicates that, after removing the combined effects of age, sex and their interaction, additive genetic variation accounts for 52% of the remaining variance in total brain volume.
Table I.
Residual heritability of baboon brain parameters
| Trait | h 2 | P value | Significant covariates |
|---|---|---|---|
| Total brain volume (prior to spatial normalization) | 0.520 | 0.0049 | Age, sex, age x sexa |
| Total brain volume (after spatial normalization) | 0.816 | 0.00022 | Age, age x sexb |
| Cerebral volume (after spatial normalization) | 0.861 | 0.0006 | Age, age x sexc |
| Cerebral surface area (after spatial normalization) | 0.730 | 0.0069 | Agec |
| Gray matter volume (after spatial normalization) | 0.666 | 0.010 | None |
All covariates significant at P ≤ 0.012.
All covariates significant at 0.01 < P < 0.05.
All covariates significant at 0.05 < P < 0.10.
Following spatial normalization, the estimated heritability of total brain volume was h 2 = 0.816 (p = 0.00022), and that of cerebral volume is h 2 = 0.861 (p = 0.0006). We also estimated the genetic effect on exposed cerebral surface area, and found that h 2 = 0.730 (p = 0.0069) for this trait. The heritability for gray matter volume is h 2 = 0.666 (p = 0.010). As expected, following spatial normalization the covariates of age and age x sex were only marginally significant (0.05 < p < 0.10) for brain volume. Both these covariates were significant for cerebral volume (p = 0.039 and p = 0.034 respectively), and no covariate was significant for either exposed surface area or gray matter volume.
Voxel‐Based Analyses of the Heritabilityof Baboon Brain Shape
The genetic analysis of variation in local or regional brain size and shape using VBM methods identified substantial differences across brain regions (see Fig. 4). Brain areas we infer to represent more rudimentary motor and sensory functions (such as for body and trunk) are highly heritable, with h 2 generally greater than 0.70. Brain regions inferred to be associated with motor and sensory function for arms, lips and face exhibit somewhat lower but nevertheless substantial heritability (h 2 < 0.60). However, we were not able to define these anatomical regions precisely. Results for the baboon analogs of brain areas associated with speech processing in humans are particularly interesting. The anatomical equivalents of Broca's area (opercular portion of the inferior frontal gyrus), Wernicke's area (superior temporal gyrus) and the angular gyrus show high local heritability (h 2 > 0.70), while superior parietal structures show markedly lower heritability (h 2 = 0.4–0.6). These comparisons of genetic effects reflect inter‐individual variation in tissue probability across 3 × 3 × 3 voxel clusters, and are better interpreted as a combined measure of local brain size and shape.
Figure 4.
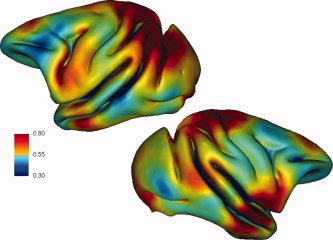
Regional variation in heritability of baboon brain size and shape. This figure illustrates the results from approximately 56,000 independent heritability analyses mapped back to the baboon cortex, with colors representing degrees of genetic heritability (see color bar). Each cluster of 3 × 3 × 3 voxels was scored for heritability and is represented graphically. Heritability values vary from approximately 0.4 to greater than 0.8. Clear regional differences are observed, with the gyri adjacent to the superior central sulcus, the superior temporal gyrus and the inferior frontal gyrus showing relatively stronger genetic effects, while the superior parietal region shows less genetic influence.
DISCUSSION
We found significant heritability for several neuroanatomical phenotypes, using both whole‐brain and regional analyses. Whole‐brain analyses were performed both in “native space,” i.e., on images not transformed into a standardized space and in standardized space. Regional analyses were performed only in standardized space. Brain volume computed prior to spatial normalization is a measurement of gross brain size, being influenced by body size and sex. Thus, it is quite reasonable that our native‐space whole‐brain volume heritability estimate (h 2 = 0.52) is similar to that for postmortem brain weight (h 2 = 0.41) obtained in this same population of baboons by Mahaney et al. (1993).
In transforming brains into a standard reference frame, they are adjusted to identical external dimensions, removing whole‐brain‐size effects of body weight and sex. After spatial normalization, variability in tissue volume chiefly reflects variability in brain shape, e.g., external curvature and sulci width. Following spatial normalization, we found significant heritability for total brain volume, cerebral volume and total grey matter volume. The estimated heritability for baboon brain volume after spatial normalization (h 2 = 0.82) is quite consistent with published estimates for human brains processed in a similar manner (Baare et al., 2001; Posthuma et al., 2002; Thompson et al., 2001; Toga and Thompson 2005; van Erp et al., 2004).
The voxel‐based morphometric analysis demonstrates that brain volume is also heritable at the local (gyral) level. In this analysis, variability in the location (inward or outward displacement) of the cerebral surface (relative to the group‐mean surface) was compared across individuals. Cortical surface deviations reflect variations in gyral volume, including both gray and white matter. This method was used rather than cortical thickness (or gray matter density) to enhance sensitivity, as heritable increases in cortical thickness are likely to be associated with concomitant (but larger) increases in the volume of the white matter tracts serving the thickened cortex. The anatomical variability patterns detected by either method (surface shape or gray matter density), however, should be similar.
It is well‐documented that anatomical and functional regions of the brain are conserved across human and nonhuman primates. Thus, it seems appropriate to compare heritability maps for baboons with those reported for humans. The most comparable human studies are those of Thompson et al. (2001), in which the heritability of variations in gray matter across brain regions were reported. In humans, gyri adjacent to the superior aspect of the central sulcus, the superior temporal gyrus and the inferior frontal gyrus all show high heritability, relative to other brain regions. In baboons, we found similar patterns. Thompson et al. also found left‐right asymmetries in heritability for Wernicke's area. We have not yet investigated this in the baboons. Our VBM data produced maps of regional heritability that are similar to those of Thompson et al. (2001) and thus raise the possibility that developmental genetic mechanisms which produce local differences in the degree of genetic control over cortical development (i.e. genetic canalization) may be conserved between the two species. In this analysis, the estimated heritability values reflect the proportion of total phenotypic variance attributable to additive genetic variation, after accounting for the covariates of age and sex. Thus relatively low heritability such as we observed for the superior parietal region (0.4–0.6) could result from weaker genetic canalization of development, greater sensitivity to environmental effects, or both.
An advantage of our study design is that the studied animals are part of large multigenerational pedigrees. Large extended pedigrees have several advantages over other study designs (such as sib‐pair or twin studies), including that extended pedigrees provide substantially greater statistical power for linkage studies intended to locate and identify the specific functional genes that influence normal variation in a quantitative trait (Williams and Blangero, 1999; Blangero et al., 2001). An additional advantage of our study is that we developed a MRI pulse sequence specifically for use with baboon brains. Image resolution is a significant consideration in any MR study of nonhuman primates, given the overall smaller brain size in these species compared with humans. The average baboon brain is approximately one‐eighth the total volume of the human brain (Martin, 1990), and thus spatial resolution is a critical factor when quantifying individual variation among animals. However, the baboon brain is more than twice the size of the average rhesus macaque (Macaca mulatta) brain, and more than twenty times the size of the marmoset (Callithrix jacchus) brain (Martin, 1990). The combination of larger target anatomy, specialized pulse sequences, and the use of extended pedigrees provided an optimal sample to assess brain heritability in nonhuman primates.
Baboons have proven to be a valuable model organism for the genetic analysis of numerous complex phenotypes. Our results for brain size and gray matter volume extend the conclusions of Mahaney et al. (1993) and suggest that living baboons can be used effectively as models for the genetic analysis of brain structure. The further development and validation of this species as a useful primate model for neurogenetics would create several new opportunities for research. First, the analysis of extended baboon pedigrees provides an opportunity to use linkage analysis to map the genes that influence brain volume, regional brain shape and related parameters. Previous quantitative trait locus (QTL) mapping studies have used pedigreed baboons to locate functional genes related to risk for osteoporosis (Havill et al., 2005), heart disease (Rainwater et al., 2003), hypertension (Kammerer et al., 2001), diabetes (Tejero et al., 2005) and other human health issues (Martin et al., 2001). Our current sample size of 109 baboons is not yet sufficient to support QTL mapping, but the high heritabilities obtained in this study suggest that, given sufficient sample size, specific functional genes that influence neuroanatomy could be localized (Blangero et al., 2001). Second, the feasibility of obtaining tissue samples creates a potential for detailed studies of gene expression in the cortex or other tissues of baboons (e.g. Tejero et al., 2005). A primate model of the genetic control of brain development could be used to investigate the ontogenetic pattern of expression of specific genes implicated by human genetic analyses as regulators of brain growth, and to conduct these analyses at various stages of embryonic, fetal and postnatal development. Third, the availability of large multigeneration pedigrees means that quantitative genetic studies of genetic correlations among phenotypes (i.e. investigation of shared genetic variance across a range of anatomical or physiological traits) can be pursued. Prior studies of neurobiological phenotypes in baboons demonstrate that variance components analysis in large pedigrees can be used to estimate genetic correlations among phenotypes related to neurochemistry and psychopathology (e.g. Rogers et al., 2004). Similar analyses could identify disparate regions within the primate brain that share a common genetic basis (Wright et al., 2002), even before we are able to identify the specific functional genes involved. Taken together these previous analyses suggest that future studies using quantitative genetic and QTL mapping methods may be able to locate and identify specific genes that influence individual variation in baboon brain size and structure at the global or regional level. The baboon model opens the possibility of performing studies of gene expression in specific brain regions during defined stages of development. In the long term, it is conceivable that technologies such as RNAi or adenovirus vectors could be used to manipulate gene expression in developing baboons and hence test specific hypotheses concerning the detailed effects of genetic variants on brain structure and anatomy. Such studies would have clear implications for our understanding of the genetics of neuroanatomical variation among humans.
Acknowledgements
The authors thank the staff of the Dept. of Comparative Medicine, Southwest Foundation for Biomedical Research, for outstanding technical assistance with animal procedures. We also thank Dr. Michael Mahaney and Ms. Debbie Newman for assistance with quantitative genetic analysis. We also thank two anonymous reviewers for their comments on this manuscript.
REFERENCES
- Almasy L, Blangero J ( 1998): Multipoint quantitative‐trait linkage analysis in general pedigrees. Am J Hum Genet 62: 1198–1211. [DOI] [PMC free article] [PubMed] [Google Scholar]
- Amos CI ( 1994): Robust variance components approach for assessing genetic linkage in pedigrees. Am J Hum Genet 54: 535–543. [PMC free article] [PubMed] [Google Scholar]
- Ashburner J, Friston KJ ( 2000): Voxel‐based morphometry–the methods. Neuroimage 6(Pt. 1): 805–821. [DOI] [PubMed] [Google Scholar]
- Baare WF, Hulshoff Pol HE, Boomsma DI, Posthuma D, de Geus EJ, Schnack HG, van Haren NE, van Oel CJ, Kahn RS ( 2001): Quantitative genetic modeling of variation in human brain morphology. Cereb Cortex 11: 816–824. [DOI] [PubMed] [Google Scholar]
- Blangero J, Williams JT, Almasy L ( 2001): Variance component methods for detecting Complex trait loci. Adv Genet 42: 151–181. [DOI] [PubMed] [Google Scholar]
- Cheverud JM, Falk D, Vannier M, Konigsberg L, Helmkamp RC, Hildebolt C ( 1990): Heritability of brain size and surface features in rhesus macaques (Macaca mulatta). J Hered 81: 51–57. [DOI] [PubMed] [Google Scholar]
- Deichmann R, Good CD, Josephs O, Ashburner J, Turner R ( 2000): Optimization of 3‐D MP‐RAGE sequences for structural brain imaging. Neuroimage 12: 112–127. [DOI] [PubMed] [Google Scholar]
- Evans PD, Gilbert SL, Mekel‐Bobrov N, Vallender EJ, Anderson JR, Vaez‐Azizi LM, Tishkoff SA, Hudson RR, Lahn BT ( 2005): Microcephalin, a gene regulating brain size, continues to evolve adaptively in humans. Science 309: 1717–1720. [DOI] [PubMed] [Google Scholar]
- Geschwind DH, Miller BL, DeCarli C, Carmelli D ( 2002): Heritability of lobar brain volumes in twins supports genetic models of cerebral laterality and handedness. Proc Natl Acad Sci USA 99: 3176–3181. [DOI] [PMC free article] [PubMed] [Google Scholar]
- Gignac G, Vernon PA, Wickett JC ( 2003): Factors influencing the relationship between brain size and intelligence In: Nyborg H, editor. The Scientific Study of General Intelligence. Amsterdam: Pergamon; pp 93–106. [Google Scholar]
- Harris JM, Whalley H, Yates S, Miller P, Johnstone EC, Lawrie SM ( 2004): Abnormal cortical folding in high‐risk individuals: A predictor of the development of schizophrenia? Biol Psychiatry 56: 182–189. [DOI] [PubMed] [Google Scholar]
- Havill LM, Mahaney MC, Cox LA, Morin PA, Joslyn G, Rogers J ( 2005): A quantitative trait locus for normal variation in forearm bone mineral density in pedigreed baboons maps to the ortholog of human chromosome 11q. J Clin Endocrinol Metab 90: 3638–3645. [DOI] [PubMed] [Google Scholar]
- Hull AM ( 2002): Neuroimaging findings in post‐traumatic stress disorder. Systematic review. Br J Psychiatry 181: 102–110. [PubMed] [Google Scholar]
- Kammerer CM, Cox LA, Mahaney MC, Rogers J, Shade RE ( 2001): Sodium‐lithium countertransport activity is linked to chromosome 5 in baboons. Hypertension 37: 398–402. [DOI] [PubMed] [Google Scholar]
- Kochunov P, Fox P, Lancaster J, Tan LH, Amunts K, Zilles K, Mazziotta J, Gao JH ( 2003a): Localized morphological brain differences between English‐speaking Caucasians and Chinese‐speaking Asians: new evidence of anatomical plasticity. Neuroreport 14: 961–964. [DOI] [PubMed] [Google Scholar]
- Kochunov P, Lancaster J, Hardies J, Thompson PM, Woods RP, Cody JD, Hale DE, Laird A, Fox PT ( 2005): Mapping structural differences of the corpus callosum in individuals with 18q deletions using targetless regional spatial normalization. Hum Brain Mapp 24: 325–331. [DOI] [PMC free article] [PubMed] [Google Scholar]
- Kochunov P, Lancaster JL, Glahn DC, Purdy D, Laird AR, Gao F, Fox P ( 2006): Retrospective motion correction protocol for high‐resolution anatomical MRI. Hum Brain Mapp 27: 957–962. [DOI] [PMC free article] [PubMed] [Google Scholar]
- Lancaster J, Kochunov P, Thompson P, Fox P ( 2003b): Asymmetry of the brain surface from deformation field analysis. Hum Brain Mapp 19: 79–89. [DOI] [PMC free article] [PubMed] [Google Scholar]
- Leigh SR ( 2004): Brain growth, life history, and cognition in primate and human evolution. Am J Primatol 62: 139–164. [DOI] [PubMed] [Google Scholar]
- Lyons DM, Yang C, Sawyer‐Glover AM, Moseley ME, Schatzberg AF ( 2001): Early life stress and inherited variation in hippocampal volumes. Arch Gen Psychiatry 58: 1145–1151. [DOI] [PubMed] [Google Scholar]
- McDonald C, Marshall N, Sham PC, Bullmore ET, Schulze K, Chapple B, Bramon E, Filbey F, Quraishi S, Walshe M, Murray RM ( 2006): Regional brain morphometry in patients with schizophrenia or bipolar disorder and their unaffected relatives. Am J Psychiatry 163: 478–487. [DOI] [PubMed] [Google Scholar]
- Mahaney MC, Williams‐Blangero S, Blangero J, Leland MM ( 1993): Quantitative genetics of relative organ weight variation in captive baboons. Hum Biol 65: 991–1003. [PubMed] [Google Scholar]
- Martin RD 1990. Primate origins and evolution. Princeton, NJ: Princeton University; p. 362. [Google Scholar]
- Martin LJ, Blangero J, Rogers J, Mahaney MC, Hixson JE, Carey KD, Morin PA, Comuzzie AG ( 2001): A quantitative trait locus influencing estrogen levels maps to a region homologous to human chromosome 20. Physiological Genomics 5: 75–80. [DOI] [PubMed] [Google Scholar]
- Mekel‐Bobrov N, Gilbert SL, Evans PD, Vallender EJ, Anderson JR, Hudson RR, Tishkoff SA, Lahn BT ( 2005): Ongoing adaptive evolution of ASPM, a brain size determinant in Homo sapiens . Science 309: 1720–1722. [DOI] [PubMed] [Google Scholar]
- Monkul ES, Malhi GS, Soares JC ( 2005): Anatomical MRI abnormalities in bipolar disorder: do they exist and do they progress? Aust N Z J Psychiatry 39: 222–226. [DOI] [PubMed] [Google Scholar]
- Posthuma D, deGeus EJ, Baare WF, Hulshoff HE, Kahn RS, Boomsma DI ( 2002): The association between brain volume and intelligence is of genetic origin. Nature Neurosci 5: 83–84. [DOI] [PubMed] [Google Scholar]
- Pujol J, Lopez A, Deus J, Cardoner N, Vallejo J, Capdevila A, Paus T ( 2002): Anatomical variability of the anterior cingulate gyrus and basic dimensions of human personality. Neuroimage 15: 847–855. [DOI] [PubMed] [Google Scholar]
- Rainwater DL, Kammerer CM, Mahaney MC, Rogers J, Cox LA, Schneider JL, VandeBerg JL ( 2003): Localization of genes that control LDL size fractions in baboons. Atherosclerosis 168: 15–22. [DOI] [PubMed] [Google Scholar]
- Rogers J, Martin LJ, Comuzzie AG, Mann JJ, Manuck SB, Leland M, Kaplan JR ( 2004): Genetics of monoamine metabolites in baboons: overlapping sets of genes influence levels of 5‐hydroxyindolacetic acid, 3‐hydroxy‐4‐methoxyphenylglycol, and homovanillic acid. Biol Psychiatry 55: 739–744. [DOI] [PubMed] [Google Scholar]
- Soares J, Kochunov P, Monkul S, Nicolletti M, Brambilla P, Sassi R, Mallinger A, Frank E, Kupfer D, Lancaster J, Fox P ( 2005): Detecting structural brain changes in bipolar disorder using deformation field morphometry. Neuroreport 16: 541–544. [DOI] [PubMed] [Google Scholar]
- Smith SM ( 2002): Fast robust automated brain extraction. Hum Brain Mapp 17: 143–155. [DOI] [PMC free article] [PubMed] [Google Scholar]
- Smith SM, Jenkinson M, Woolrich MW, Beckmann CF, Behrens TE, Johansen‐Berg H, Bannister PR, De Luca M, Drobnjak I, Flitney DE, Niazy RK, Saunders J, Vickers J, Zhang Y, De Stefano N, Brady JM, Matthews PM ( 2004): Advances in functional and structural MR image analysis and implementation as FSL. Neuroimage 23: S208–S219. [DOI] [PubMed] [Google Scholar]
- Stewart CB, Disotell TR ( 1998): Primate evolution ‐ in and out of Africa. Curr Biol 8: R582–R588. [DOI] [PubMed] [Google Scholar]
- Tejero ME, Cole SA, Cai G, Peebles KW, Freeland‐Graves JH, Cox LA, Mahaney MC, Rogers J, VandeBerg JL, Blangero J, Comuzzie AG ( 2005): Genome‐wide scan of resistin mRNA expression in omental adipose tissue of baboons. Int J Obes (Lond) 29: 406–412. [DOI] [PubMed] [Google Scholar]
- Thompson PM, Cannon TD, Narr KL, van Erp T, Poutanen VP, Huttunen M, Lonnqvist J, Standertskjold‐Nordenstam CG, Kaprio J, Khaledy M, Dail R, Zoumalan CI, Toga AW ( 2001): Genetic influences on brain structure. Nat Neurosci 4: 1253–1258. [DOI] [PubMed] [Google Scholar]
- Toga AW, Thompson PM ( 2005): Genetics of brain structure and intelligence. Ann Rev Neurosci 28: 1–23. [DOI] [PubMed] [Google Scholar]
- Van Erp TGM, Cannon TD, Tran HL, Wobbekind AD, Huttunen M, Lonnqvist J, Kaprio J, Salonen O, Valanne L, Poutanen V, Standerstskjold‐Nordenstam C, Toga AW, Thompson PM ( 2004): Genetic influences on human brain morphology. IEEE Symposium on Biomedical Imaging 2004: 583–586. [Google Scholar]
- Williams JT, Blangero J ( 1999): Power of variance components linkage analysis to detect quantitative trait loci. Ann Hum Genet 63: 545–563. [DOI] [PubMed] [Google Scholar]
- Woods CG ( 2004): Human microcephaly. Curr Opin Neurobiol 14: 112–117. [DOI] [PubMed] [Google Scholar]
- Wright IC, Rabe‐Hesketh S, Woodruff PW, David AS, Murray RM, Bullmore ET ( 2000): Meta‐analysis of regional brain volumes in schizophrenia. Am J Psychiatry 157: 16–25. [DOI] [PubMed] [Google Scholar]
- Wright IC, Sham P, Murray RM, Weinberger DR, Bullmore ET ( 2002): Genetic contributions to regional variability in human brain structure: methods and preliminary results. Neuroimage 17: 256–271. [DOI] [PubMed] [Google Scholar]