

Abstract
Although studies of obsessive–compulsive disorder (OCD) over the last 20 years have suggested abnormalities in frontal‐subcortical circuitry, evidences of structural abnormalities in those areas are still imperfect and contradictory. With recent advances in neuroimaging technology, it is now possible to study cortical thickness based on cortical surfaces, which offers a direct quantitative index of cortical mass. Using the constrained Laplacian‐based automated segmentation with proximities (CLASP) algorithm, we measured cortical thickness of 55 patients with OCD (33 men and 22 women) and 52 age‐ and sex‐matched healthy volunteers (32 men and 20 women). We found multiple regions of cortical thinning in OCD patients compared to the normal control group. Patients with OCD had thinner left inferior frontal, left middle frontal, left precentral, left superior temporal, left parahippocampal, left orbitofrontal, and left lingual cortices. Most thinned regions were located in the left ventral cortex system, providing a new perspective that this ventral cortical system may be involved in the pathophysiology of OCD. Hum Brain Mapp, 2007. © 2006 Wiley‐Liss, Inc.
Keywords: cortical thickness, obsessive compulsive disorder, ventral cortex system
INTRODUCTION
Obsessive–compulsive disorder (OCD) is an anxiety disorder characterized by intrusive, troubling thoughts or repetitive, compulsive behaviors perceived as the products of one's own mind [American Psychiatric Association, 1994]. The main pathology of the disease has traditionally been linked to abnormalities in frontal‐subcortical circuitry [Saxena et al., 1998; Shin et al., 2006]; however, evidence of structural abnormalities in these regions are imperfect and contradictory. Some studies have reported smaller volumes of orbitofrontal cortex (OFC) [Szeszko et al., 1999] and caudate nucleus [Robinson et al., 1995; Rosenberg et al., 1997], in OCD patients, while others have found no differences between OCD and normal subjects [Aylward et al., 1996; Grachev et al., 1998]. Kim et al. [ 2001] documented a greater density of gray matter in the frontal subcortical circuitry in OCD patients using a voxel‐based morphometry (VBM) of segmented MR images. However, volumetric measurements have revealed smaller OFCs [Choi et al., 2004; Kang et al., 2004] and no differences in the subcortical cortices, including caudate, anterior cingulate, thalamus, and the putamen, in OCD patients compared to normal controls [Kang et al., 2004].
These inconsistent volumetric data might originate partly from arbitrary delineation of the region of interest (ROI). However, it seems more likely that such discrepancies stem from the fact that most ROIs investigated for OCD‐caused abnormalities, including the orbitofrontal and cingulate cortices, have separate functional and anatomical subdivisions [Ongur et al., 2003; Zald and Kim, 1996]. Unfortunately, subregions of these cortices have rarely been measured individually in MRI studies of OCD, owing to the large size and variable anatomical borders of the ROIs used [Choi et al., 2004]. Voxel‐based morphometry (VBM), unlike ROI analysis, can provide a nonbiased measure of highly localized regions without the need to define anatomical borders a priori [Ashburner and Friston, 2000]. However, VBM compares the differences in the ‘smoothed voxel density’ of grey matter [Ashburner and Friston, 2000], which is not easy to interpret because voxel values may vary according to shape and tissue composition and are only useful within a statistical context [Lerch et al., 2005]. Furthermore, VBM, which does not consider sulcal geometry, and ROI analysis appear to produce conflicting results for similar regions. Tisserand et al. [ 2002] compared manual ROI volumetry and VBM analysis, and did not find a strong agreement between the two methods; they concluded that manual volumetry remained the “gold standard” of volumetric analysis of grey matter.
With recent advances in neuroimaging technology, it is now possible to study cortical thickness based on cortical surfaces in vivo [Kabani et al., 2001; Narr et al., 2005]. Unlike VBM, cortical thickness measured from cortical surfaces can differentiate between cortices of opposing sulcal walls within the same sulcal bed, similar to manual tracing. In addition, cortical thickness measurements offer a direct quantitative index of cortical mass suitable for clinical interpretation, as seen in decreased cortical thickness in patients with cortical atrophy such as Alzheimer's disease [Lerch et al., 2005].
The aim of this study was to compare cortical thickness in OCD patients with normal controls. We hypothesized that cortical thickness would differ between study groups in the regions predicted by previous brain structural studies of OCD.
SUBJECTS AND METHODS
Subjects
Fifty‐five patients with OCD (33 men and 22 women) were recruited from the OCD clinic at Seoul National University Hospital (SNUH). These patients met the DSM‐IV criteria for OCD, as diagnosed using the Structured Clinical Interview for DSM‐IV (SCID) [First et al., 1996]. The normal control group consisted of 52 age‐ and sex‐matched healthy volunteers (32 men and 20 women) recruited from the community via newspaper advertisements. Exclusion criteria for OCD subjects and normal controls were the presence of a medical condition, neurological disorders, or a history of other major psychiatric disorders, such as substance abuse, schizophrenia, depression, bipolar disorder, and other anxiety disorders; screening was performed using the SCID. This study was approved by the institutional review board of SNUH. Written informed consent was obtained from subjects before MRIs were performed.
The mean ages of the OCD group and the normal controls were 26.51 ± 6.87 years and 26.44 ± 5.35 years, respectively (t = 0.06, df = 105, P = 0.96). The mean periods of education were 14.33 ± 2.20 years and 15.67 ± 2.01 years, respectively (t = −3.30, df = 105, P = 0.001), and the mean socioeconomic status was ranked 3.05 ± 0.71 and 2.65 ± 0.59 on the Hollingshead Index of Social Position [Hollingshead and Redlich, 1958], respectively (t = 3.18, df = 105, P = 0.002). All participants were right‐handed, except for two OCD patients [Annett, 1970]. At the time of the study, the patients had a mean duration of illness of 7.96 ± 5.92 years, ranging from 1 to 26 years. The mean onset age was 18.55 ± 6.09 years, ranging from 7 to 38 years. Most patients were taking medication for their disorder, such as selective serotonin reuptake inhibitors (including sertraline, fluoxetine paroxetine, and clomipramine) and/or atypical antipsychotics (including risperidone and olanzapine) and/or benzodiazepines (including lorazepam and clonazepam) at the time the MRIs were performed. Clinical assessments included the Yale‐Brown Obsessive Compulsive Scale (Y‐BOCS) [Goodman et al., 1989a, b] for determining OCD symptom severity. The mean scores for symptoms were as follows: obsession, 11.35 ± 2.53; compulsion, 11.31 ± 4.78; overall, 24.65 ± 6.00. The mean Beck depression index (BDI) [Beck and Steer, 1987b] for depression was 18.04 ± 10.39, N = 51, and the mean Beck anxiety index (BAI) [Beck and Steer 1987a] for anxiety was 20.06 ± 14.46, N = 51.
Magnetic Resonance Imaging
Three‐dimensional T1‐weighted spoiled gradient echo magnetic resonance images (MRI) were taken on a 1.5‐T GE SIGNA Scanner (GE Medical System, Milwaukee). Imaging parameters were as follows: 1.5‐mm sagittal slices, 5.5‐ms echo time, 14.4‐ms repetition time, 1 excitation, 20° rotation angle, 21‐cm field of view, and 256 × 256 matrix. Images were processed using the software package, ANALYZE (version 4.1, Mayo Foundation, Rochester, Minnesota). Images were resampled to 1.0 mm3 voxels, reoriented to the conventional position, and spatially realigned so that the anterior–posterior axis of the brain was aligned parallel to the intercommissural line, and the other two axes were aligned along the interhemispheric fissure. The data sets were then filtered using anisotropic diffusion methods to improve the signal‐to‐noise ratio. The semiautomated region growing method removed images of tissues exterior to the brain. The extracted brain images were segmented into grey matter, white matter, and cerebrospinal fluid by employing the fuzzy C‐mean algorithm [Yoon et al., 2003]. Intracranial volume was calculated by adding the volumes of these three components.
Image Processing
To measure cortical thickness, several preprocessing algorithms were required. First, intensity nonuniformity in the raw MR images resulting from magnetic field inhomogeneity needed correction, so that the corrected volumes could be properly classified into GM, WM, and CSF [Sled et al., 1998]. After comparing local histograms of image intensity in different spatial locations, the shift in the intensity histogram due to RF inhomogeneity was identified and corrected. Second, automatic registration to a stereotaxic space [Collins et al., 1994; Talairach and Tournoux, 1988] was performed using the intensity‐corrected image to spatially normalize the brains. This method linearly transforms an MRI by using gradient descent at multiple scales to maximize the correlation between the individual volume intensity and an average volume intensity constructed from a large number of previously aligned brains. Third, a 3D stereotaxic brain mask was used to remove extracerebral voxels. The tissue classification was also required to reconstruct cortical surfaces. The discrete classification employed an Intensity‐Normalized Stereotaxic Environment for Classification of Tissues (INSECT) [Zijdenbos et al., 2002]. To reveal the buried CSF in sulci, we utilized probabilistic classification, which provided combined information on GM and CSF. The probabilistic CSF voxels outlined the sulcal walls.
Cortical Thickness
Thickness measurement required specific algorithms to reconstruct inner and outer cortical surfaces [MacDonald et al., 2000]. These surfaces were automatically reconstructed by the Constrained Laplacian‐based automated segmentation with proximities (CLASP) algorithm [Im et al., 2006; Kim et al., 2005; Lee et al., 2006]. CLASP extracted the inner cortical surface by deforming a sphere polygon model to the boundary between GM and WM. The number of triangles of the polygon model was hierarchically refined from 320 to 80,920. Then, the outer cortical surface was expanded from the inner surface to the boundary between GM and CSF along a Laplacian map, which smoothly increased potential surfaces between WM and CSF. A CSF fraction image was skeletonized to determine the boundary of the outer cortex in buried sulci. Inner and outer surfaces had the same vertex number (40962) and each vertex between surfaces was related. Thus, the cortical thickness was easily measured as the distance between related vertices. The procedure to measure and analyze cortical thickness is summarized in Figure 1.
Figure 1.
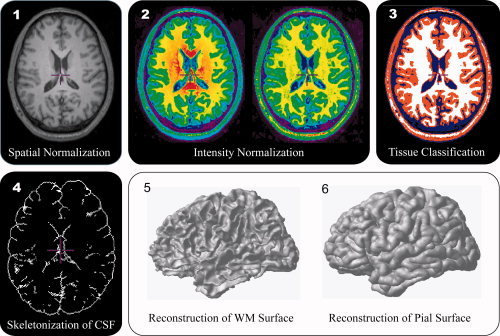
The algorithm measuring cortical thickness.
Statistical Analysis
To compare thickness between groups, measurements were spatially normalized. In the CLASP algorithm, the cortical surfaces start from a spherical polygon model. The vertices are transformed to the spherical model and then they are nonlinearly registered to an average template on the sphere. A highly flexible deformation, in two dimensions, of a template cortex of an individual is used for cortical surface registration. This algorithm matched the crowns of gyri between subjects using a geodesic distance map, and then thickness information on the vertices was transformed to a template. Diffusion smoothing, which generalizes Gaussian kernel smoothing, with 10‐mm full‐width half maximum (FWHM) was then used to increase the signal‐to‐noise ratio [Chung et al., 2002]. Global volume measures of cerebral cortex were calculated from the segmented images by inner and outer cortical surfaces to test for group differences in overall tissue compartment volumes. The distribution of thickness across the whole brain was assessed on a vertex‐by‐vertex basis and statistical parametric maps were constructed to identify differences in cortical thickness between OCD patients and controls. Regional differences in cortical thickness were analyzed using t‐test. Significant effects were reported when they passed a whole‐brain false‐discovery rate (FDR) with an FDR corrected P < 0.05 [Genovese et al., 2002] and their surface sizes exceeded 20 mm2.
After identifying the regions showing differences in cortical thickness between OCD patients and controls, a linear regression model was used to evaluate systematic linear trends between cortical thicknesses in the regions and the YBOCS total score, BDI, BAI, age, and age of onset. A Bonferroni correction was performed, considering the multiple regression procedures (α = 0.05, Bonferroni corrected α = 0.01).
RESULTS
Figures 2a,b show the average distribution of scaled cortical thickness in Talairach space. Average thickness in OCD patients is 1.23–5.46 mm on the lateral and medial brain surfaces, while the thickness of normal subjects is 1.30–5.58 mm. The distributional pattern of average cortical thickness was similar between the groups. In both groups, the lowest cortical thickness on the lateral and medial surfaces was located in superior portions of the postcentral gyrus, while the highest thickness was located in the temporal lobes, mainly in the temporal pole. The average differences in cortical thickness between OCD patients and normal controls were calculated and mapped; these ranged from −0.53 to 0.23 mm (Fig. 2c). Except part of the posterior central gyri and parietal sulci, most regions had a negative cortical thickness difference (OCD‐normal group). OCD patients had a significantly thinner cortical thickness than normal subjects in some areas after interindividual differences in brain size had been removed by transforming images into standard stereotaxic space. Importantly, all loci were in the left hemisphere, and included the ventrolateral prefrontal cortex (VLPFC), middle frontal, precentral, superior temporal, parahippocampal, orbitofrontal, and lingual gyri (Table I; Fig. 3). In the regression model, there were no predictors for the cortical thickness of the above regions based on YBOCS total score, BDI, BAI, age, or age of onset in OCD patients. No regions in OCD patients had a significantly greater cortical thickness than normal subjects.
Figure 2.
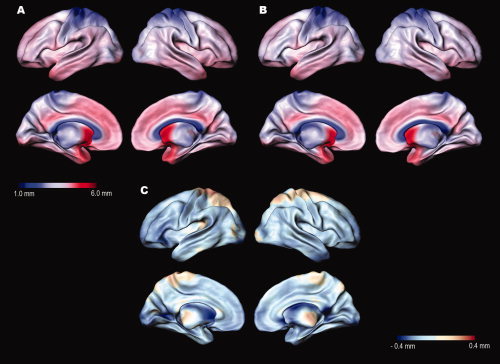
(a) Average cortical thickness mapped for 55 OCD patients and (b) 52 age‐ and sex‐matched control subjects. (c) Average differences in cortical thickness between OCD and normal control subjects (OCD‐normal group). The brain surface is color‐coded according to the color bar, where thickness is shown in millimeters.
Table I.
Regions showing cortical thinning in patients with obsessive–compulsive disorder compared with that in control subjectsa
| Region | Brodmann's area | Area (mm2) | Peak coordinates (x, y, z)a | t‐score |
|---|---|---|---|---|
| Inferior frontal cortex: VLPFC | 47/45 | 1079 | −51, 29, 1 | 4.47 |
| Middle frontal cortex | 10 | 468 | −24, 60, 12 | 3.50 |
| Precentral cortex | 4 | 112 | −51, 2, 46 | 3.40 |
| Superior temporal cortex | 22 | 44 | −64, −38, 12 | 3.20 |
| Parahippocampal cortex | 30 | 154 | −14, −37, −5 | 4.38 |
| Orbitofrontal cortex | 11 | 46 | −6, 47, −27 | 2.97 |
| Lingual cortex | 19 | 106 | −8, −65, 1 | 3.24 |
VLPFC, ventolateral prefrontal cortex.
Foci for significant differences are listed (FDR corrected P < 0.05). Coordinates of the maximum pixel values in Talairach space are expressed as “x, y, z” in millimeters, relative to anterior commissure: left/right, anterior/posterior, and superior/inferior, respectively.
Figure 3.
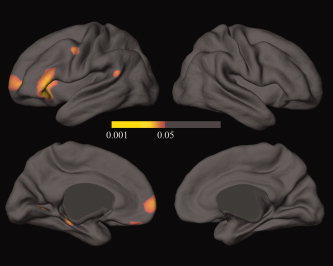
FDR‐corrected statistical maps of the differences in cortical thickness between OCD patients and control subjects. The color bar encodes the FDR‐corrected P‐value demonstrating differences in cortical thickness between OCD patients and control subjects. Callosal, subcallosal, cerebellum, and midbrain regions were excluded.
DISCUSSION
Our measurements revealed reduced grey matter in OCD patients in various regions of the brain, including the VLPFC, OFC, superior temporal, parahippocampal, precentral, and lingual cortices, all located in the left hemisphere. The cortical thinning in the left OFC is consistent with previous VBM and ROI studies [Choi et al., 2004; Kang et al., 2004; Pujol et al., 2004]. However, while ROI studies have consistently reported decreased OFC volumes in OCD patients [Choi et al., 2004; Kang et al., 2004; Szeszko et al., 1999], VBM results regarding OFC have been inconsistent, with some studies showing an increased grey matter volume in OFC [Kim et al., 2001; Valente et al., 2005]. These conflicting results may be partly the result of different methodologies and different sample sizes. Pujol et al. [ 2004] reported a decreased volume of OFC in OCD patients using VBM analysis on a large sample size and an improved methodology of direct‐volume testing, which was not available when we reported altered grey matter density (not volume) in OCD patients [Kim et al., 2001]. In VBM, the local volumes of certain regions of the brain might expand or contract during nonlinear normalization, so to identify regional volume differences in grey matter between groups, it is essential to correct for the effects of volume change [Ashburner and Friston, 2000]; this process was not available at the time of our first report [Kim et al., 2001]. Another VBM analysis, which reported an increased volume of OFC in OCD patients, included a relatively small sample size, which makes comparing the results to a large group of OCD patients difficult, because regional brain volumes in a group of OCD patients might be different from another group of patients with different symptom dimensions [Mataix‐Cols et al., 2005]. More importantly, grey matter is arranged in a highly folded sheet, so two separate loci with small effect size on the cortical surface could converge into one locus of large effect size in volume. Or, conversely, a significant cluster in surface could lose its significance in volume or vice versa. Thus, sulcal geometry must be considered when measuring the volume of cortical grey matter [Fischl et al., 1999; Kippenhan et al., 2005]. Furthermore, the cortical surface‐based registration procedure reduces the misregistration due to interindividual differences based on sulcal and gyral curvature rather than only intensity information in VBM, allowing for much higher localization accuracy of structural and functional features of the human brain [Fischl et al., 1999]. Therefore, the cortical thinning in the left OFC reported here, using sulcal geometry from a large sample size of OCD patients, provides reasonably solid structural evidence of orbitofrontal volume reduction in OCD patients.
The largest area of cortical thinning in OCD patients in this study occurred in the left VLPFC. Unlike OFC, which is considered a candidate region of OCD pathogenesis, other regions such as the VLPFC, left superior temporal, left parahippocampal, left precentral, and left lingual cortices were not expected to show structural abnormality. Nevertheless, various neurophysiologic and neuroimaging studies have provided insight into the associations between these regions and OCD pathophysiology. The VLPFC appears to be hyperactive in OCD patients, who show a significant metabolic decrease in the VLPFC after paroxetine treatment [Saxena et al., 2002]. Also, OCD patients show increased activity in the VLPFC during the Tower of London task, possibly to compensate for a decreased responsiveness in the dorsolateral prefrontal cortex and caudate nucleus [van den Heuvel et al., 2005]. Abnormalities in the lingual cortex of OCD patients have been reported using diffusion tensor imaging [Szeszko et al., 2005]; in this study, the fractional anisotropy representing the degree to which water diffusion is directionally hindered according to internal structure decreased within the white matter of the left lingual cortex in OCD patients compared to normal controls. The lingual cortex was reported to be involved in early visual processing and concomitant modulation. Critchley et al. [ 2000] found that neural activity in the lingual cortex covaried with the generation and representation of somatic arousal. This study concluded that dysfunction in the lingual cortex may lead to inappropriate arousal for the presented stimuli; this is relevant to OCD, which is characterized by abnormal arousal and sensory processing. The precentral cortex also showed functional abnormality in OCD patients. Rossi et al. [ 2005] found enhanced precentral somatosensory evoked potentials and hypofunctioning of centrifugal sensory gating in OCD patients. The authors concluded that dysfunction of the premotor area reflects the inability to modulate sensory information, due to a “tonic” high level of cortical excitability of motor and related areas.
A recent magnetoencephalography (MEG) study of OCD reported topographical abnormalities very similar to those reported herein. Most OCD patients had abnormal MEG activity, but normal electroencephalography (EEG), while normal controls showed neither MEG nor EEG abnormalities [Amo et al., 2004]. In OCD patients, paroxysmal rhythmic MEG activity such as low‐amplitude and/or sharp spikes was found in multiple brain regions, including the OFC, hippocampus, precentral and postcentral gyri, and superior temporal cortices. This finding, which shares anatomical similarity with that reported here, can be regarded as functionally analogous to our results in the context that MEG does measure the activity of generators oriented tangentially in the cortex and also that it can measure the activity from convoluted cortical fissures, which are not available with EEG measurement [Hamalainen, 1992].
Giaccio [2005] argues that the imbalance between dorsal and ventral systems of the cerebral cortex might contribute to OCD pathogenesis. According to Giaccio [2005] and other studies [Pandya and Seltzer, 1982; Petrides and Pandya, 2002; Sanides, 1970; Seltzer and Pandya, 1989], the cerebral cortex has a dual origin, which has resulted in two distinct functional regions: the ventral system, which arises from the amygdala and adjacent olfactory cortex, specializes in identifying stimuli, assigning meaning, and elaborating the motivational aspects of behavior; and the dorsal system, which stems from the hippocampal‐derived cortex, specializes in interpreting the spatial environment and organizing action in time and space. A dominance of the ventral system over the dorsal system, therefore, could cause overevaluation of stimuli and, at the same time, uncertainty of their occurrence in time and space, leading to OCD symptoms such as rumination, excessive guilt, repeated doubts, or self‐examination [Giaccio, 2005]. This hypothesis is supported by the fact that, except for the parahippocampal cortex, the regions of cortical thinning in OCD patients were located in the ventral cortical system: the OFC (Brodmann area: 11), the inferior frontal cortex (47/45), the superior temporal cortex (22), lingual cortex (19), and the middle frontal cortex (10). However, it remains to be explained how the known hyperactivity of the ventral system in OCD patients, as revealed by increased orbitofrontal activity [Baxter et al., 1987; Kang et al., 2003], can occur in a region of reduced grey matter. It may be that the volume loss occurs primarily in the inhibitory neuron. There is some evidence to support this assumption. γ‐Amino‐butyric acid (GABA) is the principal inhibitory neurotransmitter in the central nervous system, and is functionally important in cortical disinhibition. GABA receptor depletion is often a marker of anxiety characterized by harm‐avoidance behavior and an explicit memory bias for threat cues, resulting in heightened sensitivity to negative associations [Crestani et al., 1999]. Patients with panic disorder have increased cerebral blood flow and lower benzodiazepine binding in their parahippocampal–hippocampal area [Reiman et al., 1984; Schlegel et al., 1994]. In addition, while it is widely accepted that serotonergic mechanisms are important to OCD neurobiology, recent evidence suggests that the GABA receptor gene is susceptible in OCD patients [Zai et al., 2005].
Although descriptive, it is noteworthy that only the left hemisphere showed cortical thinning in OCD patients. It is consistent with our previous hypothesis that the primary pathology of OCD occurs in the left hyperfrontality, and that the right hyperfrontality of OCD occurs by a compensatory mechanism; greater left frontal activation is associated with poorer visuospatial function, and greater right frontal activation is associated with better visuospatial function [Shin et al., 2004]. Tot et al. [ 2002] also found a predominant left fronto‐temporal dysfunction in OCD.
Note that one methodological limitation of this study is that assessing the subcortical area is impossible using current algorithms. Fronto‐striatal pathways, including the caudate, putamen, globus pallidus, and substantia nigra, are considered critical to OCD. This limitation is general to most surface reconstruction algorithms. New algorithms enabling the measurement of subcortical grey matter are mandatory for more complete assessment of the grey matter in OCD patients. Another potential limitation of the study is that most patients were receiving psychotropic medications at the time of the MRI. However, illness duration, an indirect measure of medication exposure, was not correlated with cortical thickness of any region showing thinning. Furthermore, except within the basal ganglia, little evidence exists to suggest that medication induces morphometric alterations such as neuronal loss or gliosis [Harrison, 1999; Konradi and Heckers, 2001].
To the best of our knowledge, this is the first study of cortical thickness in OCD patients. Applying an advanced methodology to large sample size, we newly found multiple regions of cortical thinning in OCD patients compared to normal controls. Cortical thinning in the left ventral cortex system could be pathology of OCD.
REFERENCES
- American Psychiatric Association ( 1994): Diagnostic criteria from DSM‐IV. Washington: American Psychiatric Association; 358pp. [Google Scholar]
- Amo C, Quesney LF, Ortiz T, Maestu F, Fernandez A, Lopez‐Ibor MI, Lopez‐Ibor JJ ( 2004): Limbic paroxysmal magnetoencephalographic activity in 12 obsessive‐compulsive disorder patients: A new diagnostic finding. J Clin Psychiatry 65: 156–162. [DOI] [PubMed] [Google Scholar]
- Annett M ( 1970): A classification of hand preference by association analysis. Br J Psychol 61: 303–321. [DOI] [PubMed] [Google Scholar]
- Ashburner J, Friston KJ ( 2000): Voxel‐based morphometry––the methods. Neuroimage 11: 805–821. [DOI] [PubMed] [Google Scholar]
- Aylward EH, Harris GJ, Hoehn‐Saric R, Barta PE, Machlin SR, Pearlson GD ( 1996): Normal caudate nucleus in obsessive‐compulsive disorder assessed by quantitative neuroimaging. Arch Gen Psychiatry 53: 577–584. [DOI] [PubMed] [Google Scholar]
- Baxter LR Jr, Phelps ME, Mazziotta JC, Guze BH, Schwartz JM, Selin CE ( 1987): Local cerebral glucose metabolic rates in obsessive‐compulsive disorder. A comparison with rates in unipolar depression and in normal controls. Arch Gen Psychiatry 44: 211–218. [DOI] [PubMed] [Google Scholar]
- Beck AT, Steer RA ( 1987a): Beck anxiety inventory. San Antonio, TX: The Psychological Corporation, Harcourt Brace Jovanovich. [Google Scholar]
- Beck AT, Steer RA ( 1987b): Beck depression inventory. San Antonio, TX: The Psychological Corporation, Harcourt Brace Jovanovich. [Google Scholar]
- Choi JS, Kang DH, Kim JJ, Ha TH, Lee JM, Youn T, Kim IY, Kim SI, Kwon JS ( 2004): Left anterior subregion of orbitofrontal cortex volume reduction and impaired organizational strategies in obsessive‐compulsive disorder. J Psychiatr Res 38: 193–199. [DOI] [PubMed] [Google Scholar]
- Chung MK, Worsley KJ, Paus T, Robbins S, Evans AC, Taylor J, Giedd JN, Rapoport JL ( 2002): Tensor‐based surface morphometry. Madison, WI: University of Wisconsin. [Google Scholar]
- Collins DL, Neelin P, Peters TM, Evans AC ( 1994): Automatic 3D intersubject registration of MR volumetric data in standardized Talairach space. J Comput Assist Tomogr 18: 192–205. [PubMed] [Google Scholar]
- Crestani F, Lorez M, Baer K, Essrich C, Benke D, Laurent JP, Belzung C, Fritschy JM, Luscher B, Mohler H ( 1999): Decreased GABAA‐receptor clustering results in enhanced anxiety and a bias for threat cues. Nat Neurosci 2: 833–839. [DOI] [PubMed] [Google Scholar]
- Critchley HD, Elliott R, Mathias CJ, Dolan RJ ( 2000): Neural activity relating to generation and representation of galvanic skin conductance responses: A functional magnetic resonance imaging study. J Neurosci 20: 3033–3040. [DOI] [PMC free article] [PubMed] [Google Scholar]
- First MB, Spitzer RL, Gibbon M, Williams JB ( 1996). Structured clinical interview for DSM‐IV axis I disorder. New York: New York State Psychiatric Institute, Biometrics Research. [Google Scholar]
- Fischl B, Sereno MI, Tootell RB, Dale AM ( 1999): High‐resolution intersubject averaging and a coordinate system for the cortical surface. Hum Brain Mapp 8: 272–284. [DOI] [PMC free article] [PubMed] [Google Scholar]
- Genovese CR, Lazar NA, Nichols T ( 2002): Thresholding of statistical maps in functional neuroimaging using the false discovery rate. Neuroimage 15: 870–878. [DOI] [PubMed] [Google Scholar]
- Giaccio RG ( 2006): The dual origin hypothesis: An evolutionary brain‐behavior framework for analyzing psychiatric disorders. Neurosci Biobehav Rev 30: 526–550. [DOI] [PubMed] [Google Scholar]
- Goodman WK, Price LH, Rasmussen SA, Mazure C, Delgado P, Heninger GR, Charney DS ( 1989a): The yale‐brown obsessive compulsive scale. II. Validity. Arch Gen Psychiatry 46: 1012–1016. [DOI] [PubMed] [Google Scholar]
- Goodman WK, Price LH, Rasmussen SA, Mazure C, Fleischmann RL, Hill CL, Heninger GR, Charney DS ( 1989b): The yale‐brown obsessive compulsive scale. I. Development, use, and reliability. Arch Gen Psychiatry 46: 1006–1011. [DOI] [PubMed] [Google Scholar]
- Grachev ID, Breiter HC, Rauch SL, Savage CR, Baer L, Shera DM, Kennedy DN, Makris N, Caviness VS, Jenike MA ( 1998): Structural abnormalities of frontal neocortex in obsessive‐compulsive disorder. Arch Gen Psychiatry 55: 181–182. [DOI] [PubMed] [Google Scholar]
- Hamalainen MS ( 1992): Magnetoencephalography: A tool for functional brain imaging. Brain Topogr 5: 95–102. [DOI] [PubMed] [Google Scholar]
- Harrison PJ ( 1999): The neuropathological effects of antipsychotic drugs. Schizophr Res 40: 87–99. [DOI] [PubMed] [Google Scholar]
- Hollingshead AB, Redlich FL ( 1958): Social Class and Mental Illness. New York: Wiley. [DOI] [PMC free article] [PubMed] [Google Scholar]
- Im K, Lee JM, Lee J, Shin YW, Kim IY, Kwon JS, Kim SI ( 2006): Gender difference analysis of cortical thickness in healthy young adults with surface‐based methods. Neuroimage 31: 31–38. [DOI] [PubMed] [Google Scholar]
- Kabani N, Le Goualher G, MacDonald D, Evans AC ( 2001): Measurement of cortical thickness using an automated 3‐D algorithm: A validation study. Neuroimage 13: 375–380. [DOI] [PubMed] [Google Scholar]
- Kang DH, Kwon JS, Kim JJ, Youn T, Park HJ, Kim MS, Lee DS, Lee MC ( 2003): Brain glucose metabolic changes associated with neuropsychological improvements after 4 months of treatment in patients with obsessive‐compulsive disorder. Acta Psychiatr Scand 107: 291–297. [DOI] [PubMed] [Google Scholar]
- Kang DH, Kim JJ, Choi JS, Kim YI, Kim CW, Youn T, Han MH, Chang KH, Kwon JS ( 2004): Volumetric investigation of the frontal‐subcortical circuitry in patients with obsessive‐compulsive disorder. J Neuropsychiatry Clin Neurosci 16: 342–349. [DOI] [PubMed] [Google Scholar]
- Kim JJ, Lee MC, Kim J, Kim IY, Kim SI, Han MH, Chang KH, Kwon JS ( 2001): Grey matter abnormalities in obsessive‐compulsive disorder: statistical parametric mapping of segmented magnetic resonance images. Br J Psychiatry 179: 330–334. [DOI] [PubMed] [Google Scholar]
- Kim JS, Singh V, Lee JK, Lerch J, Ad‐Dab'bagh Y, MacDonald D, Lee JM, Kim SI, Evans AC ( 2005): Automated 3‐D extraction and evaluation of the inner and outer cortical surfaces using a Laplacian map and partial volume effect classification. Neuroimage 27: 210–221. [DOI] [PubMed] [Google Scholar]
- Kippenhan JS, Olsen RK, Mervis CB, Morris CA, Kohn P, Meyer‐Lindenberg A, Berman KF ( 2005): Genetic contributions to human gyrification: Sulcal morphometry in Williams syndrome. J Neurosci 25: 7840–7846. [DOI] [PMC free article] [PubMed] [Google Scholar]
- Konradi C, Heckers S ( 2001): Antipsychotic drugs and neuroplasticity: Insights into the treatment and neurobiology of schizophrenia. Biol Psychiatry 50: 729–742. [DOI] [PMC free article] [PubMed] [Google Scholar]
- Lee JK, Lee JM, Kim JS, Kim IY, Evans AC, Kim SI ( 2006): A novel quantitative cross‐validation of different cortical surface reconstruction algorithms using MRI phantom. Neuroimage 31: 572–584. [DOI] [PubMed] [Google Scholar]
- Lerch JP, Pruessner JC, Zijdenbos A, Hampel H, Teipel SJ, Evans AC ( 2005): Focal decline of cortical thickness in Alzheimer's disease identified by computational neuroanatomy. Cereb Cortex 15: 995–1001. [DOI] [PubMed] [Google Scholar]
- MacDonald D, Kabani N, Avis D, Evans AC ( 2000): Automated 3‐D extraction of inner and outer surfaces of cerebral cortex from MRI. Neuroimage 12: 340–356. [DOI] [PubMed] [Google Scholar]
- Mataix‐Cols D, Rosario‐Campos MC, Leckman JF ( 2005): A multidimensional model of obsessive‐compulsive disorder. Am J Psychiatry 162: 228–238. [DOI] [PubMed] [Google Scholar]
- Narr KL, Bilder RM, Toga AW, Woods RP, Rex DE, Szeszko PR, Robinson D, Sevy S, Gunduz‐Bruce H, Wang YP, De Luca H, Thompson PM ( 2005): Mapping cortical thickness and gray matter concentration in first episode schizophrenia. Cereb Cortex 15: 708–719. [DOI] [PubMed] [Google Scholar]
- Ongur D, Ferry AT, Price JL ( 2003): Architectonic subdivision of the human orbital and medial prefrontal cortex. J Comp Neurol 460: 425–449. [DOI] [PubMed] [Google Scholar]
- Pandya DN, Seltzer B ( 1982): Intrinsic connections and architectonics of posterior parietal cortex in the rhesus monkey. J Comp Neurol 204: 196–210. [DOI] [PubMed] [Google Scholar]
- Petrides M, Pandya DN ( 2002): Comparative cytoarchitectonic analysis of the human and the macaque ventrolateral prefrontal cortex and corticocortical connection patterns in the monkey. Eur J Neurosci 16: 291–310. [DOI] [PubMed] [Google Scholar]
- Pujol J, Soriano‐Mas C, Alonso P, Cardoner N, Menchon JM, Deus J, Vallejo J ( 2004): Mapping structural brain alterations in obsessive‐compulsive disorder. Arch Gen Psychiatry 61: 720–730. [DOI] [PubMed] [Google Scholar]
- Reiman EM, Raichle ME, Butler FK, Herscovitch P, Robins E ( 1984): A focal brain abnormality in panic disorder, a severe form of anxiety. Nature 310: 683–685. [DOI] [PubMed] [Google Scholar]
- Robinson D, Wu H, Munne RA, Ashtari M, Alvir JM, Lerner G, Koreen A, Cole K, Bogerts B ( 1995): Reduced caudate nucleus volume in obsessive‐compulsive disorder. Arch Gen Psychiatry 52: 393–398. [DOI] [PubMed] [Google Scholar]
- Rosenberg DR, Keshavan MS, O'Hearn KM, Dick EL, Bagwell WW, Seymour AB, Montrose DM, Pierri JN, Birmaher B ( 1997): Frontostriatal measurement in treatment‐naive children with obsessive‐compulsive disorder. Arch Gen Psychiatry 54: 824–830. [DOI] [PubMed] [Google Scholar]
- Rossi S, Bartalini S, Ulivelli M, Mantovani A, Di Muro A, Goracci A, Castrogiovanni P, Battistini N, Passero S ( 2005): Hypofunctioning of sensory gating mechanisms in patients with obsessive‐compulsive disorder. Biol Psychiatry 57: 16–20. [DOI] [PubMed] [Google Scholar]
- Sanides F ( 1970): Functional architecture of motor and sensory cortices in primates in the light of a new concept of neocortex evolution. Adv Primatol 1: 137–208. [Google Scholar]
- Saxena S, Brody AL, Schwartz JM, Baxter LR ( 1998): Neuroimaging and frontal‐subcortical circuitry in obsessive‐compulsive disorder. Br J Psychiatry Suppl 35: 26–37. [PubMed] [Google Scholar]
- Saxena S, Brody AL, Ho ML, Alborzian S, Maidment KM, Zohrabi N, Ho MK, Huang SC, Wu HM, Baxter LR Jr ( 2002): Differential cerebral metabolic changes with paroxetine treatment of obsessive‐compulsive disorder vs major depression. Arch Gen Psychiatry 59: 250–261. [DOI] [PubMed] [Google Scholar]
- Schlegel S, Steinert H, Bockisch A, Hahn K, Schloesser R, Benkert O ( 1994): Decreased benzodiazepine receptor binding in panic disorder measured by IOMAZENIL‐SPECT. A preliminary report. Eur Arch Psychiatry Clin Neurosci 244: 49–51. [DOI] [PubMed] [Google Scholar]
- Seltzer B, Pandya DN ( 1989): Intrinsic connections and architectonics of the superior temporal sulcus in the rhesus monkey. J Comp Neurol 290: 451–471. [DOI] [PubMed] [Google Scholar]
- Shin YW, Ha TH, Kim SY, Kwon JS ( 2004): Association between EEG α power and visuospatial function in obsessive‐compulsive disorder. Psychiatry Clin Neurosci 58: 16–20. [DOI] [PubMed] [Google Scholar]
- Shin YW, Kwon JS, Kim JJ, Kang DH, Youn T, Kang KW, Kang E, Lee DS, Lee MC ( 2006): Altered neural circuit for working memory before and after symptom provocation in patients with obsessive‐compulsive disorder. Acta Psychiatr Scand 113: 420–429. [DOI] [PubMed] [Google Scholar]
- Sled JG, Zijdenbos AP, Evans AC ( 1998): A nonparametric method for automatic correction of intensity nonuniformity in MRI data. IEEE Trans Med Imaging 17: 87–97. [DOI] [PubMed] [Google Scholar]
- Szeszko PR, Robinson D, Alvir JM, Bilder RM, Lencz T, Ashtari M, Wu H, Bogerts B ( 1999): Orbital frontal and amygdala volume reductions in obsessive‐compulsive disorder. Arch Gen Psychiatry 56: 913–919. [DOI] [PubMed] [Google Scholar]
- Szeszko PR, Ardekani BA, Ashtari M, Malhotra AK, Robinson DG, Bilder RM, Lim KO ( 2005): White matter abnormalities in obsessive‐compulsive disorder: A diffusion tensor imaging study. Arch Gen Psychiatry 627: 782–790. [DOI] [PubMed] [Google Scholar]
- Talairach J, Tournoux P ( 1988): Co‐planar Stereotaxic Atlas of the Human Brain: An Approach to Medical Cerebral Imaging. New York: Thieme Medical Publishers; 122 pp. [Google Scholar]
- Tisserand DJ, Pruessner JC, Sanz Arigita EJ, van Boxtel MP, Evans AC, Jolles J, Uylings HB ( 2002): Regional frontal cortical volumes decrease differentially in aging: An MRI study to compare volumetric approaches and voxel‐based morphometry. Neuroimage 17: 657–669. [PubMed] [Google Scholar]
- Tot S, Ozge A, Comelekoglu U, Yazici K, Bal N ( 2002): Association of QEEG findings with clinical characteristics of OCD: Evidence of left frontotemporal dysfunction. Can J Psychiatry 47: 538–545. [DOI] [PubMed] [Google Scholar]
- Valente AA Jr, Miguel EC, Castro CC, Amaro E Jr, Duran FL, Buchpiguel CA, Chitnis X, McGuire PK, Busatto GF ( 2005): Regional gray matter abnormalities in obsessive‐compulsive disorder: A voxel‐based morphometry study. Biol Psychiatry 58: 479–487. [DOI] [PubMed] [Google Scholar]
- van den Heuvel OA, Veltman DJ, Groenewegen HJ, Cath DC, van Balkom AJ, van Hartskamp J, Barkhof F, van Dyck R ( 2005): Frontal‐striatal dysfunction during planning in obsessive‐compulsive disorder. Arch Gen Psychiatry 62: 301–309. [DOI] [PubMed] [Google Scholar]
- Yoon U, Lee JM, Kim JJ, Lee SM, Kim IY, Kwon JS, Kim SI ( 2003): Modified magnetic resonance image based parcellation method for cerebral cortex using successive fuzzy clustering and boundary detection. Ann Biomed Eng 31: 441–447. [DOI] [PubMed] [Google Scholar]
- Zai G, Arnold P, Burroughs E, Barr CL, Richter MA, Kennedy JL ( 2005): Evidence for the gamma‐amino‐butyric acid type B receptor 1 (GABBR1) gene as a susceptibility factor in obsessive‐compulsive disorder. Am J Med Genet B Neuropsychiatr Genet 134: 25–29. [DOI] [PubMed] [Google Scholar]
- Zald DH, Kim SW ( 1996): Anatomy and function of the orbital frontal cortex. I. Anatomy, neurocircuitry, and obsessive‐compulsive disorder. J Neuropsychiatry Clin Neurosci 8: 125–138. [DOI] [PubMed] [Google Scholar]
- Zijdenbos AP, Forghani R, Evans AC ( 2002): Automatic pipeline analysis of 3‐D MRI data for clinical trials: Application to multiple sclerosis. IEEE Trans Med Imaging 21: 1280–1291. [DOI] [PubMed] [Google Scholar]