

Abstract
Functional MRI (fMRI) has begun to be used to explore human brain activity during ecological and natural conditions. Arterial spin labeling (ASL) perfusion fMRI provides an appealing approach for imaging sustained brain activity during natural conditions because of its long‐term temporal stability and ability to noninvasively quantify absolute cerebral blood flow (CBF). The present study used ASL perfusion fMRI to measure brain activation patterns associated with natural vision by concurrently recording CBF and blood oxygen level‐dependent (BOLD) contrasts while subjects were freely viewing a cartoon movie. Reliable quantitative whole‐brain CBF values (∼60 mL/100g/min) as well as regional CBF values (45∼80 mL/100g/min) were measured during movie viewing and resting states. The perfusion contrast revealed CBF increases in multiple visual pathway areas and frontal areas, and CBF decreases in ventromedial frontal cortex and superior temporal cortex during movie viewing compared to resting states. Concurrent BOLD contrast revealed similar but weaker activation and deactivation patterns. Regression analyses of both CBF data and BOLD data showed significant associations between activation in the middle temporal (MT) region and subjects' perception of motion. Region of interest analysis based on a priori literature‐defined MT demonstrated significant monotonic stepwise associations between the intensity of motion perception and the CBF and BOLD signal changes. These results demonstrate the feasibility of using ASL perfusion fMRI for imaging both sustained and dynamic effects in neural activation during natural and ecologically valid situations, and support the notion of maintained functional segregation and specialization during natural vision. Hum Brain Mapp, 2006. © 2006 Wiley‐Liss, Inc.
Keywords: natural vision, ASL perfusion fMRI, CBF, BOLD, MT, motion perception
INTRODUCTION
Although the neural processing of visual perception and cognition has been studied for more than five decades, how the brain processes natural scenes in everyday vision remains poorly understood. Previous studies have primarily explored visual mechanisms by measuring neural responses to perceptually idealized and fairly simple stimuli (e.g., bars, gratings, letters, etc.) that are easy to parameterize and control, and have demonstrated important insights into understanding vision such as the hierarchical information processing in the visual system [Riesenhuber and Poggio,1999]. However, there is no guarantee that the responses to such artificially simplified stimuli may be used to predict neural responses to natural scenes that differ from the artificial stimuli used in laboratories. Indeed, recent studies have demonstrated both qualitative and quantitative differences between the visual processing of natural scenes and that of simple geometric stimuli. For instance, Vinje and Gallant [2000] showed increasing coding sparseness and response decorrelation in primary visual cortex neurons during natural vision, and Li et al. [2002] demonstrated successful categorization of natural images in conditions under which simple geometric shapes cannot be distinguished. These findings indicate that natural stimuli are processed more efficiently than artificial stimuli, and suggest the need to further characterize neural activity during processing of natural and everyday input [Kayser et al.,2004]. This type of study is ideally performed in human subjects, where the accompanying perceptual and behavioral responses are most easily determined.
Blood oxygenation level‐dependent (BOLD) functional MRI (fMRI) has emerged as the preeminent method for visualization of brain activity. While the bulk of BOLD fMRI studies have confirmed associations between neural activations in specific brain regions and particular sensorimotor or cognitive functions, less progress has been made in exploring neural activation patterns underlying natural vision [but see Bartels et al.,2004a, b; Hasson et al.,2004; Zacks et al.,2001]. The challenges in studying natural vision lie in the facts that natural vision usually evolves over much longer time‐scales than the duration of strictly controlled experimental conditions in most BOLD fMRI studies, involves complex scenes of multiple objects moving in spatial and temporal dimensions, and includes inevitable interactions between vision and other modalities like language and emotion.
The present study used an alternative fMRI technique—arterial spin labeling (ASL) perfusion fMRI—to measure brain activity during a natural vision task: freely viewing a cartoon movie. ASL perfusion fMRI provides a noninvasive quantification (i.e., mL of blood/100 g of tissue/min) of cerebral blood flow (CBF) by using magnetically labeled arterial blood water as an endogenous tracer [Detre et al.,1992; Williams et al.,1992]. Perfusion images are typically obtained from successive pairwise subtractions between images acquired with and without labeling, thereby effectively minimizing the effects of low‐frequency baseline drifts. Compared to BOLD contrast, perfusion contrast has been reported to provide more specific spatial localizations [Duong et al.,2001] and a more direct association with neuronal activation [Buxton et al.,1997]. ASL perfusion fMRI has also been reported to provide reliable measures of CBF [Feng et al.,2004; Parkes et al.,2004], excellent reproducibility over long‐term time periods, and less across‐subject variability [Aguirre et al.,2002; Wang et al.,2003a, b]. These features suggest that ASL perfusion fMRI would provide an appealing alternative to BOLD fMRI for imaging brain activations during sustained or long time‐scale processes such as learning, emotion, and natural vision. However, most previous perfusion fMRI studies were conducted for simple sensorimotor tasks such as passive visual stimulation or finger tapping [Aguirre et al.,2002; Garraux et al.,2005; Mildner et al.,2003; Talagala and Noll,1998; Wang et al.,2003a; Yang et al.,2000], and classical cognitive paradigms such as sustained attention and verb generation only with single‐slice acquisition [Ye et al.,1998; Yee et al.,2000]. Few ASL perfusion fMRI studies have measured distributed cortical networks underlying high‐level cognitive tasks with multiple slices covering the whole brain [but see Kim et al.,2006; Olson et al.,2006; Wang et al.,2005b] and, notably, no perfusion study to date has explored the brain activation patterns associated with natural vision.
We recently implemented whole‐brain multislice continuous ASL (CASL) perfusion fMRI with a single transmit/receive coil at 3.0 T [Wang et al.,2005a]. The primary purpose of this study was to demonstrate the feasibility of CASL perfusion fMRI for imaging distributed neural networks associated with freely viewing movies. Using CASL fMRI with gradient echo imaging, we are able to concurrently acquire BOLD and perfusion data, which allows the integration and direct comparison of perfusion and BOLD signal changes in the same dataset [Wong et al.,1997]. The second aim of the present study was to compare the concurrently recorded CBF and BOLD signal variations during natural vision. Previous studies [Bartels et al.,2004a, b] on natural vision using the BOLD contrast have suggested that the perception of independent visual features (e.g., color, faces, and human bodies) is associated with spatially separate and functionally specialized cortical areas, which indicates preserved functional segregation and specialization of the visual cortex during natural vision. The third aim of the present study was to investigate the functional specialization of motion perception during complex and dynamic natural vision with perfusion imaging as well as BOLD imaging. We employed both conventional regression analysis and a priori region of interest (ROI) analysis (middle temporal region (MT), based on the literature‐defined coordinates) to reveal the associations between the subjective perception of motion and CBF and BOLD activations.
SUBJECTS AND METHODS
Stimuli and Subjects
Eleven healthy subjects (four males, age 19–26 years) were scanned on a Siemens 3.0 T Trio whole‐body scanner (Siemens AG, Erlangen, Germany), using a standard transmit/receive headcoil. Written informed consent was obtained prior to all human studies according to Institutional Review Board approval from the University of Pennsylvania. A 6.5‐min comic cartoon, Roadrunner “Gee Whiz‐z‐z‐z‐z‐z‐z” (Warner Bros., 1956), was selected as a natural stimulus because it does not require sound for doing fMRI. Subjects viewed the cartoon without sound through a reflective optical system mounted on the headcoil.
Imaging Data Acquisition
An amplitude‐modulated continuous ASL technique was used for perfusion fMRI scans. Arterial spin labeling was implemented with a 0.16 G/cm gradient and 22.5 mG RF irradiation applied 8 cm beneath the center of the acquired slices. The control pulse was an amplitude‐modulated version of the labeling pulse based on a sinusoid function [Wang et al., 2005]. The tagging/control duration was 1.6 s. Interleaved images with and without labeling were acquired using a gradient echo‐planar imaging (EPI) sequence; thus, both perfusion and BOLD data were concurrently acquired in the same dataset. A delay of 0.8 s was inserted between the end of the labeling pulse and image acquisition to reduce transit artifact. Acquisition parameters were: FOV = 22 cm, matrix = 64 × 64, TR = 3 s, TE = 17 ms, flip angle = 90°. Twelve slices (6 mm thickness with 1.5 mm gap) were acquired from inferior to superior in a sequential order. High‐resolution anatomic images were obtained by a 3D MPRAGE sequence with TR = 1620 ms, TI = 950 ms, TE = 3 ms, flip angle = 15°, 160 contiguous slices of 1.0 mm thickness, FOV = 192 × 256 mm2, matrix = 192 × 256. The scan protocol for each subject was one run lasting 13.5 min with 270 acquisitions, including a 3.5‐min fixation as the premovie resting state (Rest1); 6.5 min cartoon viewing; and a 3.5‐min fixation as the postmovie resting state (Rest2).
Imaging Data Analysis
Functional image processing and analysis were carried out primarily with the Statistical Parametric Mapping software (SPM99, Wellcome Department of Cognitive Neurology, UK, implemented in Matlab 6, MathWorks, Natick, MA). For each subject, functional images were realigned to correct for head motion and coregistered with the anatomical image. Perfusion‐weighted image series were then generated by the simple pairwise subtraction of the label and control images, followed by conversion to absolute CBF image series based on a single compartment CASL perfusion model [Wang et al.,2005a]. To minimize the contamination of BOLD signal by potential perfusion signal changes, the control EPI images (without labeling) were used as BOLD image series. Due to the residual labeling effect of the amplitude modulated control pulses, the perfusion weighting in the control BOLD images is estimated at about 0.25% [Wang et al.,2005a]. Thus, the resulting CBF and BOLD datasets both contained 135 images for each subject with an effective TR of 6 s. CBF and BOLD images were normalized to a 2 × 2 × 2 mm3 Montreal Neurological Institute (MNI) template using bilinear interpolation and spatially smoothed using a Gaussian filter with a full‐width at half‐maximum (FWHM) of 8 mm. Voxelwise analysis using the General Linear Model (GLM) was applied to the CBF images and BOLD images for each individual subject (first‐level analysis). No temporal smoothing or filtering was applied to CBF images since there was no substantial temporal autocorrelation in the power spectrum of CBF data [Aguirre et al.,2002]. A first‐order autoregressive (AR) model [Bullmore et al.,1996; Friston et al.,2000] was applied to BOLD time series to remove the temporal autocorrelation and pre‐whiten the data before fitting the GLM.
To explore the brain activations induced by freely watching the movie, one contrast was defined in the GLM analysis for both BOLD and CBF data, namely, the activation difference between movie viewing and the resting baselines (movie/rest). Group analysis of random effects (one‐sample t‐test) was then conducted across the group of subjects based on the beta images from the first‐level (individual subject) analysis to allow population inference. Areas of significant activation and deactivation associated with the contrasts were identified for the mapwise significance level of false discovery rate (FDR) [Genovese et al.,2002] corrected P‐value smaller than 0.05 and cluster size larger than 60 voxels. Since no deactivations exceeded the whole‐brain corrected significance level, the deactivation (higher activation in resting states than movie viewing) threshold was reduced to the uncorrected P‐value smaller than 0.001 and cluster size larger than 60 voxels. Quantitative CBF values, as well as relative CBF and BOLD percentage signal changes in the peak activation and deactivation voxels, were extracted and calculated by the SPM Marsbar toolbox [Brett et al.,2002].
To explore the functional specialization of motion perception during natural vision, a separate group of 12 subjects (five males, age 20–33 years) who did not participate in fMRI scanning were asked to give subjective ratings of perceived intensity of motion every 6 s during watching the cartoon movie. The behavioral ratings were performed in a separate group (other than those undergoing fMRI scans) to avoid the interruption of freely viewing the movie by the task of motion rating and allow generalization of the results. Similar to the rating task used by Bartels et al. [2004a], subjects rated the movie on a four‐point scale: 1, no motion; 2, moderate motion; 3, medium motion; and 4, intense motion. Cross‐correlation analyses were first applied to the individual rating curves to identify the stability of motion perception across individual subjects. The 12 individual ratings were averaged and temporally delayed one sample point (6 s) before entering the imaging data analysis to compensate for hemodynamic delay. For the first‐level analysis, a simple regression with the subjective motion rating curve as a feature regressor was performed on the preprocessed BOLD and CBF images during the movie viewing part for each individual subject. Sinc subtraction was used to reconstruct the CBF images for the regression analysis to minimize the BOLD contamination in perfusion data [Aguirre et al.,2002]. A group analysis of random effects (one‐sample t‐test) was then conducted across the group of subjects based on the beta images from the first‐level analysis to allow population inference. Areas of significant activation for the regression analysis were identified for the significance level of uncorrected P‐value smaller than 0.001 and cluster size larger than 60 voxels.
The ROI analysis was performed on an a‐priori defined MT complex based on the literature. The localizations of bilateral MT were averaged from several neuroimaging studies of motion perception [Dupont et al.,2003; Eden et al.,1996; Smith et al.,1998; Sunaert et al.,1999; Tootell et al.,1995; Watson et al.,1993]. Spheres with a radius of 10 mm and centered at Talairach coordinates [−45, −67, 5] in the left hemisphere and [45, −67, 5] in the right hemisphere were defined as the ROI. The CBF and BOLD signal intensities within bilateral MT ROIs were extracted by the SPM Marsbar toolbox [Brett et al.,2002]. The mean time course of the quantitative CBF (mL of blood/100 g of tissue/min) and that of the relative BOLD signal changes in MT were averaged from the individual ROI data and correlated with the mean motion rating curve using SPSS 12 software (SPSS, Chicago, IL). The CBF and BOLD signal changes associated with each motion rating level were calculated by first averaging the CBF signal intensities and BOLD percentage signal changes during the time points where the motion ratings were within each level (little motion: rating < 1.5; moderate motion: 1.5 ≤ rating < 2.5; medium motion: 2.5 ≤ rating < 3.5; intense motion: rating ≥ 3.5) for each individual subject and then averaging across subjects. These values of MT activation levels were plotted against the four perceived motion rating levels.
RESULTS
Behavioral Rating
The mean correlation coefficient from the cross‐correlation of the psychometrically determined subjective experiences of motion as rated by 12 subjects was 0.39 ± 0.04 (P = 0.001), demonstrating the stability of motion perception across individual subjects and the feasibility of using it for further imaging data analysis.
Imaging Results
Figure 1 illustrates quantitative CBF images from a representative subject with 12 slices covering almost the whole brain from the top of the brain to the cerebellum. Perfusion in all brain regions was visualized with good sensitivity, and clear contrast between gray and white matter was observed in the perfusion intensity. Figure 2 shows mean quantitative whole‐brain CBF variations during movie viewing and two resting states for all 11 subjects. Quite reliable absolute CBF intensities (less than 15% variations) were detected for most subjects during the 13.5 minutes scanning: the group mean whole brain CBF values (mean ± SE, in mL/100g/min) were 59.7 ± 3.0, 61.2 ± 2.7, and 60.7± 2.6 (repeated‐measures ANOVA, F(2,9) = 0.703, P > 0.5) for the premovie resting, freely movie viewing, and postmovie resting, respectively.
Figure 1.
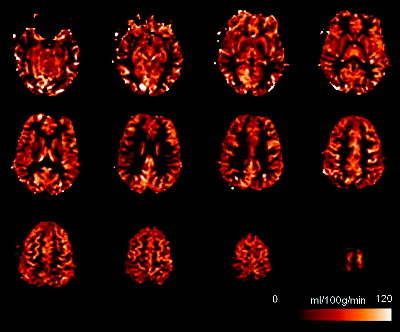
Quantitative mean CBF images in native space (12 axial slices) from a representative subject (total acquisition time = 13.5 min).
Figure 2.
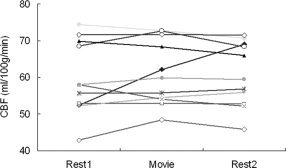
The whole‐brain CBF variations during the premovie resting state (Rest1), freely viewing movie (Movie), and postmovie resting state (Rest2) for all 11 subjects.
Figure 3 illustrates the CBF and BOLD activations from the group analysis of all subjects and the GLM of a representative subject during free viewing of the movie as compared to fixation. The CBF contrast revealed significant activations in multiple visual pathway areas, frontal areas, and subcortical structures, including bilateral striate and extrastriate cortex, bilateral posterior temporal and middle temporal cortex, bilateral inferior parietal and superior parietal cortex, bilateral inferior frontal cortex, right middle frontal cortex, and left thalamus. Compared to the perfusion contrast, the BOLD contrast showed a similar but reduced pattern of activations in the visual pathway areas and frontal areas, with greater activations in the bilateral thalamus. Both CBF and BOLD contrasts also revealed similar deactivations in bilateral anterior cingulate/medial prefrontal cortex, and bilateral superior temporal/Heschl cortex. I summarizes the MNI coordinates and peak Z scores of all activation and deactivation clusters, as well as the corresponding CBF and BOLD percentage signal changes. A significant correlation (R = 0.81, P < 0.001) was observed between the CBF and BOLD percentage signal changes.
Figure 3.
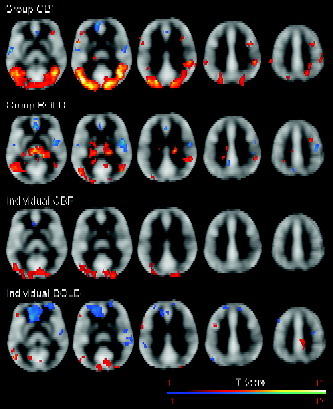
The CBF and BOLD activations and deactivations from the group analysis (FDR corrected P < 0.05, cluster size > 60 voxels) and the GLM analysis of a representative subject (uncorrected P < 0.001, cluster size > 60 voxels). Activations are superimposed on the mean CBF images averaged from all 11 subjects. Images are displayed according to neurological convention.
Table I.
MNI coordinates, peak Z scores, and the corresponding CBF and BOLD percentage signal changes (%) in the peak activation (threshold as FDR‐corrected P < 0.05 and cluster size larger than 60 voxels) and deactivation voxels (threshold as uncorrected P < 0.001 and cluster size larger than 60 voxels) from the group‐level analysis of CBF and BOLD data during freely viewing movie compared to the resting states
| Cluster size | MNI coordinates | Peak Z | CBF, % | BOLD, % | |||
|---|---|---|---|---|---|---|---|
| x | y | z | |||||
| CBF activation areas | |||||||
| B. visual pathway areas | 15359 | −42 | −82 | 4 | 5.67 | 25.0 | 0.39 |
| 46 | −66 | 2 | 5.63 | 31.0 | 0.51 | ||
| 20 | −90 | 10 | 5.46 | 29.3 | 0.40 | ||
| R. Middle frontal | 392 | 46 | 6 | 52 | 4.45 | 7.2 | 0.38 |
| 48 | 6 | 34 | 4.05 | 8.9 | 0.13 | ||
| L. Inferior frontal | 258 | −50 | 12 | 8 | 4.22 | 3.9 | 0.08 |
| R. Inferior frontal | 134 | 44 | 32 | −4 | 4.14 | 7.2 | 0.05 |
| L. Inferior frontal | 117 | −42 | 30 | 4 | 4.10 | 9.8 | 0.01 |
| L. Supramarginal/Inferior parietal | 238 | −60 | −38 | 38 | 3.98 | 5.1 | 0.05 |
| −48 | −38 | 40 | 2.96 | 5.9 | 0.05 | ||
| R. Inferior frontal | 76 | 36 | 16 | 24 | 3.57 | 6.9 | 0.19 |
| L. Thalamus | 71 | −12 | −28 | 6 | 3.36 | 6.8 | 0.28 |
| CBF deactivation areas | |||||||
| L. Superior temporal/Heschl | 232 | −58 | −10 | −6 | 5.73 | −8.9 | −0.09 |
| −58 | −6 | 6 | 4.40 | −7.0 | −0.24 | ||
| B. Anterior cingulate/medial frontal | 525 | −6 | 48 | −2 | 4.56 | −9.2 | −0.35 |
| −6 | 54 | 8 | 4.11 | −10.9 | −0.24 | ||
| R. Supeior temporal/Heschl | 150 | 62 | −10 | 12 | 4.06 | −8.0 | −0.46 |
| 52 | −8 | 6 | 3.37 | −9.4 | −0.32 | ||
| B. Anterior cingulate | 72 | −6 | 32 | 26 | 3.92 | −5.5 | −0.12 |
| 4 | 34 | 22 | 3.50 | −8.1 | −0.26 | ||
| BOLD activation areas | |||||||
| B. Thalamus | 2674 | 36 | −34 | −8 | 5.29 | 5.1 | 0.19 |
| 12 | −26 | 0 | 5.04 | 2.0 | 0.30 | ||
| 20 | −22 | 0 | 4.87 | 20.9 | 0.24 | ||
| L. Occipital/Middle temporal | 1033 | −48 | −78 | 0 | 5.14 | 17.7 | 0.76 |
| −48 | −66 | 2 | 4.61 | 27.4 | 0.49 | ||
| R. Middle temporal | 418 | 50 | −78 | 0 | 4.95 | 25.9 | 0.51 |
| 52 | −70 | 8 | 4.17 | 17.0 | 0.64 | ||
| R. Superior temporal | 363 | 62 | −40 | 30 | 4.65 | 15.9 | 0.23 |
| 54 | −46 | 24 | 3.84 | 28.6 | 0.32 | ||
| L. Occipital | 193 | −20 | −98 | 6 | 4.05 | 34.0 | 0.48 |
| −14 | −94 | 2 | 3.49 | 0.4 | 0.42 | ||
| R. Precuneus | 76 | 6 | −52 | 50 | 3.61 | 30.6 | 0.14 |
| R. Occipital | 87 | 18 | −94 | 4 | 3.46 | 5.1 | 0.60 |
| BOLD deactivation areas | |||||||
| B. Anterior cingulate/medial frontal | 775 | 0 | 38 | 2 | 4.62 | −13.6 | −0.45 |
| 0 | 30 | 20 | 3.94 | −8.8 | −0.31 | ||
| 4 | 54 | −2 | 3.88 | −9.5 | −0.45 | ||
| R. Superior temporal/Heschl | 1575 | 58 | 0 | 4 | 4.61 | −7.0 | −0.40 |
| 46 | −6 | −10 | 4.52 | −4.9 | −0.32 | ||
| 50 | −16 | 46 | 4.47 | −1.3 | −0.21 | ||
| L. Precuneus/Posterior cingulate | 259 | −2 | −50 | 34 | 4.11 | −4.0 | −0.21 |
| −8 | −62 | 38 | 3.50 | −2.2 | −0.29 | ||
| L. Heschl/Superior temporal | 106 | −48 | −12 | 6 | 3.59 | −5.6 | −0.18 |
| −50 | −8 | −2 | 3.55 | −10.7 | −0.25 | ||
L. left hemisphere; R. right hemisphere; B., bilateral; CBF, cerebral blood flow.
The brain activation results from the regression analysis of motion perception for BOLD and CBF data are illustrated in Figure 4 and listed in II. Using a significance level of uncorrected P < 0.001, the CBF contrast showed significant activations in bilateral MT complex and left occipital cortex, while the BOLD contrast showed significant activation only in right MT. Reducing the significance level to uncorrected P < 0.005, the BOLD contrast also revealed significant activation in left MT. The extracted ROI results based on the literature‐defined MT complex are shown in Figure 5. Both CBF and BOLD signal time courses showed significant correlations with the subjective rating curve of motion perception during free viewing of the movie (for BOLD, R = 0.28, P = 0.02; for CBF, R = 0.37, P = 0.002). The quantitative regional CBF in MT showed a progressive increase from 64.3 to 76.4 mL/100g/min (repeated‐measures ANOVA, F(3,30) = 6.36, P = 0.002) as subjective ratings of motion perception increased from little motion perception to medium and intense motion perception. The concurrent BOLD signal changes in MT also showed a clear increase from 0.15% for little motion perception, to 0.59% for intense motion perception (repeated‐measures ANOVA, F(3,30) = 13.58, P < 0.001), but appeared to plateau for increased perceived motion as compared to CBF.
Figure 4.
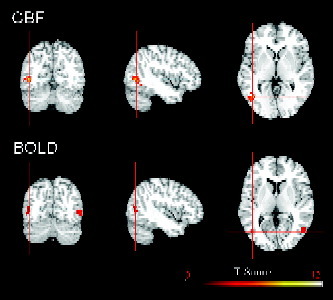
The regression analysis revealed bilateral MT activations from CBF data (uncorrected P < 0.001, cluster size > 60 voxels) and BOLD data (uncorrected P < 0.005, cluster size > 60 voxels) associated with subjective motion perception. Activations are superimposed on the Colin atlas. Images are displayed according to neurological convention.
Table II.
MNI coordinates and the peak Z scores of the activation areas revealed by the regression analysis of CBF and BOLD data
| Cluster size | MNI coordinates | Peak Z | |||
|---|---|---|---|---|---|
| x | y | z | |||
| CBF activation areas | |||||
| L. Middle temporal | 253 | −42 | −64 | 2 | 4.69 |
| −42 | −54 | −10 | 3.71 | ||
| −50 | −52 | −4 | 3.55 | ||
| R. Middle temporal | 75 | 48 | −50 | 10 | 4.44 |
| 54 | −40 | 18 | 3.58 | ||
| L. Occipital | 83 | −24 | −92 | 26 | 3.87 |
| −12 | −100 | 18 | 3.73 | ||
| BOLD activation areas | |||||
| R. Middle temporal | 70 | 58 | −68 | −2 | 3.59 |
| 52 | −68 | 4 | 3.43 | ||
L., left hemisphere; R., right hemisphere; threshold as uncorrected P < 0.001 and cluster size larger than 60 voxels; CBF, cerebral blood flow.
Figure 5.
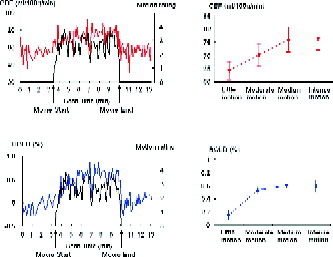
Results from the ROI analysis of the literature defined MT complex. Note both time courses of CBF (red curve) intensities and BOLD (blue curve) signal changes in MT correlated with the subjective rating of motion perception (black curve), and both CBF and BOLD signals increased from little motion perception to intense motion perception.
DISCUSSION
The visual system is presumably adapted to best encode real‐world environmental input. Everyday visual stimuli differ in many ways from the typical stimuli used in vision research laboratories, including but not limited to greater complexity of stimuli, more dynamic spatial‐temporal stimulation characteristics, longer time‐scale, less repetitious input, and greater visuomotor integration. Thus, it is not surprising that there is increasing interest in directly exploring the neural processing associated with natural vision and revisiting the rationale of predicting natural vision via artificial stimuli. While most natural vision studies have focused either on single neurons and populations of neurons [for a review, see Kayser et al.,2004], or on human behavioral performance [Li et al.,2002], several recent BOLD fMRI studies have begun to employ more dynamic and complex behavioral conditions during fMRI scanning on the level of systems neuroscience. For example, using the paradigm of freely viewing a movie, Zacks et al. [2001] revealed the brain regions tuned to perceptually silent event boundaries; Bartels et al. [2004a,b] indicated that the functional segregation and specialization of the visual cortex were maintained during the natural vision; and Hasson et al. [2004] revealed a striking intersubject synchronization during movie viewing. However, no study was able to directly measure the brain regions associated with freely viewing a movie. This may be attributed to the poor sensitivity of BOLD fMRI for tracking variations in neural activity evolved over a relatively long time epoch such as even a short movie [Aguirre et al.,2002; Hyde et al.,2001; Smith et al.,1999].
As an alternative imaging technique to BOLD fMRI, ASL perfusion fMRI offers the capability to directly study the neural correlates of sustained processing. Both theoretical calculation [Aguirre et al.,2002] and experimental data using simple sensorimotor stimulation [Wang et al.,2003a] have indicated that the relative sensitivity of perfusion fMRI is greater than that of BOLD fMRI when the task duration is longer than a few minutes. The present study extends the cognitive domain suitable for perfusion fMRI to natural visual tasks such as freely viewing a movie. The quantitative CBF values for small activation voxels and for the whole brain both fall well within the CBF values in existing studies using PET and ASL methods [e.g., Feng. et al.,2004; Lassen,1985; Parkes et al.,2004], supporting the reliability of ASL perfusion fMRI to quantify the absolute level of CBF in functionally specialized small cortical regions as well as the whole brain. The results from the group analysis of CBF data reveal that a widely distributed brain network was activated by freely watching a movie, including multiple occipital, temporal, parietal, frontal regions, and thalamus. The occipital‐temporal‐parietal regions covered the main ventral and dorsal visual pathways that are associated with the processing of different visual features (e.g., shape, color, and motion, etc). The parietal and frontal activations may be related to the attentional and emotional changes during movie viewing. The observed deactivations in the anterior cingulate/medial prefrontal and bilateral superior temporal/Herschel cortex overlapped the deactivated areas reported in previous studies [Binder et al.,1999; Greicius et al., 2001,2004; Shulman et al.,1997], supporting the view of a default‐mode functional brain network during the resting state [Gusnard and Raichle,2001]. In contrast to CBF data, concurrently acquired BOLD data revealed similar but weaker activations in the visual pathway and frontal areas, consistent with previous studies [Aguirre et al.,2002; Wang et al.,2003a], indicating the potentially higher across‐subject variability and lower sensitivity of BOLD contrast as compared to CBF contrast for measuring cortical activity evolved over long time periods. The significant correlation between the CBF signal changes and BOLD signal changes in the activation and deactivation voxels is consistent with the coupling of the two contrast mechanisms [Uludag et al.,2004]. However, greater BOLD activation was observed in the subcortical structure of thalamus that may be related to integrating and processing visual information, attention modulation, and changes in arousal levels [Coull,1998; Kastner et al.,2004]. By checking the individual subject data, we found that positive BOLD activation was consistent in thalamus for all subjects, while negative CBF activation was shown in thalamus for 2 of 11 individual subjects that may cause reduced CBF activation. The causes of intersubject variability for CBF activation in subcortical structures are unclear and may need further investigation.
In the regression analysis, the subjective ratings of motion demonstrated a stable and significant correlation between individual observers, suggesting that the feature of motion was perceived similarly by different viewers. Using the averaged subjective ratings as the feature regressor, both the CBF contrast and BOLD contrast revealed significant activations in the MT complex that were in good agreement with previous studies [Dupont et al.,2003; Eden et al.,1996; Smith et al.,1998; Sunaert et al.,1999; Tootell et al.,1995; Watson et al.,1993]. This result supports the view of maintained functional segregation and specialization during natural vision while multiple features have to be processed simultaneously [Bartels et al.,2004a, b]. That the CBF contrast provided higher statistical significance than BOLD contrast further supports the advantage of CBF contrast in measuring sustained neural activity. The tight coupling between CBF as measured by CASL perfusion fMRI and neural activity underlying visual perception was further confirmed with a‐priori, literature‐defined ROI analysis in which the dynamic subjective experience of motion was predicted by CBF time course in MT, the region that has long been recognized as a specific processing module for visual motion. While previous studies [e.g., Aguirre et al.,2002; Garraux et al.,2005; Mildner et al.,2003; Wang et al.,2003a] using perfusion fMRI almost exclusively relied on average CBF of a scan lasting a few minutes, the present study suggests that not only the mean CBF but also the dynamic changes of perfusion (in MT) can be traced at a temporal resolution of every 6 s with adequate statistical significance, which may lead to the opportunity to visualize both the sustained and dynamic effects of neural activation during natural vision.
In contrast to CBF data, the significance levels were generally lower for BOLD data in this study. This may be due to reduced sensitivity of BOLD fMRI compared to ASL fMRI for detecting slow variations in brain function over long time periods [Wang et al.,2003a] and the nonoptimized scan parameters or experimental design in the current study for BOLD fMRI. In general, the experimental design for imaging ecological and natural situations is difficult to optimize for BOLD fMRI. For instance, optimized BOLD fMRI (conventional block design) requires frequently switching between the control conditions and freely watching a movie (e.g., insert a 30‐s fixation after watching a movie for 1 min each time). However, this kind of experimental design could potentially disrupt the cognitive process under natural situations.
In summary, these results demonstrate the feasibility and reliability of using ASL perfusion fMRI for mapping both the sustained and dynamic effects of brain activity under ecological and natural situations, and support the notion of maintained functional segregation and specialization during natural vision. Further studies will be needed to improve the signal‐to‐noise ratio and spatiotemporal resolution of perfusion imaging, to characterize the neural activities underlying natural vision in greater detail, and to determine the optimal experimental designs for exploring the differences between the cortical processing of natural vision and of artificial stimuli.
Contributor Information
Hengyi Rao, Email: hengyi@mail.med.upenn.edu.
John A. Detre, Email: detre@mail.med.upenn.edu.
REFERENCES
- Aguirre GK, Detre JA, Zarahn E, Alsop DC ( 2002): Experimental design and the relative sensitivity of BOLD and perfusion fMRI. Neuroimage 15: 488–500. [DOI] [PubMed] [Google Scholar]
- Bartels A, Zeki S ( 2004a): Functional brain mapping during free viewing of natural scenes. Hum Brain Mapp. 21: 75–85. [DOI] [PMC free article] [PubMed] [Google Scholar]
- Bartels A, Zeki S ( 2004b): The chronoarchitecture of the human brain—natural viewing conditions reveal a time‐based anatomy of the brain. Neuroimage 22: 419–433. [DOI] [PubMed] [Google Scholar]
- Binder JR, Frost JA, Hammeke TA, Bellgowan PS, Rao SM, Cox RW ( 1999): Conceptual processing during the conscious resting state. A functional MRI study. J Cogn Neurosci 11: 80–95. [DOI] [PubMed] [Google Scholar]
- Brett M, Anton JL, Valabregue R, Poline JB ( 2002): Region of interest analysis using an SPM toolbox [Abstract]. Neuroimage 16: 497A. [Google Scholar]
- Bullmore E, Brammer M, Williams SC, Rabe‐Hesketh S, Janot N, David A, Mellers J, Howard R, Sham P. ( 1996). Statistical methods of estimation and inference for functional MR image analysis. Magn Reson Med 35: 261–277. [DOI] [PubMed] [Google Scholar]
- Buxton RB, Frank LR ( 1997): A model for the coupling between cerebral blood flow and oxygen metabolism during neural stimulation. J Cereb Blood Flow Metab 17: 64–72. [DOI] [PubMed] [Google Scholar]
- Coull JT ( 1998): Neural correlates of attention and arousal: insights from electrophysiology, functional neuroimaging and psychopharmacology. Prog Neurobiol 55: 343–361. [DOI] [PubMed] [Google Scholar]
- Detre JA, Leigh JS, Williams DS, Koretsky AP ( 1992): Perfusion imaging. Magn Reson Med 23: 37–45. [DOI] [PubMed] [Google Scholar]
- Duong TQ, Kim DS, Ugurbil K, Kim SG ( 2001): Localized cerebral blood flow response at submillimeter columnar resolution. Proc Natl Acad Sci U S A 98: 10904–10909. [DOI] [PMC free article] [PubMed] [Google Scholar]
- Dupont P, Sary G, Peuskens H, Orban GA ( 2003): Cerebral regions processing first‐ and higher‐order motion in an opposed‐direction discrimination task. Eur J Neurosci 17: 1509–1517. [DOI] [PubMed] [Google Scholar]
- Eden GF, VanMeter JW, Rumsey JM, Maisog JM, Woods RP, Zeffiro TA ( 1996): Abnormal processing of visual motion in dyslexia revealed by functional brain imaging. Nature 382: 66–69. [DOI] [PubMed] [Google Scholar]
- Feng CM, Narayana S, Lancaster JL, Jerabek PA, Arnow TL, Zhu F, Tan LH, Fox PT, Gao JH ( 2004): CBF changes during brain activation: fMRI vs. PET. Neuroimage 22: 443–446. [DOI] [PubMed] [Google Scholar]
- Friston KJ, Josephs O, Zarahn E, Holmes AP, Rouquette S, Poline J ( 2000) To smooth or not to smooth? Bias and efficiency in fMRI time‐series analysis. Neuroimage 12: 196–208. [DOI] [PubMed] [Google Scholar]
- Garraux G, Hallett M, Talagala SL ( 2005): CASL fMRI of subcortico‐cortical perfusion changes during memory‐guided finger sequences. Neuroimage 25: 122–132. [DOI] [PubMed] [Google Scholar]
- Genovese CR, Lazar NA, Nichols T ( 2002): Thresholding of statistical maps in functional neuroimaging using the false discovery rate. Neuroimage 15: 870–878. [DOI] [PubMed] [Google Scholar]
- Greicius MD, Menon V ( 2004): Default‐mode activity during a passive sensory task: uncoupled from deactivation but impacting activation. J Cogn Neurosci 16: 1484–1492. [DOI] [PubMed] [Google Scholar]
- Gusnard DA, Raichle ME ( 2001): Searching for a baseline: functional imaging and the resting human brain. Nat Rev Neurosci 2: 685–694. [DOI] [PubMed] [Google Scholar]
- Hasson U, Nir Y, Levy I, Fuhrmann G, Malach R ( 2004): Intersubject synchronization of cortical activity during natural vision. Science 303: 1634–1640. [DOI] [PubMed] [Google Scholar]
- Hyde JS, Biswal BB, Jesmanowicz A ( 2001): High‐resolution fMRI using multislice partial k‐space GR‐EPI with cubic voxels. Magn Reson Med 46: 114–125. [DOI] [PubMed] [Google Scholar]
- Kastner S, Pinsk MA ( 2004): Visual attention as a multilevel selection process. Cogn Affect Behav Neurosci 4: 483–500. [DOI] [PubMed] [Google Scholar]
- Kayser C, Kording KP, Konig P ( 2004): Processing of complex stimuli and natural scenes in the visual cortex. Curr Opin Neurobiol 14: 468–473. [DOI] [PubMed] [Google Scholar]
- Kim J, Whyte J, Wang J, Rao H, Tang K, Detre JA ( 2006): Continuous ASL perfusion fMRI investigation of higher cognition: quantification of tonic CBF changes during sustained attention and working memory tasks. Neuroimage 31: 376–385. [DOI] [PMC free article] [PubMed] [Google Scholar]
- Lassen NA ( 1985): Normal average value of cerebral blood flow in younger adults is 50 ml/100 g/min. J Cereb Blood Flow Metab 5: 347–349. [DOI] [PubMed] [Google Scholar]
- Li FF, VanRullen R, Koch C, Perona P ( 2002): Rapid natural scene categorization in the near absence of attention. Proc Natl Acad Sci U S A 99: 9596–9601. [DOI] [PMC free article] [PubMed] [Google Scholar]
- Mildner T, Trampel R, Moller HE, Schafer A, Wiggins CJ, Norris DG ( 2003): Functional perfusion imaging using continuous arterial spin labeling with separate labeling and imaging coils at 3 T. Magn Reson Med 49: 791–795. [DOI] [PubMed] [Google Scholar]
- Olson IR, Rao H, Sledge MK, Wang J, Detre JA ( 2006): Using perfusion fMRI to measure continuous changes in neural activity with learning. Brain Cogn 60: 262–271. [DOI] [PubMed] [Google Scholar]
- Parkes LM, Rashid W, Chard DT, Tofts PS ( 2004): Normal cerebral perfusion measurements using arterial spin labeling: reproducibility, stability, and age and gender effects. Magn Reson Med 51: 736–743. [DOI] [PubMed] [Google Scholar]
- Riesenhuber M, Poggio T ( 1999): Hierarchical models of object recognition in cortex. Nat Neurosci 2: 1019–1025. [DOI] [PubMed] [Google Scholar]
- Shulman GL, Corbetta M, Buckner RL, Fiez JA, Miezin FM, Raichle ME ( 1997): Common blood flow changes across visual tasks. I. Increases in subcortical structures and cerebellum but not in nonvisual cortex. J Cogn Neurosci 9: 624–647. [DOI] [PubMed] [Google Scholar]
- Smith AT, Greenlee MW, Singh KD, Kraemer FM, Hennig J ( 1998): The processing of first‐ and second‐order motion in human visual cortex assessed by functional magnetic resonance imaging (fMRI). J Neurosci 18: 3816–3830. [DOI] [PMC free article] [PubMed] [Google Scholar]
- Smith AM, Lewis BK, Ruttimann UE, Ye FQ, Sinnwell TM, Yang Y, Duyn JH, Frank JA ( 1999): Investigation of low frequency drift in fMRI signal. Neuroimage 9: 526–533. [DOI] [PubMed] [Google Scholar]
- Sunaert S, Van Hecke P, Marchal G, Orban GA ( 1999): Motion‐responsive regions of the human brain. Exp Brain Res 127: 355–370. [DOI] [PubMed] [Google Scholar]
- Talagala SL, Noll DC ( 1998): Functional MRI using steady‐state arterial water labeling. Magn Reson Med 39: 179–183. [DOI] [PubMed] [Google Scholar]
- Tootell RBH, Reppas JB, Kwong KK, Malach R, Born RT, Brady TJ, Rosen BR, Belliveau JW ( 1995): Functional analysis of human MT and related visual cortical areas using magnetic resonance imaging. J Neurosci 15: 3215–3230. [DOI] [PMC free article] [PubMed] [Google Scholar]
- Uludag K, Dubowitz DJ, Yoder EJ, Restom K, Liu TT, Buxton RB ( 2004): Coupling of cerebral blood flow and oxygen consumption during physiological activation and deactivation measured with fMRI. Neuroimage 23: 148–155. [DOI] [PubMed] [Google Scholar]
- Vinje WE, Gallant JL ( 2000): Sparse coding and decorrelation in primary visual cortex during natural vision. Science 287: 1273–1276. [DOI] [PubMed] [Google Scholar]
- Wang J, Aguirre GK, Kimberg DY, Roc AC, Li L, Detre JA ( 2003a): Arterial spin labeling perfusion fMRI with very low task frequency. Magn Reson Med 49: 796–802. [DOI] [PubMed] [Google Scholar]
- Wang J, Aguirre GK, Kimberg DY, Detre JA ( 2003b): Empirical analyses of null‐hypothesis perfusion FMRI data at 1.5 and 4T. Neuroimage 19: 1449–1462. [DOI] [PubMed] [Google Scholar]
- Wang J, Zhang Y, Wolf RL, Roc AC, Alsop DC, Detre JA ( 2005a): Amplitude modulated continuous arterial spin labeling perfusion MR with single coil at 3T‐feasibility. Radiology 235: 218–228. [DOI] [PubMed] [Google Scholar]
- Wang J, Rao H, Wetmore GS, Furlan PM, Korczykowski M, Dinges DF, Detre JA ( 2005b): The stressed brain: perfusion fMRI reveals cerebral blood flow pattern under psychological stress. Proc Natl Acad Sci U S A 102: 17804–17809. [DOI] [PMC free article] [PubMed] [Google Scholar]
- Watson JDG, Myers R, Frackowiak RSJ, Hajnal JV, Woods RP, Mazziota JC, Shipp S, Zeki S ( 1993): Area V5 of the human brain: evidence from a combined study using positron emission tomography and magnetic resonance imaging. Cereb Cortex 3: 79–94. [DOI] [PubMed] [Google Scholar]
- Williams DS, Detre JA, Leigh JS, Koretsky AP ( 1992): Magnetic resonance imaging of perfusion using spin inversion of arterial water. Proc Natl Acad Sci U S A 89: 212–216. [DOI] [PMC free article] [PubMed] [Google Scholar]
- Wong EC ( 1999): Potential and pitfalls of arterial spin labeling based perfusion imaging techniques for MRI In: Moonen CTW, Bandettini PA, editors. Functional MRI. Heidelberg: Springer; p 63–69. [Google Scholar]
- Wong EC, Buxton RB, Frank LR ( 1997): Implementation of quantitative perfusion imaging techniques for functional brain mapping using pulsed arterial spin labeling. NMR Biomed 10: 237–249. [DOI] [PubMed] [Google Scholar]
- Yang Y, Engelien W, Pan H, Xu S, Silbersweig DA, Stern E ( 2000): A CBF‐based event‐related brain activation paradigm: characterization of impulse‐response function and comparison to BOLD. Neuroimage 12: 287–297. [DOI] [PubMed] [Google Scholar]
- Ye FQ, Smith AM, Mattay VS, Ruttimann UE, Frank JA, Weinberger DR ( 1998): Quantitation of regional cerebral blood flow increases in prefrontal cortex during a working memory task: a steady‐state arterial spin‐tagging study. Neuroimage 8: 44–49. [DOI] [PubMed] [Google Scholar]
- Yee SH, Liu HL, Hou J, Pu Y, Fox PT, Gao JH ( 2000): Detection of the brain response during a cognitive task using perfusion‐based event‐related functional MRI. Neuroreport 11: 2533–2536. [DOI] [PubMed] [Google Scholar]
- Zacks JM, Braver TS, Sheridan MA, Donaldson DI, Snyder AZ, Ollinger JM, Buckner RL, Raichle ME ( 2001): Human brain activity time‐locked to perceptual event boundaries. Nat Neurosci 4: 651–655. [DOI] [PubMed] [Google Scholar]