

Abstract
Fractal dimension (FD) has been widely used to provide a quantitative description of structural complexity in the cerebral cortex. FD is an extremely compact measure of shape complexity, condensing all details into a single numeric value. We interpreted the variation of the FD in the cortical surface of normal controls through multiple regression analysis with cortical thickness, sulcal depth, and folding area related to cortical complexity. We used a cortical surface showing a reliable representation of folded gyri and manually parcellated it into frontal, parietal, temporal, and occipital regions for regional analysis. In both hemispheres the mean cortical thickness and folding area showed significant combination effects on cortical complexity and accounted for about 50% of its variance. The folding area was significant in accounting for the FD of the cortical surface, with positive coefficients in both hemispheres and several lobe regions, while sulcal depth was significant only in the left temporal region. The results may suggest that human cortex develops a complex structure through the thinning of cortical thickness and by increasing the frequency of folds and the convolution of gyral shape rather than by deepening sulcal regions. Through correlation analysis of FD with IQ and the number of years of education, the results showed that a complex shape of the cortical surface has a significant relationship with intelligence and education. Our findings may indicate the structural characteristics that are revealed in the cerebral cortex when the FD in human brain is increased, and provide important information about brain development. Hum Brain Mapp, 2006. © 2006 Wiley‐Liss, Inc.
Keywords: fractal dimension, cortical thickness, sulcal depth, folding area, multiple regression
INTRODUCTION
The notion of fractal dimension (FD) has been widely used to describe the geometrical properties of complex objects in biology and medicine [Editorial,1991; Havlin et al.,1995]. It has been recognized that the human cerebral cortex is a fractal structure [Free et al.,1996; Kiselev et al.,2003], and the estimation of FD provides a quantitative description of the structural complexity in the cerebral cortex, which is difficult to assess by standard morphometric tools. Fractal analysis in brain structure has been largely used to study the abnormalities of cortical structure and pattern in patients with mental disorders. Abnormal fractal dimensions were found in patients with epilepsy [Cook et al.,1995; Free et al.,1996], schizophrenia [Ha et al.,2005; Narr et al.,2001,2004] and obsessive‐compulsive disorder [Ha et al.,2005]. Cortical complexity patterns in normal children were examined using FD and a significant change in cortical complexity with age was reported [Blanton et al.,2001]. Three‐dimensional fractal analysis of hemispheric asymmetry and gender differences of cortical complexity in normal controls were investigated, showing significant rightward asymmetry and greater gyrification in women [Lee et al.,2004; Luders et al.,2004].
In these prior studies, FD computed on the cortical surface was regarded as the estimation of the degree of cortical folding and the number of primary, secondary, and tertiary sulcal bifurcations and branchings. However, FD is an extremely compact measure of shape complexity, condensing all the details into a single numeric value that summarizes the irregularity of an object. It has not been analyzed which geometrical properties of the cerebral cortex have relationships with FD and affect it in cortex structure. Therefore, variability and difference of the FD in the cortical surface could not be interpreted concretely.
The purpose of this study was to account for the variation of the FD in the cortical surfaces of normal controls through the analysis of cortical thickness, sulcal depth, and folding area, which can be related to cortical complexity. We investigated which structural properties of the cortical surface affect its FD value. We improved the analysis with reliable measurements using a 3‐D cortical surface model. In addition, we analyzed relationships between the FD of the cortical surface and the intelligence quotient (IQ) and the number of years of education. This study could make it possible to understand the meaning of FD, which has been largely used to describe the complexity of cortical structure.
PATIENTS AND METHODS
FD is affected by several factors within the cerebral cortex and is considered an estimation of the degree of cortical folding. The degree of cortical folding could be a combination of sulcal depth, the frequency of folding, and convolution of gyral shape. We experimented with artificial data and showed that the increase of FD can result from these (Fig. 1). In addition, complex and folding cortical structure causes shearing that tends to stretch the radial axis along layers of cerebral cortex [Van Essen,1997]; hence, cortical complexity may have a relationship with cortical thickness. We measured cortical thickness, sulcal depth, and folding area and performed statistical analysis with the FD of the cortical surface.
Figure 1.
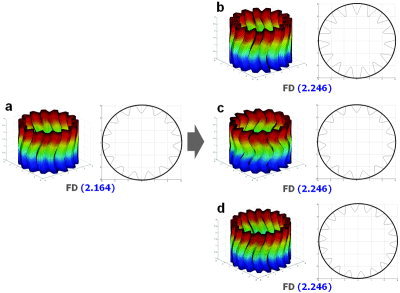
Estimation of FD using artificial data. The original model is folded in confined space like a brain (FD = 2.164) (a). The model with deeper folds than the original model, but representing the same frequency of folds and convolution, shows an increased FD (FD = 2.246) (b). The model of a more convoluted shape (c) and more frequency of folds (d) with the same depth compared to the original model also shows an increased FD, which is the same value of the deeper folding model (FD = 2.246). In the human brain, the depth, frequency, and convolution of gyral shape could affect the FD of the cortical surface integratedly.
Subjects
Forty‐four normal Korean subjects were recruited from the community via newspaper advertisements with demographic data including age (24 men and 20 women; mean age ± standard deviation (SD): 26.4 ± 5.5 years), handedness, number of years of education, IQ, personal socioeconomic status, and parental socioeconomic status. All of them had been screened by the Structured Clinical Interview for DSM‐IV (SCID‐I) [Spitzer et al.,1992] to rule out any neurologic and psychiatric disorders. Annett's hand‐preference questionnaire was used to evaluate the handedness of volunteers to exclude left‐handed subjects [Annett,1970]. The number of years of education was in the range of 12–21 years, average 15.7 years. IQ was assessed with a short form of the Korean version of Wechsler Adult Intelligence Scale‐Revised [Wechsler,1981]. The average IQ of these subjects was 116.27, with a range of 89–134. After the subjects had been completely apprised with regard to the protocols of the study, we obtained written informed consent from all subjects. This study was conducted in accordance with the guidelines provided by the institutional review board at Seoul National University Hospital.
Image Preprocessing and Cortical Surface Extraction
3‐D T1‐weighted spoiled‐gradient echo magnetic resonance (MR) images were acquired using a 1.5 T SIGNA Scanner (GE Medical Systems, Milwaukee, WI). Imaging parameters were: 1.5 mm sagittal slices, echo time 5.5 ms, repetition time 14.4 ms, number of excitations 1, rotation angle 20°, field of view 21 × 21 cm, and matrix size 256 × 256 (voxel size 0.82 × 0.82 × 1.5 mm).
Intensity nonuniformity in the raw MR images resulting from magnetic field inhomogeneity was corrected using the N3 algorithm [Sled et al.,1998], so that the corrected volumes could be properly classified into gray matter (GM), white matter (WM), and cerebrospinal fluid (CSF). Spatial normalization to a stereotaxic space was performed using a nine‐parameter linear registration [Collins et al.,1994]. Each subject's brain was classified into WM, GM, CSF, and background using a 3‐D stereotaxic brain mask and the Intensity‐Normalized Stereotaxic Environment for Classification of Tissues (INSECT) algorithm [Zijdenbos et al.,1996,1998] (Fig. 2). Cortical surfaces were automatically extracted from each MR volume using the Constrained Laplacian‐based Automated Segmentation with Proximities (CLASP) algorithm [Kim et al.,2005], which is an improvement of the conventional Automated Segmentation with Proximities (ASP) algorithm [MacDonald et al.,2000]. CLASP reconstructs the inner cortical surface by deforming a spherical mesh onto the GM/WM interface. Then the outer cortical surface is expanded from the inner surface to the boundary between GM and CSF along a Laplacian map, which smoothly increases potential surfaces between WM and CSF until the GM/CSF boundary is found. A CSF fraction image is acquired by the partial volume segmentation using a statistical model of the partial volume effect [Kim et al.,2005]. The partial volume CSF calculated is binarized and skeletonized to determine the boundary of the outer cortex in buried sulci. The skeleton is created using a two‐subfield connectivity‐preserving medial surface skeletonization algorithm [Ma and Wan,2001]. We constructed hemispheric cortical surface models, each of which consisted of 81,920 polygons forming high‐resolution meshes of discrete triangular elements.
Figure 2.
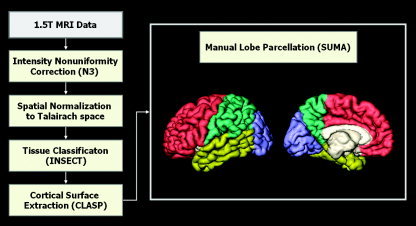
Procedure for image preprocessing, cortical surface extraction, and manual lobe parcellation.
Lobe Parcellation of Cortical Surface
The cortical surface was manually parcellated into frontal, parietal, temporal, and occipital regions in each subject for regional analysis using SUMA (http://afni.nimh.nih.gov) [Cox and Hyde,1997] (Fig. 2). The definition of the boundary between lobes in the manual parcellation has been described in the literature [Caviness et al.,1996; Crespo‐Facorro et al.,1999; Kim et al.,2000; Rademacher et al.,1992]. For frontal lobe, there are major landmarks to define boundaries [Crespo‐Facorro et al.,1999]. On the medial wall: 1) above the body of the corpus callosum (CC), an imaginary vertical line dropped from the point where the central sulcus intersects with the midsagittal plane [Rademacher et al.,1992]; 2) below the genu of the CC, an imaginary vertical line passing through the most anterior tip of the inner surface of the genu of the CC. On the lateral surface, the posterior boundary is the central sulcus (or Rolando's fissure). The lateral, medial, anterior, superior, and inferior boundaries of the frontal lobe are defined by its natural limits. The callosal sulcus constitutes the inferior boundary of the frontal lobe on the medial wall of the hemisphere. For temporal lobe, six major temporal sulci—Heschl's sulcus, first transverse sulcus, superior temporal sulcus, inferior temporal sulcus, occipitotemporal sulcus, and collateral sulcus—and seven artificial coronal slices were used to define medial/superior or lateral/inferior borders of temporal subregions [Kim et al.,2000]. These subregions were merged to define the whole temporal lobe. The remaining region that had not been defined by the frontal or temporal lobe was parcellated to occipital and parietal lobe. Major landmarks were used to separate occipital and parietal lobe [Caviness et al.,1996]: 1) plane including the intraparietal sulcus/transverse occipital fissure; 2) plane including the anterior limit of calcarine sulcus; 3) cuneal sulcus/parieto‐occipital sulcus; and 4) cuneal point (calcarine sulcus/parieto‐occipital sulcus).
A reliability study of parceling the lobe regions was performed by two raters with five cortical surfaces that were randomly selected from the dataset. Surface area (cm2) and similarity index (SI) in each parcellated lobar region were measured for it. The SI is an indicator of geometric and anatomic similarities or differences between two regions. Interrater reliability for all regions was measured with SI. The SI was defined as the ratio of twice the common area to the sum of the individual area (SI ∈ [0,1]) [Koo et al.,2005; Zijdenbos et al.,1994]:
| (1) |
In this expression, A and B are the regions manually parcellated by the two raters and A ∩ B is the overlapping region between A and B. a(A) is the area of region A. The SI is sensitive to both differences in size and location. When two raters trace regions similarly, the SI will be a high value, close to 1.
Fractal Dimension
We calculated the FD of the 3‐D cortical surface, which represented the cortical complexity, using the box‐counting method. We felt that this widely used method was more appropriate for measuring the FD than more complicated and possibly more robust methods in terms of allowing for comparison with previous analyses [Bullmore et al.,1994; Cook et al.,1995; Lee et al.,2004; Liu et al.,2003]. In the box‐counting method, the shape of interest is initially mapped onto a rectangular grid or lattice, the edges of each box in the grid being of equal length, r, and the number of grid boxes occupied by one or more vertices of cortical surface, N(r) is counted. This box‐counting step is repeated several times: the same image is mapped onto a series of rectangular grids of increasing box size, and the number of occupied boxes in each grid is counted. In practice, we estimated the FD for finite datasets using FD3 originally developed by Sarraille and DiFalco [Liebovitch and Toth,1989; Sarraille and Myers,1994]. The value of the FD was then derived from the following relationship: N(r) ∝ (1/r)FD. Specifically, the FD was estimated by ascertaining the gradient of a straight line fitted by least squares to the scatterplot of logN(r) against log(1/r) (Fig. 3).
Figure 3.
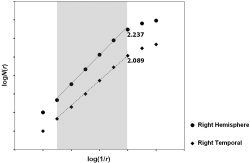
Scatterplot of logN(r) vs. log(1/r) for cortical surfaces of right hemisphere and temporal lobe of one subject. This figure shows data with artificial shifts in the vertical direction for visual assessment. Each numerical value in the graph indicates estimated fractal dimension that is the slope of the fitted line in the gray colored range showing linearity. Solid line is fitted for right hemisphere and dashed line for right temporal lobe. Solid line shows higher slope than dashed line, indicating higher FD value. Note that r is the length of box size in the grid and N(r) is the number of grid boxes occupied by one or more vertices of cortical surface.
Cortical Thickness
Inner and outer surfaces had the same number of vertices, and the correspondences of each vertex between surfaces were defined. The cortical thickness was measured by calculating the Euclidean distance between linked vertices on the inner and outer cortical surfaces [Kabani et al.,2001; Lerch and Evans,2005]. Cortical thickness used for this analysis was an averaged value of the thickness of the whole vertex in each hemisphere and lobar region.
Sulcal Depth
Sulcus extraction and automatic recognition were performed [Cointepas et al.,2001; Riviere et al.,2002] and sulcal maximal depth and sulcal length were extracted with BrainVisa (http://brainvisa.info) [Ochiai et al.,2004]. The gray/CSF object segmented from the volume image was skeletonized using a homotopic erosion that preserves the initial topology. Skeleton points connected to the outside were gathered to represent the hemisphere hull, which means the outside envelope of whole brain. The remaining part of the skeleton was then segmented into topologically simple surfaces, which represent sulcal regions. Sulcal depth is the maximal geodesic depth of the sulcal surface and sulcal length is the border length of junctions between the sulcus and brain hull. To investigate whether the sulcal depth has an effect on the FD of cerebral cortex, we chose major sulci in each hemisphere robustly extracted by BrainVisa. On the lateral brain surface, these included Sylvian fissure, central sulcus, precentral sulcus, superior frontal sulcus, intermediate frontal sulcus, inferior frontal sulcus, postcentral sulcus, intraparietal sulcus, superior temporal sulcus, and inferior temporal sulcus. On the medial brain surface, these included cingulate sulcus, calcarine sulcus, and parieto‐occipital sulcus. On the inferior brain surface, these included the collateral sulcus. To represent the depth in each hemisphere and lobe region, sulcal depths need to be averaged regionally. The depth of each sulcus extracted by BrainVisa is the maximal depth and the average of maximal sulcal depths is too oversimplified to indicate the regional sulcal depth. Since longer and larger sulci could have a greater effect on cortical complexity, we proposed the use of the weighted average depth with the sulcal length, which heightened the effect of depth in larger sulci. The weighted average sulcal depth, D A, is defined as:
 |
(2) |
where D i and L i are the depth and length of each sulcus and N is the number of sulci chosen for depth measurement. The length‐weighted average sulcal depth was measured for the hemispheres and lobar regions regionally and used for the analysis.
Folding Area
We utilized folding area, which calculates the area of the folded regions normalized by whole surface area in the outer cortical surface model. The purpose was to detect how large an area the folding regions occupy in the entire surface area. Through the normalization with whole surface area, it is appropriate for the analysis in regions of different area, focusing on cortex shape. The surface area was the straightforward sum of the areas of the triangles making up the surface model. The folding regions were defined using mean curvature in the 3‐D triangular surface model [Cachia et al.,2003]. Folding area detects regions of small secondary and tertiary folds in a surface as well as the primary folds and reflects the frequency of cortical folding and convolution of gyral shape. Mean curvature is susceptible to noise features and geometrical small changes of shape. We smoothed the cortical surface model geometrically to reduce the artifacts of surface models, but preserved the native folding patterns of the cortical surface (Fig. 4). The smoothing algorithm changed the 3‐D position of each vertex p i toward the barycenter of its first neighbors, which were connected to it directly [Toro and Burnod,2003]. At the smoothing step t+1, the vertex p i is defined as a function of its N i neighbor vertices V j(p i) as:
| (3) |
Folding area was estimated by calculating the area of the triangles making up folding regions, which consisted of vertices whose mean curvature was negative in the smoothed model. Since the smoothing procedure changed the surface model geometrically, we smoothed the surface only to extract the folded regions and measured the folding area in the cortical surface originally extracted from the CLASP algorithm. Figure 4 shows brains exhibiting high and low folding area in the left hemispheres. Folding area was calculated regionally for the hemispheres and lobar regions.
Figure 4.
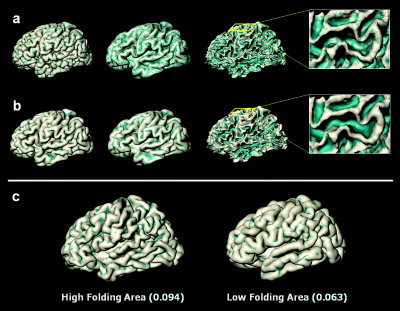
Folding area measured from outer cortical surface (a) and smoothed surface (b). Folding area represents the area of folded regions in cortical surface, which consist of vertices whose mean curvature is negative. Folding area index represents the ratio of the folding area to the whole surface area. The bluish‐green color in the surface model represents the regions with a negative mean curvature, included to the measurement of folding area. The surfaces in the first column are outer cortical surface and the smoothed surface. The surfaces in the second column are inflated surfaces for visualization of mean curvature. The surfaces in the third column are inner cortical surfaces for observing folding patterns. Mean curvature in the 3‐D triangular model is sensitive to local geometrical small changes of the outer cortical surface (a). The cortical surface was smoothed geometrically to represent the folding patterns of the cortical surface with a mean curvature (b). Examples of brains exhibit high and low folding area in the left hemispheres. Folding area indices are shown below each cortical surface model (c). [Color figure can be viewed in the online issue, which is available at www.interscience.wiley.com.]
Statistical Analysis
Multiple linear regression was performed to account for the variance of the dependent variable, FD, and to find out which variables influence FD in each hemisphere and lobe region. The set of independent variables was mean cortical thickness, length‐weighted average sulcal depth, and folding area. The stepwise selection method was used to select variables that were most useful in predicting FD. We examined the relationships of the FD in the cortical surface with IQ and the number of years of education using Pearson's correlation coefficients. All inferences of the statistical tests in this study were based on a two‐tailed 95% confidence interval.
RESULTS
The average surface area (cm2) and the average SI in each parcellated lobar region of five cortical surfaces were measured and are shown in Table I. In our reliability measure, the differences of regional area between the two tracers were small and the SI values in all lobar regions were more than 0.9. This means that manual lobe parcellation in this study is reliable.
Table I.
Parcellated regional surface area (cm2) for each tracer and similarity index (SI) between the two tracers with randomly selected five subjects
| Lobar region | Left | Right | ||||
|---|---|---|---|---|---|---|
| Tracer 1 | Tracer 2 | SI | Tracer 1 | Tracer 2 | SI | |
| Frontal | 419.41 (23.42) | 420.91 (19.55) | 0.99 (0. 0035) | 422.69 (23.77) | 421.62 (23.79) | 0.99 (0. 0027) |
| Temporal | 273.69 (11.38) | 284.71 (10.99) | 0.96 (0. 0122) | 262.31 (15.86) | 271.65 (20.67) | 0.96 (0. 0102) |
| Parietal | 280.07 (16.57) | 290.74 (27.74) | 0.95 (0. 0169) | 301.93 (17.90) | 317.80 (22.82) | 0.95 (0. 0116) |
| Occipital | 168.39 (14.88) | 155.27 (19.50) | 0.92 (0. 0294) | 154.29 (17.21) | 140.83 (22.96) | 0.94 (0. 0316) |
Values are mean (SD).
SD, standard deviation.
In both hemisphere models the mean cortical thickness, which was best correlated with the FD, entered the equation in the first step and the folding area entered in the second step. The standardized β coefficients for the mean cortical thickness were the negative (left: –0.435 and right: –0.513). Folding areas in the left lobe regions were mostly included in the equation, except for occipital lobe. The length‐weighted average sulcal depth entered the equation in the second step in the left temporal lobe. In the right parietal region, folding area was selected as a significant predictor variable. The standardized β coefficients for folding area and length‐weighted average sulcal depth were positive in regression equations (Table II). Scatterplots of the dependent variable (FD) against each of the independent variables (cortical thickness, length‐weighted average sulcal depth, and folding area) were generated with the significant results (Fig. 5). The scatterplots with fitting line revealed those distributions and their variances and the correlation patterns. The FD in the cortical surface showed significant positive correlations with the number of years of education in both hemispheres. FD and IQ had significant positive correlation in the right hemisphere. No significant correlation effects were seen in the lobar regions (Table III). We provide scatterplots of IQ, the number of years of education, and FD for both hemispheric cortical surfaces (Fig. 6).
Table II.
Statistical results of a stepwise multiple regression analysis in each hemisphere and lobe region
| Coefficients | Significance test of R2 | |||||||
|---|---|---|---|---|---|---|---|---|
| Unstandardized B coefficients | Standardized β coefficients | t | Significance | R2 | Adjusted R2 | F | Significance | |
| Left | ||||||||
| Hemisphere | 0.485 | 0.459 | 19.27 | < 0. 0001 | ||||
| Thickness | −0.040 | −0.435 | −3.601 | 0.001 | ||||
| Folding area | 0.923 | 0.404 | 3.342 | 0.002 | ||||
| Frontal | ||||||||
| Folding area | 1.848 | 0.357 | 2.476 | 0.017 | 0.127 | 0.107 | 6.128 | 0.017 |
| Temporal | 0.304 | 0.270 | 8.959 | 0.001 | ||||
| Folding area | 0.496 | 0.378 | 2.816 | 0.007 | ||||
| Depth | 0.003 | 0.321 | 2.390 | 0.022 | ||||
| Parietal | ||||||||
| Folding area | 1.842 | 0.424 | 3.030 | 0.004 | 0.179 | 0.160 | 9.183 | 0.004 |
| Occipital | — | — | — | — | — | — | — | — |
| Right | ||||||||
| Hemisphere | 0.523 | 0.500 | 22.472 | < 0. 0001 | ||||
| Thickness | −0.037 | −0.513 | −4.552 | <0. 0001 | ||||
| Folding area | 0.767 | 0.382 | 3.386 | 0.002 | ||||
| Frontal | — | — | — | — | — | — | — | — |
| Temporal | — | — | — | — | — | — | — | — |
| Parietal | ||||||||
| Folding area | 3.028 | 0.578 | 4.595 | <0. 0001 | 0.335 | 0.319 | 21.116 | < 0. 0001 |
| Occipital | — | — | — | — | — | — | — | — |
Dependent variable: fractal dimension.
Figure 5.
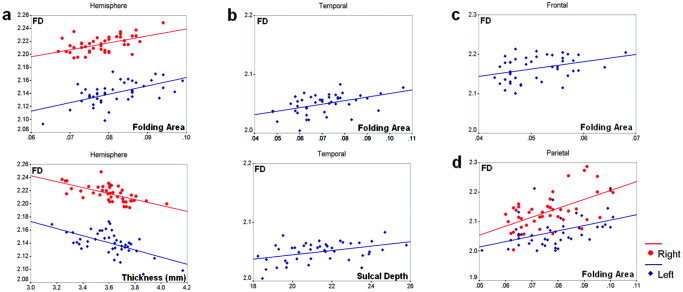
Scatterplots of the FD against each of the independent variables (cortical thickness, length‐weighted average sulcal depth, and folding area) for the significant results (y: FD, x1: cortical thickness, x2: length‐weighted average sulcal depth, x3: folding area). Cortical thickness and folding area are significant variables for the regression model and shows a strong relationship with FD in both hemispheres (Left: y = –0.04 x1 +0.923 x3 +2.210, Right: y = –0.037 x1 +0.767 x3 +2.290) (a). In the left temporal lobe, folding area and length weighted average sulcal depth are selected as significant variables with positive correlation (Left: y = 0.003 x2 +0.496 x3 +1.954) (b). Folding area is also included in the regression model showing positive correlation in the left frontal lobe (Left: y = 1.848 x3 +2.070) (c) and left/right parietal lobe (Left: y = 1.824 x3 +1.922, Right: y = 3.028 x3 +1.902) (d). Red marker and fitting line are for right hemisphere and blue for left (y: FD, x1: cortical thickness, x2: length‐weighted average sulcal depth, x3: folding area). [Color figure can be viewed in the online issue, which is available at www.interscience.wiley.com.]
Table III.
Correlation effects of the FD in the cortical surface with IQ and the number of years of education
| IQ | Education | |
|---|---|---|
| FDLEFT | ||
| Hemisphere | 0.212 (0.166) | 0.452** (0.002) |
| Frontal | 0.080 (0.604) | −0.035 (0.822) |
| Temporal | 0.163 (0.289) | 0.068 (0.662) |
| Parietal | 0.040 (0.795) | −0.084 (0.590) |
| Occipital | 0.237 (0.122) | 0.114 (0.462) |
| FDRIGHT | ||
| Hemisphere | 0.306* (0.043) | 0.347* (0.021) |
| Frontal | 0.027 (0.861) | 0.095 (0.541) |
| Temporal | −0.099 (0.522) | 0.043 (0.783) |
| Parietal | 0.087 (0.575) | 0.129 (0.406) |
| Occipital | 0.215 (0.161) | 0.146 (0.346) |
Note that the values are Pearson's correlation coefficients and P values.
P < 0.05 (2‐tailed).
P < 0.01 (2‐tailed).
FD: fractal dimension.
Figure 6.
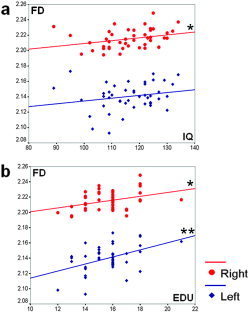
Scatterplot of FD vs. IQ (a) and the number of years of education (b) for both hemispheric cortical surfaces. The graphs show the positive correlation of FD with IQ in the right hemisphere and the number of years of education in the left and right hemispheres. The correlation with the FD and IQ in the left hemisphere is positive but not statistically significant. Red marker and fitting line are for right hemisphere and blue for left. (*P < 0.05, **P < 0.01, EDU: number of years of education). [Color figure can be viewed in the online issue, which is available at www.interscience.wiley.com.]
DISCUSSION
We performed stepwise multiple regression analysis to relate the FD of the cortical surface with cortical thickness, sulcal depth, and folding area. Cortical complexity measured by FD has been considered an estimation of gyrification and could be a combination of sulcal depth, the frequency of folding, and the convolution of gyral shape. Folding area can reflect small folds as well as primary folds and can also detect the winding regions of the sulcal wall in 3‐D space. We used the folding area to measure the frequency of cortical folding and the convolution of gyral shape, regardless of the effect of sulcal depth in reflecting the degree of folding.
In both hemispheres the mean cortical thickness and folding area showed significant combination effects on the cortical complexity and accounted for about 50% of its variance. A high FD value in the cortical surface could imply a thinner and more convoluted cortex structure. The standardized β coefficient of cortical thickness was negative, which means a negative correlation between cortical thickness and FD. The most accepted hypothesis of the mechanism leading to folding of the cerebral cortex suggests that tension along axons in the white matter is the primary driving force for cortical folding. Under the tension, the radial axis would be mechanically stiffer than the tangential axes. Cortical cellular growth would occur preferentially along tangential axes, the path of least resistance [Van Essen,1997]. Moreover, cortical folding causes shearing that tends to stretch the radial axis along layers of cerebral cortex. These folding mechanisms could cause our results, which showed that thick cerebral cortex had a less complex cortical structure than thin cortex. Brain cortex may develop in a pattern with a negative correlation between cortical thickness and complexity. Variability of cortical complexity and thickness in each person could result from the differences of neurogenesis induced by the gender effect, brain size, and numerous other factors. Our findings conflict with some previous examinations that detected thicker cortex and higher complexity in women and a positive correlation between cortical thickness and complexity in healthy controls in some regions of the right hemisphere [Luders et al.,2004, 2005a,b; Thompson et al., 2005]. To measure cortical thickness and FD, these previous studies and our study applied 3‐D parametric mesh‐based techniques to extraction of cortical surface [Kim et al.,2005; MacDonald,1998; MacDonald et al.,2000]. The surface model representing the geometry of cortex shape is important for determining values of cortical thickness and FD. Discrepancies in findings might be attributable to differences in the method of cortical surface modeling. Measurement of FD and cortical thickness are not identical methodologically with previous studies, which could also induce the different results.
The folding area was the most significant factor accounting for the FD of the cortical surface with positive coefficients in both hemispheres and several lobe regions. In the left temporal region, sulcal depth was significantly included in the regression equation and the combination of folding area and sulcal depth had an effect on the FD of cerebral cortex. No other regions showed a significance of the sulcal depth variable in statistical analysis. The number of folds and the convolution of the gyral shape were more influential in affecting cortical complexity than sulcal depth. The results could suggest that human cortex developed to have complex structure by increasing the frequency of folds and convolution of gyral shape rather than by deepening sulcal regions. In the left occipital and right frontal, temporal, and occipital regions, the regression model with those predictors could not account for the FD of the cortical surface. The effects of predictor variables on FD may disappear in regional analysis because of a lack of sensitivity in detecting geometrical features.
We examined the relationship between the cortical complexity by FD and the IQ and the number of years of education. Previous reports indicated that IQ is strongly related to differences in GM and WM volumes in a number of specific areas distributed mostly in frontal, temporal, and parietal regions using the voxel‐based morphometry technique [Haier et al.,2004]. In this study, we revealed a significant positive correlation between cortical complexity and IQ in the right hemisphere. This may suggest that not only the volume of specific regions but also the complex shape of the cortical surface has a significant relationship with intelligence in the human brain. The results between the number of years of education and the FD could indicate that the sulcal folding pattern of human brain is more complex structurally as humans become more educated. Learning and education is a postnatal experience and recent studies showed that learning and training change and reorganize cortex structure [Draganski et al.,2004; Mechelli et al.,2004]. These results could provide interesting clues about the relationship between learning and the structural complexity of the brain. For further research and conclusions, longitudinal analysis will be needed.
In this study, a 3‐D surface‐based method was employed for the analyses. We reconstructed cortical surfaces using the CLASP algorithm, which shows reliable performance in representing folded gyri using partial volume information and overcoming the limitations of volumetric segmentation [Kim et al.,2005]. Representing well‐defined folded sulcal regions in the cortical surface enables more precise measurement of cortical complexity, thickness, and folding area. Cortical thickness measured from the cortical surfaces was differentiated between the cortices of opposing sulcal walls within the same sulcal bed, providing reliable measurements in deep sulci. Cortical thickness was defined as the distance between corresponding vertices from inner and outer surfaces. Previous studies evaluated the precision of several algorithms [Fischl and Dalem,2000; Jones et al.,2000; MacDonald et al.,2000] and suggested that the method used in this study is the simplest and most precise method [Lerch and Evans,2005]. The sulcal depth defined in each region was the weighted average of the maximal depth with the sulcal length. We selected major sulci due to the errors involved in secondary and tertiary sulcal extraction. The disadvantage of these methods resides in their inability to represent the actual depth in every sulcal fundi. The geodesic depth in vertices of fundus regions from gyral crowns on the surface could be more sensitive to reflecting the actual depth of cortical folding. This might refine the results of this study. Sulcal depth could be a significant variable in the regression model in some regions, revealing significant correlation with FD undetected in this analysis. Automatic detection of sulcal fundus regions and measurement of geodesic depth in theses regions may be needed for more exact depth analysis in future work. The purpose of the folding area measurement was to reflect the frequency of cortical folding and convolution of gyral shape. FD in human cortex may be increased in cases both of more frequency of folding and gyral convolution. In fact, we still do not know which of those two determinants has more influence on the FD. The distinction and extraction of these two variables may be ambiguous anatomically and also not simple technically, due to unclear criteria. Gyral convolution and frequency of folding are related to each other in many cortical regions. More gyral convolutions in the human brain of limited size induces more small folds and its effect could increase the frequency of folding. For future work, it may make our results more interpretable to disentangle the influence of these two variables on FD. We could increase the power of the regression analysis by reducing the methodological error of each measure and considering other significant variables related to structural complexity.
CONCLUSION
We interpreted the variation of the FD in the cortical surface with a stepwise multiple regression. Our findings may suggest that cerebral cortex initiates a pattern of thinning cortical thickness and an increasing frequency of folds and convolution of gyral shape rather than deepening sulcal regions when the FD is increased in cerebral cortex. It may provide important information about brain development. Through correlation analysis of FD with IQ and the number of years of education, the results showed that the complex shape of the cortical surface has a significant relationship with intelligence and education.
REFERENCES
- Annett M (1970): A classification of hand preference by association analysis. Br J Psychol 61: 303–321. [DOI] [PubMed] [Google Scholar]
- Blanton RE, Levitt JG, Thompson PM, Narr KL, Capetillo‐Cunliffe L, Nobel A, Singerman JD, McCracken JT, Toga AW (2001): Mapping cortical asymmetry and complexity patterns in normal children. Psychiatry Res 107: 29–43. [DOI] [PubMed] [Google Scholar]
- Bullmore E, Brammer M, Harvey I, Persaud R, Murray R, Ron M (1994): Fractal analysis of the boundary between white matter and cerebral cortex in magnetic resonance images: a controlled study of schizophrenic and manic‐depressive patients. Psychol Med 24: 771–781. [DOI] [PubMed] [Google Scholar]
- Cachia A, Mangin JF, Riviere D, Kherif F, Boddaert N, Andrade A, Papadopoulos‐Orfanos D, Poline JB, Bloch I, Zilbovicius M (2003): A primal sketch of the cortex mean curvature: a morphogenesis based approach to study the variability of the folding patterns. IEEE Trans Med Imaging 22: 754–765. [DOI] [PubMed] [Google Scholar]
- Caviness VS, Meyer J, Makris N, Kennedy DN (1996): MRI‐based parcellation of human neocortex: an automatically specified method with estimate of reliability. J Cogn Neurosci 8: 566–588. [DOI] [PubMed] [Google Scholar]
- Cointepas Y, Mangin JF, Garnero L, Poline JB, Benali H (2001): BrainVISA: software platform for visualization and analysis of multi‐modality brain data. Neuroimage 13: S98. [Google Scholar]
- Collins DL, Neelin P, Peters TM, Evans AC (1994): Automatic 3D intersubject registration of MR volumetric data in standardized Talairach space. J Comput Assist Tomogr 18: 192–205. [PubMed] [Google Scholar]
- Cook MJ, Free SL, Manford MR, Fish DR, Shorvon SD, Stevens JM (1995): Fractal description of cerebral cortical patterns in frontal lobe epilepsy. Eur Neurol 35: 327–335. [DOI] [PubMed] [Google Scholar]
- Cox RW, Hyde JS (1997): Software tools for analysis and visualization of fMRI data. NMR Biomed 10: 171–178. [DOI] [PubMed] [Google Scholar]
- Crespo‐Facorro B, Kim JJ, Andreasen NC, O'Leary DS, Wiser AK, Bailey JM, Harris G, Magnotta VA (1999): Human frontal cortex: an MRI‐based parcellation method. Neuroimage 10: 500–519. [DOI] [PubMed] [Google Scholar]
- Draganski B, Gaser C, Busch V, Schuierer G, Bogdahn U, May A (2004): Neuroplasticity: changes in grey matter induced by training. Nature 427: 311–312. [DOI] [PubMed] [Google Scholar]
- Editorial L (1991): Fractals and medicine. Lancet 338: 1425–1426. [PubMed] [Google Scholar]
- Fischl B, Dale AM (2000): Measuring the thickness of the human cerebral cortex from magnetic resonance images. Proc Natl Acad Sci U S A 97: 11050–11055. [DOI] [PMC free article] [PubMed] [Google Scholar]
- Free SL, Sisodiya SM, Cook MJ, Fish DR, Shorvon SD (1996): Three‐dimensional fractal analysis of the white matter surface from magnetic resonance images of the human brain. Cereb Cortex 6: 830–836. [DOI] [PubMed] [Google Scholar]
- Ha TH, Yoon U, Lee KJ, Shin YW, Lee JM, Kim IY, Ha KS, Kim SI, Kwon JS (2005): Fractal dimension of cerebral cortical surface in schizophrenia and obsessive‐compulsive disorder. Neurosci Lett 384: 172–176. [DOI] [PubMed] [Google Scholar]
- Haier RJ, Jung RE, Yeo RA, Head K, Alkire MT (2004): Structural brain variation and general intelligence. Neuroimage 23: 425–433. [DOI] [PubMed] [Google Scholar]
- Havlin S, Buldyrev SV, Goldberger AL, Mantegna RN, Ossadnik SM, Peng CK, Simons M, Stanley HE (1995): Fractals in biology and medicine. Chaos Solitons Fractals 6: 171–201. [DOI] [PubMed] [Google Scholar]
- Jones SE, Buchbinder BR, Aharon I (2000): Three‐dimensional mapping of cortical thickness using Laplace's equation. Hum Brain Mapp 11: 12–32. [DOI] [PMC free article] [PubMed] [Google Scholar]
- Kabani N, Le Goualher G, MacDonald D, Evans AC (2001): Measurement of cortical thickness using an automated 3‐D algorithm: a validation study. Neuroimage 13: 375–380. [DOI] [PubMed] [Google Scholar]
- Kim JJ, Crespo‐Facorro B, Andreasen NC, O'Leary DS, Zhang B, Harris G, Magnotta VA (2000): An MRI‐based parcellation method for the temporal lobe. Neuroimage 11: 271–288. [DOI] [PubMed] [Google Scholar]
- Kim JS, Singh V, Lee JK, Lerch J, Ad‐Dab'bagh Y, MacDonald D, Lee JM, Kim SI, Evans AC (2005): Automated 3‐D extraction and evaluation of the inner and outer cortical surfaces using a Laplacian map and partial volume effect classification. Neuroimage 27: 210–221. [DOI] [PubMed] [Google Scholar]
- Kiselev VG, Hahn KR, Auer DP (2003): Is the brain cortex a fractal? Neuroimage 20: 1765–1774. [DOI] [PubMed] [Google Scholar]
- Koo BB, Lee JM, Kim HP, Shin YW, Kim IY, Kwon JS, Kim SI (2005): Representative brain selection using a group‐specific tissue probability map. Magn Reson Imaging 23: 809–815. [DOI] [PubMed] [Google Scholar]
- Lee JM, Yoon U, Kim JJ, Kim IY, Lee DS, Kwon JS, Kim SI (2004): Analysis of the hemispheric asymmetry using fractal dimension of a skeletonized cerebral surface. IEEE Trans Biomed Eng 51: 1494–1498. [DOI] [PubMed] [Google Scholar]
- Lerch JP, Evans AC (2005): Cortical thickness analysis examined through power analysis and a population simulation. Neuroimage 24: 163–173. [DOI] [PubMed] [Google Scholar]
- Liebovitch LS, Toth TI (1989): A fast algorithm to determine fractal dimensions by box counting. Phys Lett A 141: 386–390. [Google Scholar]
- Liu JZ, Zhang LD, Yue GH (2003): Fractal dimension in human cerebellum measured by magnetic resonance imaging. Biophys J 85: 4041–4046. [DOI] [PMC free article] [PubMed] [Google Scholar]
- Luders E, Narr KL, Thompson PM, Rex DE, Jancke L, Steinmetz H, Toga AW (2004): Gender differences in cortical complexity. Nat Neurosci 7: 799–800. [DOI] [PubMed] [Google Scholar]
- Ma C‐M, Wan S‐Y (2001): A medial‐surface oriented 3‐D two‐subfield thinning algorithm. Pattern Recogn Lett 22: 1439–1446. [Google Scholar]
- MacDonald D (1998): A method for identifying geometrically simple surfaces from three dimensional images. PhD thesis, McGill University.
- MacDonald D, Kabani N, Avis D, Evans AC (2000): Automated 3‐D extraction of inner and outer surfaces of cerebral cortex from MRI. Neuroimage 12: 340–356. [DOI] [PubMed] [Google Scholar]
- Mechelli A, Crinion JT, Noppeney U, O'Doherty J, Ashburner J, Frackowiak RS, Price CJ (2004): Neurolinguistics: structural plasticity in the bilingual brain. Nature 431: 757. [DOI] [PubMed] [Google Scholar]
- Narr K, Thompson P, Sharma T, Moussai J, Zoumalan C, Rayman J, Toga A (2001): Three‐dimensional mapping of gyral shape and cortical surface asymmetries in schizophrenia: gender effects. Am J Psychiatry 158: 244–255. [DOI] [PMC free article] [PubMed] [Google Scholar]
- Narr KL, Bilder RM, Kim S, Thompson PM, Szeszko P, Robinson D, Luders E, Toga AW (2004): Abnormal gyral complexity in first‐episode schizophrenia. Biol Psychiatry 55: 859–867. [DOI] [PubMed] [Google Scholar]
- Ochiai T, Grimault S, Scavarda D, Roch G, Hori T, Riviere D, Mangin JF, Regis J (2004): Sulcal pattern and morphology of the superior temporal sulcus. Neuroimage 22: 706–719. [DOI] [PubMed] [Google Scholar]
- Rademacher J, Galaburda AM, Kennedy DN, Filipek PA, Caviness VS (1992): Human cerebral cortex: localization, parcellation, and morphometry with magnetic resonance imaging. J Cogn Neurosci 4: 352–374. [DOI] [PubMed] [Google Scholar]
- Riviere D, Mangin JF, Papadopoulos‐Orfanos D, Martinez JM, Frouin V, Regis J (2002): Automatic recognition of cortical sulci of the human brain using a congregation of neural networks. Med Image Anal 6: 77–92. [DOI] [PubMed] [Google Scholar]
- Sarraille JJ, Myers LS (1994): FD3: a program for measuring fractal dimension. Educ Psychol Meas 54: 94–97. [Google Scholar]
- Sled JG, Zijdenbos AP, Evans AC (1998): A nonparametric method for automatic correction of intensity nonuniformity in MRI data. IEEE Trans Med Imaging 17: 87–97. [DOI] [PubMed] [Google Scholar]
- Spitzer RL, Williams JB, Gibbon M, First MB (1992): The structured clinical interview for DSM‐III‐R (SCID). I. History, rationale, and description. Arch Gen Psychiatry 49: 624–629. [DOI] [PubMed] [Google Scholar]
- Toro R, Burnod Y (2003): Geometric atlas: modeling the cortex as an organized surface. Neuroimage 20: 1468–1484. [DOI] [PubMed] [Google Scholar]
- Van Essen DC (1997): A tension‐based theory of morphogenesis and compact wiring in the central nervous system. Nature 385: 313–318. [DOI] [PubMed] [Google Scholar]
- Wechsler D (1981): Adult intelligence scale‐revised: manual. New York: Psychological Corp. [Google Scholar]
- Zijdenbos AP, Dawant BM, Margolin RA, Palmer AC (1994): Morphometric analysis of white matter lesions in MR images: method and validation. IEEE Trans Med Imaging 13: 716–724. [DOI] [PubMed] [Google Scholar]
- Zijdenbos AP, Evans AC, Riahi F, Sled JG, Chui J, Kollakian V (1996): Automatic quantification of multiple sclerosis lesion volume using streotaxic space. Proc 4th Int Conf on Visualization in BioMed. Computing VBC, Lecture Notes in Computer Science 1131: 439–448.
- Zijdenbos AP, Forghani R, Evans AC (1998): Automatic quantification of MS Lesions in 3D MRI brain data sets: validation of INSECT. MICCAI, Lecture Notes Comput Sci 1496: 439–448. [Google Scholar]