

Abstract
Research has consistently confirmed changes occur in brain morphometry between adolescence and adulthood. The purpose of the present study was to explore anatomical change during a specific environmental transition. High‐resolution T1‐weighted structural magnetic resonance imaging (MRI) scans were acquired from 19 participants (mean age at initial scan = 18.6 years) during their freshman year. Scans were completed during the fall term and 6 months later before the conclusion of the school year. Voxel‐based morphometry was used to assess within‐subject change. Significant intensity increases were observed along the right midcingulate, inferior anterior cingulate gyrus, right caudate head, right posterior insula, and bilateral claustrum. Regional changes were not observed in two control groups; one controlling for method and another controlling for age‐specific change over time. The results suggest that significant age‐related changes in brain structure continue after the age of 18 and may represent dynamic changes related to new environmental challenges. Findings from the regions of change are discussed in the context of specific environmental demands during a period of normative maturation. Hum Brain Mapp, 2005. © 2005 Wiley‐Liss, Inc.
Keywords: magnetic resonance imaging, voxel‐based morphometry, human development
INTRODUCTION
The transition from adolescence to adulthood is known to be a time of tremendous change. Between the ages of 18 and 25, most young adults move away from their parents or guardians and become self supported for the first time [Cohen et al., 2003]. Marked shifts in the romantic relationships, risk‐taking behavior, insight, and worldviews of young adults have been well documented during this time [Arnett, 2000]. Such research has demonstrated convincingly that a person continues to mature behaviorally between the ages of 18 and 25; however, changes in brain structure accompanying this period of development have remained unclear. A thorough understanding of the structural and functional changes occurring in the brain during young adulthood is critical to advancing our knowledge of the neural basis of cognitive, social, and emotional development.
Postmortem studies were the first to reveal that development in the central nervous system begins during gestation and continues well into the third decade of life [Benes et al., 1994; Brody et al., 1987; Hunter et al., 1997; Yakovlev and Lecours, 1967]. These findings have been supported by work using positron emission tomography (PET), which can provide regional measures of baseline glucose metabolism. Using this method, cortical metabolic activity across the brain has been shown to reach stable, adult‐like, levels in the mid‐twenties [Van Bogaert et al., 1998]. More recently, studies using magnetic resonance imaging (MRI) have confirmed that brain maturation continues throughout adolescence and into young adulthood. Specifically, white matter volume increases linearly and continues to increase into midlife [Bartzokis et al., 2001; Giedd et al., 1999]. Further, gray matter volume has been shown to have a quadratic developmental trajectory, with volume increasing during childhood, peaking during adolescence, and then decreasing once more during late adolescence and young adulthood [Gogtay et al., 2004; Reiss et al., 1996; Sowell et al., 2001]. The gray volume peak of each region differs temporally, with frontal and temporal lobes having the latest apex points [Giedd et al., 1999; Gogtay et al., 2004; Reiss et al., 1996]. Spatially, the dorsal, medial, and lateral areas of prefrontal cortex and posterior areas of temporal cortex have been shown to develop last, with the perisylvian region of the posterior temporal lobe having a characteristic late maturational pattern [Gogtay et al., 2004; Sowell et al., 2001]. Changes in subcortical gray matter during adolescence and young adulthood have also been noted to occur in putamen, globus pallidus, and caudate [Sowell et al., 1999; Thompson et al., 2000]. Taken together, the aforementioned results converge to suggest that there remain notable changes in brain structure that occur after the traditional “adult” age of 18 years.
Existing research into neural development in young adults has left a number of questions unanswered. Although the amount of information on normative maturation during this time has increased markedly in the last 5 years, many previous studies have been hampered by a lack of temporal or spatial specificity. For example, several studies have employed a cross‐sectional design, which cannot establish precisely when developmental changes are taking place [Sowell et al., 1999]. Such a design also introduces an unknown amount of individual variation into the results [see Sowell et al., 2001]. Other studies have used a longitudinal design but investigated only gross volumetric changes in large predefined lobar regions [Giedd et al., 1999; Reiss et al., 1996]. Although this increases temporal specificity, this method of analysis precludes the possibility of knowing specifically where changes are occurring within the large volume. Recently, studies using cortical pattern‐matching techniques have been able to discern very slight changes in cortical gray matter density by accounting for sulcal variability between individuals [Sowell et al., 2002; Toga and Thompson, 2001]. Because it accommodates areas of high sulcal variability, pattern matching is regarded by some as a more powerful test of change than is traditional voxel‐based morphometry [Sowell et al., 2004]. Still, current pattern matching techniques have limited investigation to density changes occurring in gray matter of the outer cortical surface, excluding subcortical areas from examination. Investigations to date have also been limited by a lengthy interscan interval, the briefest of which has been 2 years [Giedd et al., 1999; Gogtay et al., 2004]. Given the aforementioned findings an improved yet incomplete picture of neural development exists today.
The departure from home is the defining event in an emerging adult's drive toward independence [Arnett, 2000]. It is a time filled novel cognitive, social, and emotional challenges that require ongoing adaptation. The present study sought to closely examine the anatomical changes occurring during this time. By utilizing longitudinal design and a focused period of investigation we sought to build on the strengths of previous research while advancing current voxel‐based morphometric methods. Further, by examining changes in brain structure during the first year of college, we hoped to capitalize on the interaction of pre‐programmed neural development associated with emerging adulthood and any structural accommodation that may take place in response to significant environmental changes.
SUBJECTS AND METHODS
Participants
Nineteen healthy first‐year college students (9 females, 10 males; age range 17.9–19.8 years; mean age 18.6 years) composed the experimental group of the study (E). Each participant in the experimental group (E) was scanned at two time points approximately 6 months apart. Scans were completed during the fall term and before the conclusion of the academic year. Participants were recruited at random from a list of all incoming freshmen students. All experimental group participants must have moved more than 100 miles away from home to be included. Twenty subjects (12 females, 8 males; age range 19.7–50.8 years; mean age 26.9 years) composed a methodological control group (C1). All participants in this condition were recruited from the local academic community and were either currently pursuing or had already received their undergraduate degree. Each participant in the methodological control group (C1) completed two same‐day scans. During this back‐to‐back session, the subjects were scanned once, removed from the scanner, immediately returned to the scanner, and then scanned a second time. Seventeen subjects over the age of 25 (9 females, 8 males; age range 24.8–34.6 years; mean age 29.2 years) composed an experimental control group (C2). Each participant in the experimental control group (C2) was over the age of 25 and completed two scans at time points 6 months apart. All participants in this condition were recruited from the local academic community and were working toward their graduate degree, or engaged in postdoctoral education. All subjects were recruited by e‐mail, provided written informed consent, and were compensated for their time.
Great effort went into matching the control group (C2) to the experimental group. All control subjects had to have moved away from home to attend an undergraduate institution after high school. This was done to better equate the groups in terms of life experience and educational exposure. Further, all control (C2) subjects were either students or employees within the local academic community. This was done to exclude more general environmental confounds, as the control subjects were living and working in the same setting as the experimental (E) subjects.
Imaging Data Acquisition
All anatomical MRI images were acquired using a 1.5‐Tesla GE Signa MR scanner (General Electric Medical Systems, Milwaukee, WI) located at Dartmouth College. A quadrature birdcage head coil was used for radiofrequency (RF) transmission and reception. Foam padding was placed within the head coil as a method of limiting head movement during the scan. Images were acquired using a high‐resolution 3‐D spoiled gradient recovery sequence (SPGR) in 124 sagittal slices. Imaging parameters were: echo time (TE) = 3 ms, repetition time (TR) = 7.7 ms, flip angle = 15 degrees, acquisition matrix = 256 × 256, inversion recovery (IR) prep time = 315 ms, field of view (FOV) = 24 cm, and voxel size = 1 × 1 × 1.2 mm with no gap. The scan parameters were identical for all sessions of the study.
Image Preprocessing
All acquired anatomical images were processed using SPM2 (Wellcome Department of Cognitive Neurology, London) with MATLAB 6.5.1 (The Mathworks, Natick, MA) on a Macintosh Powerbook G4 (Apple Computer, Cupertino, CA). The image processing procedure is based on the voxel‐based morphometry (VBM) strategy devised by Ashburner and Friston [2000] and later optimized by Good et al. [2001]. Modifications to the standard VBM procedure were made to better accommodate within‐subject investigation. Images for all groups were classified as time one (Tone) or time two (Ttwo) based on temporal sequence to preserve order effects. This complete preprocessing procedure is illustrated in Figure 1. The procedure was completed sequentially as follows.
Figure 1.
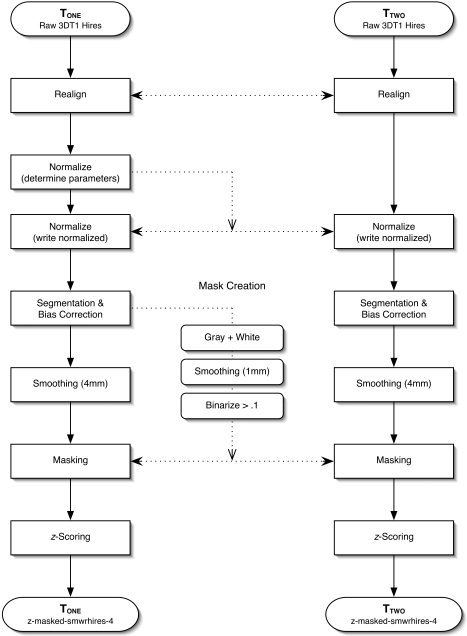
Image preprocessing workflow. This is an overview of the steps necessary to prepare a pair of images for statistical analysis.
Template creation
A custom anatomical normalization template was created for each group (E, C1, C2). The template creation process involved spatially normalizing each image into a standard space (see below), smoothing with an 8‐mm full‐width at half‐maximum (FWHM) isotropic Gaussian kernel, and averaging across all images to yield a template image. A gray matter prior probability map and white matter prior probability map were also generated for later use in segmentation. The procedure for generating the anatomical templates and prior probability images is identical to the process outlined by Good et al. [2001].
Realignment
Images from Tone and Ttwo scans were realigned and coregistered using a least‐squares approach with a six‐parameter rigid body affine transformation [Friston et al., 1995]. In this manner both images are placed in the same native space for subsequent processing. No reslicing of the images was done. Only modifications to the transformation matrix defining translation and rotation of the rigid body volume were made.
Normalization
Parameters for the normalization of images into a standard 3D stereotaxic space defined by International Consortium for Brain Mapping (ICBM)‐305 were determined from the Tone image [Ashburner and Friston, 1999; Ashburner et al., 1997; Mazziotta et al., 1995]. The ICBM‐305 space approximates that of the Talairach and Tournoux [1988] atlas. Parameters determined from the Tone image were applied to spatially normalize both the Tone and Ttwo images. This was done to guarantee that nonlinear deformations used in normalization would be identical for both images. This eliminates the possibility that voxel intensity differences would be related to a difference in nonlinear deformations. The use of this method follows from an a priori assumption that total cranial volume and localized regional shape are not changing within the 6‐month window of investigation [Giedd et al., 1996; Kretschmann et al., 1986].
Masking
Images were masked to only include voxels of interest. The Tone and Ttwo images were first segmented into probabilistic images of cerebral white and gray matter. These images were then smoothed 1 mm FWHM and recombined to produce a single whole‐brain mask. This mask was then used for the removal of cerebrospinal fluid, skull, and other voxels not under investigation.
Bias correction
An RF bias field correction was applied to all scans to compensate for intensity drifts due to magnetic field inhomogeneity. This parametric method of bias removal was completed in conjunction with the segmentation process completed during the masking process [Ashburner, 2002].
Contrast adjustment
Images were converted into z‐score maps to eliminate global intensity and contrast differences between scans. The mean and standard deviation of each image was calculated and those values were subsequently used to z‐score each voxel intensity value.
Smoothing
All images were smoothed with a 4‐mm FWHM isotropic Gaussian kernel. In this manner each voxel becomes a locally weighted average of density defined by the size of the smoothing kernel [Ashburner and Friston, 2000]. Previous studies have used smoothing kernels varying from 8 mm [Critchley et al., 2003a] to 12 mm FWHM [Good et al., 2001]. A smaller smoothing kernel was chosen for the present study based on an a priori assumption of highly localized (< 8 mm FWHM) regional intensity changes. This is acceptable, as a 4‐mm kernel has been shown to sufficiently attenuate nonnormality in VBM analysis [Salmond et al., 2002].
Global Volume and Intensity
To investigate global effects of maturation the volume and mean voxel intensity of gray and white matter across the brain was calculated. The Tone and Ttwo images were first segmented into probabilistic images of cerebral gray and white matter. This was done in the image's native space, before coregistration and normalization changes were made. The quantity and average intensity of voxels in the gray and white matter images were then computed. All statistical analyses were carried out using the statistical software package SPSS 11.0.2 (SPSS Inc., Chicago, IL). Results were considered significant at the level of P < 0.005. Partial η2 was calculated as an effect size measure.
Voxelwise Statistical Analysis
To investigate regional intensity differences a voxelwise one‐way repeated‐measures analysis of variance (ANOVA) was chosen as the method of statistical comparison between the pairs of scans for each group individually. Regions of interest (ROIs) were defined based on the results of the initial group analysis using an automated peak‐search algorithm. This algorithm identified the location of peak areas of change based on the criteria of t‐value and cluster size. Within the clusters an offline one‐way repeated‐measures ANOVA was calculated to examine the main effects and interaction between groups (E,C2) and time (Tone, Ttwo).
RESULTS
Global Effects
Volumes
A significant decrease in total gray matter volume (t[18] = 4.52, P < 0.005, partial η2 = 0.531, two‐tailed) was observed. Total white matter volume increased, but this increase was not significant. A one‐way repeated‐measures ANOVA revealed a significant interaction between gray matter volume decrease and white matter volume increase over time (F[1,18] = 25.69, P < 0.005, partial η2 = 0.588).
Mean intensity
An increase in mean white matter voxel intensity (t[18] = 4.73, P < 0.005, partial η2 = 0.520, two‐tailed) was seen. Mean gray matter intensity increased, but this increase was not significant. A one‐way repeated‐measures ANOVA revealed a significant interaction between increased mean gray matter intensity and increased mean white matter intensity over time (F[1,18] = 12.356, P < 0.005, partial η2 = 0.407).
Total
No statistically significant changes were observed in total brain volume or whole‐brain mean voxel intensity over time.
Regional Effects
Experimental group (E)
Significance was defined as having P < 0.00001 (uncorrected) and cluster size of 50 voxels or more. These values were chosen based upon previous VBM investigations of normal development [Good et al., 2001; Sowell et al., 1999]. Eleven clusters of increasing voxel intensity were noted in the experimental group between fall and spring. These clusters were located in right midcingulate, inferior anterior cingulate gyrus, right caudate, right posterior insula, and bilateral claustrum (see Figs. 2, 3). At this significance threshold no regions of decreasing voxel intensity were found. Table I contains MNI coordinates for significant clusters of increasing voxel intensity over time. A summary of these results can be seen in a glass brain rendering depicting the experimental results (see Fig. 3a). To investigate the homogeneity of change, individual contributions to the group results were calculated. The peak voxel intensity increase for each individual was defined in each region as a four‐voxel contiguous area. These results are depicted in Figure 3b.
Figure 2.
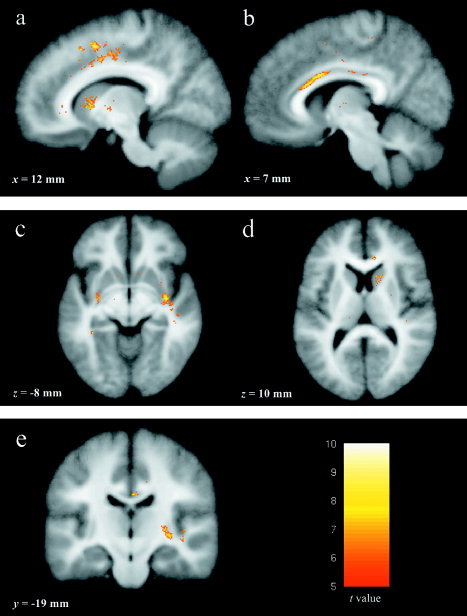
Images of statistically significant (P > 0.00001, 50 voxel extent) voxel intensity increases. Depicted in this image are areas of change in the right dorsal midcingulate (a), inferior anterior cingulate gyrus (b), right posterior insula and bilateral claustrum (c), caudate head (d), and right claustrum (e). All areas are overlaid on an average brain.
Figure 3.
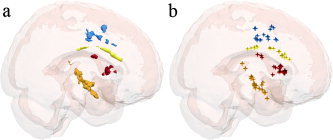
Glass brain renderings showing statistically significant (P > 0.00001, 50 voxel extent) voxel intensity increases. The extent (a) of each area and the location of peak change for each individual (b) are both shown in a sagittal projection. The areas are color coded, with blue indicating midcingulate areas, yellow being inferior anterior cingulate gyrus, red indicating caudate head, and orange showing posterior insula and claustral areas.
Table I.
Identification of voxel intensity increases between fall and spring
| Region label | Region ID | Cluster size (mm3) | MNI coordinates, mm (x, y, z) |
|---|---|---|---|
| Right anterior cingulate | 1 | 151 | 11, 8, 53 |
| 2 | 485 | 8, 10, 27 | |
| 3 | 132 | 3, −17, 30 | |
| 4 | 77 | 13, 19, 33 | |
| 5 | 310 | 11, 2, 41 | |
| 6 | 60 | 4, −8, 39 | |
| Right posterior insula | 7 | 52 | 39, −26, 12 |
| 8 | 1017 | 35, −8, −9 | |
| Right caudate | 9 | 282 | 14, 16, 9 |
| 10 | 95 | 18, −2, 21 | |
| Left claustrum | 11 | 130 | −32, −2, −2 |
n = 19; P < 0.00001.
Control groups (C1 and C2)
In the first control condition (C1) of back‐to‐back scans, no cluster‐level changes between scans were seen. This was true even when the significance was decreased generously (P < 0.001, cluster size 20 voxels). In the second control condition (C2) of participants over the age of 25, there was only one area of change located in right ventral hippocampus. This region was only revealed with a markedly reduced significance level (P < 0.001, cluster size 20 voxels). No systematic increases or decreases of the magnitude and significance seen in the experimental condition were found. The effects of time by group, effects of group by time, and the interaction (time × group) between the experimental (E) group and the long‐term control group (C2) are reported for each region in Table II. The main effect of time was highly significant for the experimental (E) group. There were no significant effects of time observed in the long‐term control group (C2). A main effect of group membership was observed, with the effect being most pronounced at Tone for most regions. With the exception of posterior insula, all regions moved toward long‐term control (C2) intensity values at Ttwo (see Fig. 4). The interaction effect was highly significant for all regions.
Table II.
Detailed statistical analysis of results by region
| Region label | MNI coordinates, mm (x, y, z) | Effect of time | Effect of group | Interaction Time × Group | ||
|---|---|---|---|---|---|---|
| E | C2 | Tone | Ttwo | |||
| Right anterior cingulate | 11, 8, 53 | 45.72c | 2.89 | 12.21c | 4.72a | 44.77c |
| 8, 10, 27 | 78.86c | 0.01 | 10.11b | 1.04 | 29.80c | |
| 3, −17, 30 | 70.80c | 0.70 | 5.94a | 0.06 | 23.36c | |
| 13, 19, 33 | 64.72c | 0.53 | 14.10c | 5.85a | 16.15c | |
| 11, 2, 41 | 71.01c | 0.31 | 4.45a | 0.05 | 27.33c | |
| 4, −8, 39 | 47.17c | 1.44 | 4.65a | 0.50 | 20.79c | |
| Right posterior insula | 39, −26, 12 | 47.25c | 0.17 | 5.72 | 12.00b | 54.99c |
| 35, −8, −9 | 88.84c | 0.21 | 1.42 | 11.97b | 44.40c | |
| Right caudate | 14, 16, 9 | 66.73c | 0.12 | 4.98a | 0.25 | 32.33c |
| 18, −2, 21 | 51.85c | 0.92 | 8.06b | 1.11 | 16.86‡ | |
| Left claustrum | −32, −2, −6 | 52.62c | 0.01 | 5.74a | 1.55 | 32.80c |
Effect of time, effect of group, and interaction are all expressed as F values with degrees of freedom (1, 18).
P < 0.05.
P < 0.01.
P < 0.001.
Figure 4.
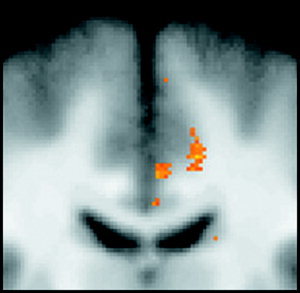
Enlarged coronal image (y = −13) focusing on midcingulate areas of change. Important to note is the location of these regions, largely on the gray/white matter border.
DISCUSSION
The results of the current study demonstrate that there are indeed regionally specific changes in brain structure that occur during the first year of college. These changes are believed to represent the interaction between genetically predetermined and environmentally provoked processes. These results were further validated by the use of multiple comparison groups, which controlled for both data processing techniques and the age of study participants. Finally, by modifying current VBM processing strategies and tailoring them for a within‐subjects design we increased the sensitivity and precision with which we were able to detect anatomical change.
Novel image processing was fundamental to the voxelwise detection of areas of change. Our method controlled for potential confounds introduced through image normalization by using identical parameters to normalize all images from a given subject. Using matching normalization parameters for both Tone and Ttwo images assumes that overall brain size and localized regional shape are not changing over time. This assumption was acceptable for the current study, as it was an examination of normal development during an age when cerebral volume is known to be stable [Giedd et al., 1996; Kretschmann et al., 1986]. The ability of this method to detect change was also considerably enhanced by using an exclusively within‐subject study design. By eliminating individual variation the power to detect change is increased considerably. This, combined with the spatial precision intrinsic to VBM, allowed the temporal and spatial specificity needed to investigate subtle, localized voxel intensity changes.
The statistical analysis in the present study is based on the intensity values of individual voxels measured over time. The intensity value of a single voxel in magnetic resonance imaging is the mathematical summation of all signals emitted from the voxel volume [Brown, 1999]. As a result, the observed voxel intensity shifts may represent any one of several cellular‐level changes. Partial‐volume effects stemming from synaptic density changes, dendritic arborization, and myelination of axons may all contribute to observed changes in voxel intensity. Given this ambiguity, findings from previous studies of neuronal development may clarify the present results.
Current understanding of neuronal development is based largely on postmortem techniques. These studies have highlighted a developmental progression that is faithful to a specific chronology of events. Among the first of these events is the establishment of dendritic length, which has been shown to stabilize by 5 years of age [Koenderink et al., 1994]. During this time, marked changes in synaptic density have also been observed, beginning with proliferation and ending with pruning. The majority of proliferation and pruning have been shown to take place primarily in layers II, III, and IV of the human neocortex [Huttenlocher and Dabholkar, 1997]. Results from the present study, however, indicate that the most significant areas of change are resident on the gray/white matter border (see Fig. 4 for example). Based on location, the data suggest change in deeper layers of cortex (V, VI) or in adjacent white matter. Layers V and VI are known to give rise to efferent fibers and are thought to have a negligible role in synaptic change [Huttenlocher and Dabholkar, 1997]. Despite regional differences in the timing of these events, proliferation is largely concluded by 12 months of age [Huttenlocher, 1990] and pruning has reduced synaptic density across the brain to adult levels by the age of 16 years [Cragg, 1975; Huttenlocher, 1979]. Finally, despite slight neuronal loss in late adulthood, neuron counts in normal individuals are stable into the fifth decade of life [Morrison and Hof, 1997; Terry et al., 1987]. Based on the age of the subjects and the anatomical specificity of the present results it is unlikely that the observed changes in voxel intensity reflect dendritic lengthening, synaptic proliferation, synaptic pruning, or neuronal loss.
The regions of increased voxel intensity likely reflect myelination, a process known to begin before birth and continue throughout life [Benes et al., 1994; Brody et al., 1987; Hunter et al., 1997; Yakovlev and Lecours, 1967]. Myelination is known to have a direct impact on the speed and efficiency of neural processing [Le Bihan, 2003]. At the level of the neuron, increased myelination leads to increased action potential propagation speed and reduced signal attenuation [Koester and Siegelbaum, 2000]. At a macroscopic level this type of maturation facilitates synchrony and coordination, both regionally and across the whole brain [Baird et al., 2005]. Cognitive and behavioral processes are known to rely on white matter integrity. Evidence for this has come largely from studies of demyelinating disorders, such as multiple sclerosis [McDonald and Ron, 1999; Perry and Anthony, 1999] and Guillian‐Barré syndrome [Forsberg et al., 2004; Ragazzoni et al., 2000]. Empirically, white matter maturation has been associated with cognitive development in both childhood [Nagy et al., 2004] and early emerging adulthood [Olesen et al., 2003]. Further, white matter development has been taken as a general expression of functional maturity within the central nervous system [van der Knaap et al., 1991].
Changes in myelination have been observed using traditional anatomical [Bartzokis et al., 2001; Giedd et al., 1999; Gogtay et al., 2004; Reiss et al., 1996; Sowell et al., 1999], proton spectroscopic [Kadota et al., 2001], and diffusion tensor MRI [Suzuki et al., 2003]. In all reported regions of change voxel intensity increased significantly. Although it cannot be said with certainty whether the voxels constitute gray matter, white matter, or some combination thereof, with the exception of one region, all regions of significant change had initial (Tone) mean intensity values closer to those observed in white matter relative to gray matter. Further, the voxel intensity increases between Tone and Ttwo brought the values even closer to the white matter mean intensity value (see Fig. 5). Given the age of our sample and the convergent evidence detailed above it is likely that the principal neuronal event responsible for the observed changes in voxel intensity is myelination. These increases are thought to reflect refinements in signal conduction that have both local and global consequence.
Figure 5.
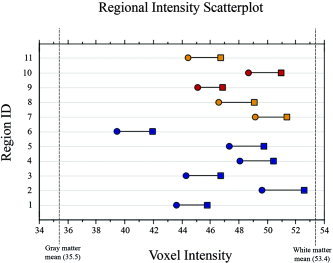
Scatterplot of mean voxel intensity values for each region across time. Mean intensity of gray and white matter across the whole brain at the Ttwo time point are represented as vertical dashed lines. Circles (fall) represent Tone values and squares (spring) represent Ttwo values. The areas are color coded, with blue indicating midcingulate areas, red indicating caudate head, and orange showing posterior insula and claustral areas.
Given that the present results are thought to reflect improvements in myelination and that this process is known to be associated with improvements in information transfer in the brain, it is therefore appropriate to explore the anatomical specificity of our findings in the context of the behavioral changes associated with this period of development. Specifically, it has been detailed that the first year of college is often the first time that individuals live away from the home in which they were reared. Within the present study all subjects had moved greater than 100 miles away from home to attend college. This change in day‐to‐day environmental demands is known to be associated with marked shifts in the romantic relationships, risk‐taking behavior, insight, and world views of young adults [Arnett, 2000]. The sociocognitive skills required to adapt to this new environment are likely related to the changes observed in regions of the brain known to contribute to emotional experience and behavioral regulation. The observed intensity increases in the cingulate, insular cortex, claustrum, and caudate nucleus imply change in the function of these areas. Understanding the relation between development in these regions during emerging adulthood alongside concurrent behavioral shifts may help to make clear the functional implications of the anatomical changes.
One of the hallmarks of the transition to college is the increased role of self‐knowledge in the day‐to‐day life of an individual [Arnett, 2000, 2004; Masten et al., 2004]. Self‐knowledge, in the form of awareness of one's thoughts and feelings as well as the ability to integrate these with the thoughts and feelings of others, forms the foundation of advanced sociocognitive skills [Adolphs, 2003], skills that undoubtedly play a role in the ability to adapt to the changes in environment that accompany the first year of college.
It has long been held that body state and visceral sensation are essential for emotional experience. The James‐Lange theory of emotion was among the first to propose that perception of body state serves as the foundation for the creation of subjective emotional states [James, 1890]. More recently this theory has been amended by Damasio, who posited that internal somatic representations assist cognition by attaching emotional significance to stimuli [Damasio, 1994, 1999; Damasio et al., 2000]. Further, Damasio et al. proposed that this creates a method of weighing potential future action based on its emotional significance. This skill is particularly important for many types of decision making and has clear implications for interpersonal relationships. The present study found significant voxel intensity changes in regions known to be important to the interpretation of visceral information and body state. Given the contributions of these neuroanatomical regions to behavior, the present data suggest that their maturation may be related to improvements in conscious awareness of emotion as well as behavioral regulation.
Conscious awareness of emotion relies principally on the creation of first‐ and second‐order representations of body state. First‐order sensory representations are defined as context‐independent mappings of visceral and autonomic body state information [Critchley et al., 2001]. Although somatosensory cortex plays a crucial role in the construction of first‐order representations [Damasio, 1999], a number of other regions contribute to the integration of sensory information from the body, including both the posterior insula and the caudate nucleus [Craig, 2002; Critchley et al., 2001]. The current investigation observed significant change in the posterior insula, claustrum, and the caudate nucleus, three regions known to contribute to the organization and integration of incoming sensory information. This synthesis of information is critical to the generation of both emotional experience and behavioral response. The posterior insula and claustrum are believed to be structures whose main function involves the organization of incoming information, whereas the caudate is known to serve a similar function for both incoming and outgoing information.
It has been proposed that posterior insular cortex, especially in the right hemisphere, gives rise to the primary cortical representation of visceral sense [Craig, 2004a,b]. It follows that the age‐related changes observed in posterior insula may be associated with improvements in introceptive faculty. Introception is classically defined as the subjective awareness of inner feelings and depends heavily on information relayed to the brain from the body. Posterior insula has been implicated in the processing of sensual touch, thermoreception, pain, itch, muscular sensation, and other body state information [Craig, 2002]. This rich introceptive representation of the body in insular cortex may be critical to self‐awareness, emotional experience, and the creation of second‐level self‐representations [Bechara and Naqvi, 2004; Craig 2004b; Critchley et al., 2001].
Analogous to the function of the posterior insula, the claustrum performs a similar function in that it aggregates multimodal sensory information for dissemination to other brain regions. Anatomically the claustrum is reciprocally connected to virtually every cortical and subcortical brain area [Braak and Braak, 1982; Morys et al., 1993; Rae, 1954]. The claustrum is thought to be involved in multimodal processing and may act as a type of clearinghouse where modality‐specific areas can coordinate, exchange information, and interact [Calvert, 2001; Hadjikhani and Roland, 1998]. Functional imaging studies have shown claustral activation during multimodal tasks involving different combinations of olfactory, auditory, visual, and tactile somatosensory information [Banati et al., 2000; Olson et al., 2002; Savic et al., 2002]. Although the precise behavioral correlates of this region remain elusive, recent research has implicated the claustrum in emotional and motivational responses to stimuli [Denton et al., 1999; Hamamura et al., 1997; Redoute et al., 2000; Tataranni et al., 1999].
The evidence detailed above suggests that one function of both the posterior insula and the claustrum is to integrate diverse sensory components for use in higher‐order processes. Together, they assemble a distinct set of somatic state information that is then available to regions involved in the creation of second‐order sensory representations. Second‐order representations are the product of higher cognition and result from the dynamic integration of first‐order information, current cognitive state, and contextual information [Damasio, 1994, 1999]. This integration may help to explain how the same area of dorsal cingulate responds to tasks involving both physical pain and social rejection [Eisenberger and Lieberman, 2004; Eisenberger et al., 2003; Peyron et al., 2000]. Previous research has demonstrated repeatedly that cingulate cortex is one of the principal generators of second‐order information [Critchley et al., 2001, 2003b]. This is consistent with other research, which has shown the cingulate to play a crucial role in autonomic control and the setting of somatic state [Critchley et al., 2003b]. From these studies it has been suggested that anterior cingulate plays a specific executive role in the integration of current body state, autonomic response selection, and behavioral effort. Given that the present study found significant increases in several cingulate areas it is reasonable to suggest that one consequence of this may be the increased use of second order information in the selection of appropriate behavioral responses.
Complementary to the generation of consolidated incoming visceral and sensory information, the caudate nucleus is believed to regulate, organize, and filter outgoing information received from a number of cortical and subcortical regions including anterior cingulate. Specifically, the caudate nucleus has been implicated in functions of motor control, preparation for action, formulation of strategies, and response, and the establishment and selection of emotional responses [Afifi, 2003]. The present study found increases in signal intensity over time in the caudate nucleus, suggesting improved myelination of fibers supporting inter‐ and intrastructure communication [Mukherjee et al., 2001]. This is consistent with previous research that indicates increasing fractional anisotropy, a known indicator of white matter integrity, in the caudate during the first two decades of life [Mukherjee et al., 2001; Snook et al., 2005]. The structural and functional maturation of the caudate and its connections have been related directly to improvements in performance on the Stroop task [Blumberg et al., 2003] and inhibitory control [Durston et al., 2002]. Of particular relevance to the present findings is the idea that the changes observed in the caudate may reflect improvements in conscious behavioral regulation that are required for successful adaptation to new environments.
The transition from adolescence to adulthood is rife with social and emotional challenges that require cognitive skills to interpret and respond to increasingly complex environmental demands. The first year of college exaggerates specific aspects of this is by placing an individual in close proximity to a large number of other people with whom they lack prior experience. There is also tremendous emphasis placed on self‐knowledge and independence during what is often an individual's first time living away from home. The sociocognitive skills required to get along in this new environment are likely related to the changes observed in regions of the brain known to contribute to emotional experience and behavioral regulation. The observed intensity increases in the insular cortex, claustrum, cingulate, and caudate nucleus imply significant change in the connectivity of these areas. It is conceivable that these changes are at least in part the result of environmental provocation. Environmental provocation of changes in brain structure and function is not a new idea. Such changes have been observed structurally as increases in both gray matter volume [Draganski et al., 2004; Maguire et al., 2000] and white matter integrity [Bengtsson et al., 2005]. These studies add validity to the notion that brain structure is dynamic and environmentally sensitive. Our results suggest that the wholesale change of environmental demands during the freshman year contributes to such discernible changes in brain structure.
The present findings may have particular import with regard to the early states of psychopathology. It is known that at least one form of schizophrenia has its onset between 18 and 21 years of age. Previous research on first‐episode schizophrenics has reported volumetric differences in regions identical to those reported here [Job et al., 2002]. It is therefore conceivable that a brain, which is unresponsive to large environmental shifts such as the transition into adulthood, might represent a risk factor for early‐onset schizophrenia. There are a number of other disorders that also have their onset at this age. Many individuals experience the first episode of bipolar and unipolar depression during the 18–25 age window. A better understanding of normal development during this time is key to preventing or at least improving prognosis for these disorders.
Several factors limit the interpretation of the current findings. The relatively small sample size prevents important gender‐based comparisons and limits the generalizability of the results. Additionally, first‐year students at an Ivy League College are certainly not representative of all young adults. Given this, it is impossible to know what portion of the variance in our findings is a result of a predetermined neurodevelopmental trajectory and what portion is attributable to a biological response to a novel environment. Future studies should not only include a larger number of participants but also examine individuals who attend nonresidential colleges, individuals who engage in military or job training, as well as individuals who continue in a lifestyle similar to that which they had during high school. Another future direction suggested by these data is the exploration of these anatomical regions using other imaging modalities, such as blood oxygen level‐dependent (BOLD) and diffusion tensor imaging (DTI). Results from these types of studies would undoubtedly contribute to the understanding of the functional and connective changes occurring within the brain of emerging adults.
Acknowledgements
We thank Mike Miller and his team who generously contributed several scans that sped the completion of the second control condition (C2). We would also like to thank Jonathan Fugelsang, Daniel Ansari, and Scott Grafton of the Dartmouth neuroimaging community for their reviews of the final article. Finally, we are grateful to Tammy Moran and all other members of the Dartmouth Brain Imaging Center (DBIC) for their hard work and input throughout all phases of this project.
REFERENCES
- Adolphs R (2003): Cognitive neuroscience of human social behaviour. Nat Rev Neurosci 4: 165–178. [DOI] [PubMed] [Google Scholar]
- Afifi AK (2003): The basal ganglia: a neural network with more than motor function. Semin Pediatr Neurol 10: 3–10. [DOI] [PubMed] [Google Scholar]
- Arnett JJ (2000): Emerging adulthood. A theory of development from the late teens through the twenties. Am Psychol 55: 469–480. [PubMed] [Google Scholar]
- Arnett JJ (2004): Emerging adulthood: the winding road from the late teens through the twenties. New York: Oxford: Oxford University Press; 270 p. [Google Scholar]
- Ashburner J (2002): Another MRI bias correction approach. The 8th International Conference on Functional Mapping of the Human Brain, June 2–6, 2002, Sendai, Japan.
- Ashburner J, Friston KJ (1999): Nonlinear spatial normalization using basis functions. Hum Brain Mapp 7: 254–266. [DOI] [PMC free article] [PubMed] [Google Scholar]
- Ashburner J, Friston KJ (2000): Voxel‐based morphometry—the methods. Neuroimage 11: 805–821. [DOI] [PubMed] [Google Scholar]
- Ashburner J, Neelin P, Collins DL, Evans A, Friston K (1997): Incorporating prior knowledge into image registration. Neuroimage 6: 344–352. [DOI] [PubMed] [Google Scholar]
- Baird AA, Colvin MK, Vanhorn JD, Inati S, Gazzaniga MS (2005): Functional connectivity: integrating behavioral, diffusion tensor imaging, and functional magnetic resonance imaging data sets. J Cogn Neurosci 17: 687–693. [DOI] [PubMed] [Google Scholar]
- Banati RB, Goerres GW, Tjoa C, Aggleton JP, Grasby P (2000): The functional anatomy of visual‐tactile integration in man: a study using positron emission tomography. Neuropsychologia 38: 115–124. [DOI] [PubMed] [Google Scholar]
- Bartzokis G, Beckson M, Lu PH, Nuechterlein KH, Edwards N, Mintz J (2001): Age‐related changes in frontal and temporal lobe volumes in men: a magnetic resonance imaging study. Arch Gen Psychiatry 58: 461–465. [DOI] [PubMed] [Google Scholar]
- Bechara A, Naqvi N (2004): Listening to your heart: interoceptive awareness as a gateway to feeling. Nat Neurosci 7: 102–103. [DOI] [PubMed] [Google Scholar]
- Benes FM, Turtle M, Khan Y, Farol P (1994): Myelination of a key relay zone in the hippocampal formation occurs in the human brain during childhood, adolescence, and adulthood. Arch Gen Psychiatry 51: 477–484. [DOI] [PubMed] [Google Scholar]
- Bengtsson SL, Nagy Z, Skare S, Forsman L, Forssberg H, Ullen F (2005): Extensive piano practicing has regionally specific effects on white matter development. Nat Neurosci 8: 1148–1150. [DOI] [PubMed] [Google Scholar]
- Blumberg HP, Kaufman J, Martin A, Whiteman R, Zhang JH, Gore JC, Charney DS, Krystal JH, Peterson BS (2003): Amygdala and hippocampal volumes in adolescents and adults with bipolar disorder. Arch Gen Psychiatry 60: 1201–1208. [DOI] [PubMed] [Google Scholar]
- Braak H, Braak E (1982): Neuronal types in the claustrum of man. Anat Embryol (Berl) 163: 447–460. [DOI] [PubMed] [Google Scholar]
- Brody BA, Kinney HC, Kloman AS, Gilles FH (1987): Sequence of central nervous system myelination in human infancy. I. An autopsy study of myelination. J Neuropathol Exp Neurol 46: 283–301. [DOI] [PubMed] [Google Scholar]
- Brown MA (1999): MRI: Basic principles and applications. New York: Wiley‐Liss. [Google Scholar]
- Calvert GA (2001): Crossmodal processing in the human brain: insights from functional neuroimaging studies. Cereb Cortex 11: 1110–1123. [DOI] [PubMed] [Google Scholar]
- Cohen P, Kasen S, Chen H, Hartmark C, Gordon K (2003): Variations in patterns of developmental transitions in the emerging adulthood period. Dev Psychol 39: 657–669. [DOI] [PubMed] [Google Scholar]
- Cragg BG (1975): The density of synapses and neurons in normal, mentally defective ageing human brains. Brain 98: 81–90. [DOI] [PubMed] [Google Scholar]
- Craig AD (2002): How do you feel? Introception: the sense of the physiological condition of the body. Neuroscience 3: 655–666. [DOI] [PubMed] [Google Scholar]
- Craig AD (2004a): Distribution of trigeminothalamic and spinothalamic lamina I terminations in the macaque monkey. J Comp Neurol 477: 119–148. [DOI] [PubMed] [Google Scholar]
- Craig AD (2004b): Human feelings: why are some more aware than others? Trends Cogn Sci 8: 239–241. [DOI] [PubMed] [Google Scholar]
- Critchley HD, Good CD, Ashburner J, Frackowiak RS, Mathias CJ, Dolan RJ (2003a): Changes in cerebral morphology consequent to peripheral autonomic denervation. Neuroimage 18: 908–916. [DOI] [PubMed] [Google Scholar]
- Critchley HD, Mathias CJ, Dolan RJ (2001): Neuroanatomical basis for first‐ and second‐order representations of bodily states. Nat Neurosci 4: 207–212. [DOI] [PubMed] [Google Scholar]
- Critchley HD, Mathias CJ, Josephs O, O'Doherty J, Zanini S, Dewar BK, Cipolotti L, Shallice T, Dolan RJ (2003b): Human cingulate cortex and autonomic control: converging neuroimaging and clinical evidence. Brain 126: 2139–2152. [DOI] [PubMed] [Google Scholar]
- Damasio AR (1994): Descartes' error: emotion, reason, and the human brain. New York: Putnam; 312 p. [Google Scholar]
- Damasio AR (1999): The feeling of what happens: body and emotion in the making of consciousness. New York: Harcourt Brace; 386 p. [Google Scholar]
- Damasio AR, Grabowski TJ, Bechara A, Damasio H, Ponto LL, Parvizi J, Hichwa RD (2000): Subcortical and cortical brain activity during the feeling of self‐generated emotions. Nat Neurosci 3: 1049–56. [DOI] [PubMed] [Google Scholar]
- Denton D, Shade R, Zamarippa F, Egan G, Blair‐West J, McKinley M, Lancaster J, Fox P (1999): Neuroimaging of genesis and satiation of thirst and an interoceptor‐driven theory of origins of primary consciousness. Proc Natl Acad Sci USA 96: 5304–5309. [DOI] [PMC free article] [PubMed] [Google Scholar]
- Draganski B, Gaser C, Busch V, Schuierer G, Bogdahn U, May A (2004): Neuroplasticity: changes in grey matter induced by training. Nature 427: 311–312. [DOI] [PubMed] [Google Scholar]
- Durston S, Thomas KM, Worden MS, Yang Y, Casey BJ (2002): The effect of preceding context on inhibition: an event‐related fMRI study. Neuroimage 16: 449–453. [DOI] [PubMed] [Google Scholar]
- Eisenberger NI, Lieberman MD (2004): Why rejection hurts: a common neural alarm system for physical and social pain. Trends Cogn Sci 8: 294–300. [DOI] [PubMed] [Google Scholar]
- Eisenberger NI, Lieberman MD, Williams KD (2003): Does rejection hurt? An FMRI study of social exclusion. Science 302: 290–292. [DOI] [PubMed] [Google Scholar]
- Forsberg A, Press R, Einarsson U, de Pedro‐Cuesta J, Widen Holmqvist L (2004): Impairment in Guillain‐Barre syndrome during the first 2 years after onset: a prospective study. J Neurol Sci 227: 131–138. [DOI] [PubMed] [Google Scholar]
- Friston KJ, Ashburner J, Frith CD, Poline J‐B, Heather JD, Frackowiak RS (1995): Spatial registration and normalization of images. Hum Brain Mapp 2: 165–189. [Google Scholar]
- Giedd JN, Blumenthal J, Jeffries NO, Castellanos FX, Liu H, Zijdenbos A, Paus T, Evans AC, Rapoport JL (1999): Brain development during childhood and adolescence: a longitudinal MRI study. Nat Neurosci 2: 861–863. [DOI] [PubMed] [Google Scholar]
- Giedd JN, Snell JW, Lange N, Rajapakse JC, Casey BJ, Kozuch PL, Vaituzis AC, Vauss YC, Hamburger SD, Kaysen D, Rapoport JL (1996): Quantitative magnetic resonance imaging of human brain development: ages 4–18. Cereb Cortex 6: 551–560. [DOI] [PubMed] [Google Scholar]
- Gogtay N, Giedd JN, Lusk L, Hayashi KM, Greenstein D, Vaituzis AC, Nugent TF 3rd, Herman DH, Clasen LS, Toga AW, Rapoport JL, Thompson PM (2004): Dynamic mapping of human cortical development during childhood through early adulthood. Proc Natl Acad Sci USA 101: 8174–8179. [DOI] [PMC free article] [PubMed] [Google Scholar]
- Good CD, Johnsrude IS, Ashburner J, Henson RN, Friston KJ, Frackowiak RS (2001): A voxel‐based morphometric study of ageing in 465 normal adult human brains. Neuroimage 14: 21–36. [DOI] [PubMed] [Google Scholar]
- Hadjikhani N, Roland PE (1998): Cross‐modal transfer of information between the tactile and the visual representations in the human brain: a positron emission tomographic study. J Neurosci 18: 1072–1084. [DOI] [PMC free article] [PubMed] [Google Scholar]
- Hamamura T, Ichimaru Y, Fibiger HC (1997): Amphetamine sensitization enhances regional c‐fos expression produced by conditioned fear. Neuroscience 76: 1097–1103. [DOI] [PubMed] [Google Scholar]
- Hunter SF, Leavitt JA, Rodriguez M (1997): Direct observation of myelination in vivo in the mature human central nervous system. A model for the behaviour of oligodendrocyte progenitors and their progeny. Brain 120: 2071–2082. [DOI] [PubMed] [Google Scholar]
- Huttenlocher PR (1979): Synaptic density in human frontal cortex—developmental changes and effects of aging. Brain Res 163: 195–205. [DOI] [PubMed] [Google Scholar]
- Huttenlocher PR (1990): Morphometric study of human cerebral cortex development. Neuropsychologia 28: 517–527. [DOI] [PubMed] [Google Scholar]
- Huttenlocher PR, Dabholkar AS (1997): Regional differences in synaptogenesis in human cerebral cortex. J Comp Neurol 387: 167–178. [DOI] [PubMed] [Google Scholar]
- James W (1890): The Principles of Psychology New York: H. Holt & Co. [Resource made available online by C.D. Green, Toronto: York University; http://psychclassics.yorku.ca/James/Principles/. Accession date 1 July 2005.] [Google Scholar]
- Job DE, Whalley HC, McConnell S, Glabus M, Johnstone EC, Lawrie SM (2002): Structural gray matter differences between first‐episode schizophrenics and normal controls using voxel‐based morphometry. Neuroimage 17: 880–889. [PubMed] [Google Scholar]
- Kadota T, Horinouchi T, Kuroda C (2001): Development and aging of the cerebrum: assessment with proton MR spectroscopy. AJNR Am J Neuroradiol 22: 128–135. [PMC free article] [PubMed] [Google Scholar]
- Koenderink MJ, Uylings HB, Mrzljak L (1994): Postnatal maturation of the layer III pyramidal neurons in the human prefrontal cortex: a quantitative Golgi analysis. Brain Res 653: 173–182. [DOI] [PubMed] [Google Scholar]
- Koester J, Siegelbaum SA (2000): Local signaling: passive electrical properties of the neuron In: Kandel ER, Schwartz JH, Jessell TM, editors. Principles of neural science (4th ed.). New York: McGraw‐Hill, Health Professions Division; p 140–149. [Google Scholar]
- Kretschmann HJ, Kammradt G, Krauthausen I, Sauer B, Wingert F (1986): Brain growth in man. Bibl Anat : 1–26. [PubMed] [Google Scholar]
- Le Bihan D (2003): Looking into the functional architecture of the brain with diffusion MRI. Nat Rev Neurosci 4: 469–480. [DOI] [PubMed] [Google Scholar]
- Maguire EA, Gadian DG, Johnsrude IS, Good CD, Ashburner J, Frackowiak RS, Frith CD (2000): Navigation‐related structural change in the hippocampi of taxi drivers. Proc Natl Acad Sci USA 97: 4398–4403. [DOI] [PMC free article] [PubMed] [Google Scholar]
- Masten AS, Burt KB, Roisman GI, Obradovic J, Long JD, Tellegen A (2004): Resources and resilience in the transition to adulthood: continuity and change. Dev Psychopathol 16: 1071–1094. [DOI] [PubMed] [Google Scholar]
- Mazziotta JC, Toga AW, Evans A, Fox P, Lancaster J (1995): A probabilistic atlas of the human brain: theory and rationale for its development. The International Consortium for Brain Mapping (ICBM). Neuroimage 2: 89–101. [DOI] [PubMed] [Google Scholar]
- McDonald WI, Ron MA (1999): Multiple sclerosis: the disease and its manifestations. Philos Trans R Soc Lond B Biol Sci 354: 1615–1622. [DOI] [PMC free article] [PubMed] [Google Scholar]
- Morrison JH, Hof PR (1997): Life and death of neurons in the aging brain. Science 278: 412–419. [DOI] [PubMed] [Google Scholar]
- Morys J, Narkiewicz O, Wisniewski HM (1993): Neuronal loss in the human claustrum following ulegyria. Brain Res 616: 176–180. [DOI] [PubMed] [Google Scholar]
- Mukherjee P, Miller JH, Shimony JS, Conturo TE, Lee BC, Almli CR, McKinstry RC (2001): Normal brain maturation during childhood: developmental trends characterized with diffusion‐tensor MR imaging. Radiology 221: 349–358. [DOI] [PubMed] [Google Scholar]
- Nagy Z, Westerberg H, Klingberg T (2004): Maturation of white matter is associated with the development of cognitive functions during childhood. J Cogn Neurosci 16: 1227–1233. [DOI] [PubMed] [Google Scholar]
- Olesen PJ, Nagy Z, Westerberg H, Klingberg T (2003): Combined analysis of DTI and fMRI data reveals a joint maturation of white and grey matter in a fronto‐parietal network. Brain Res Cogn Brain Res 18: 48–57. [DOI] [PubMed] [Google Scholar]
- Olson IR, Gatenby JC, Gore JC (2002): A comparison of bound and unbound audio‐visual information processing in the human cerebral cortex. Brain Res Cogn Brain Res 14: 129–138. [DOI] [PubMed] [Google Scholar]
- Perry VH, Anthony DC (1999): Axon damage and repair in multiple sclerosis. Philos Trans R Soc Lond B Biol Sci 354: 1641–1647. [DOI] [PMC free article] [PubMed] [Google Scholar]
- Peyron R, Laurent B, Garcia‐Larrea L (2000): Functional imaging of brain responses to pain. A review and meta‐analysis (2000). Neurophysiol Clin 30: 263–288. [DOI] [PubMed] [Google Scholar]
- Rae AS (1954): The form and structure of the human claustrum. J Comp Neurol 100: 15–39. [DOI] [PubMed] [Google Scholar]
- Ragazzoni A, Grippo A, Tozzi F, Zaccara G (2000): Event‐related potentials in patients with total locked‐in state due to fulminant Guillain‐Barre syndrome. Int J Psychophysiol 37: 99–109. [DOI] [PubMed] [Google Scholar]
- Redoute J, Stoleru S, Gregoire MC, Costes N, Cinotti L, Lavenne F, Le Bars D, Forest MG, Pujol JF (2000): Brain processing of visual sexual stimuli in human males. Hum Brain Mapp 11: 162–177. [DOI] [PMC free article] [PubMed] [Google Scholar]
- Reiss AL, Abrams MT, Singer HS, Ross JL, Denckla MB (1996): Brain development, gender and IQ in children. A volumetric imaging study. Brain 119: 1763–1774. [DOI] [PubMed] [Google Scholar]
- Salmond CH, Ashburner J, Vargha‐Khadem F, Connelly A, Gadian DG, Friston KJ (2002): Distributional assumptions in voxel‐based morphometry. Neuroimage 17: 1027–1030. [PubMed] [Google Scholar]
- Savic I, Gulyas B, Berglund H (2002): Odorant differentiated pattern of cerebral activation: comparison of acetone and vanillin. Hum Brain Mapp 17: 17–27. [DOI] [PMC free article] [PubMed] [Google Scholar]
- Snook L, Paulson LA, Roy D, Phillips L, Beaulieu C (2005): Diffusion tensor imaging of neurodevelopment in children and young adults. Neuroimage 26: 1164–1173. [DOI] [PubMed] [Google Scholar]
- Sowell ER, Thompson PM, Holmes CJ, Jernigan TL, Toga AW (1999): In vivo evidence for post‐adolescent brain maturation in frontal and striatal regions. Nat Neurosci 2: 859–861. [DOI] [PubMed] [Google Scholar]
- Sowell ER, Thompson PM, Rex D, Kornsand D, Tessner KD, Jernigan TL, Toga AW (2002): Mapping sulcal pattern asymmetry and local cortical surface gray matter distribution in vivo: maturation in perisylvian cortices. Cereb Cortex 12: 17–26. [DOI] [PubMed] [Google Scholar]
- Sowell ER, Thompson PM, Tessner KD, Toga AW (2001): Mapping continued brain growth and gray matter density reduction in dorsal frontal cortex: inverse relationships during postadolescent brain maturation. J Neurosci 21: 8819–8829. [DOI] [PMC free article] [PubMed] [Google Scholar]
- Sowell ER, Thompson PM, Toga AW (2004): Mapping changes in the human cortex throughout the span of life. Neuroscientist 10: 372–392. [DOI] [PubMed] [Google Scholar]
- Suzuki Y, Matsuzawa H, Kwee IL, Nakada T (2003): Absolute eigenvalue diffusion tensor analysis for human brain maturation. NMR Biomed 16: 257–260. [DOI] [PubMed] [Google Scholar]
- Talairach J, Tournoux P. 1988. Coplanar stereotaxic atlas of the human brain. Stuttgart: Thieme. [Google Scholar]
- Tataranni PA, Gautier JF, Chen K, Uecker A, Bandy D, Salbe AD, Pratley RE, Lawson M, Reiman EM, Ravussin E (1999): Neuroanatomical correlates of hunger and satiation in humans using positron emission tomography. Proc Natl Acad Sci USA 96: 4569–4574. [DOI] [PMC free article] [PubMed] [Google Scholar]
- Terry RD, DeTeresa R, Hansen LA (1987): Neocortical cell counts in normal human adult aging. Ann Neurol 21: 530–539. [DOI] [PubMed] [Google Scholar]
- Thompson PM, Giedd JN, Woods RP, MacDonald D, Evans AC, Toga AW (2000): Growth patterns in the developing brain detected by using continuum mechanical tensor maps. Nature 404: 190–193. [DOI] [PubMed] [Google Scholar]
- Toga AW, Thompson PM (2001): Maps of the brain. Anat Rec 265: 37–53. [DOI] [PubMed] [Google Scholar]
- Van Bogaert P, Wikler D, Damhaut P, Szliwowski HB, Goldman S (1998): Regional changes in glucose metabolism during brain development from the age of 6 years. Neuroimage 8: 62–68. [DOI] [PubMed] [Google Scholar]
- van der Knaap MS, Valk J, Bakker CJ, Schooneveld M, Faber JA, Willemse J, Gooskens RH (1991): Myelination as an expression of the functional maturity of the brain. Dev Med Child Neurol 33: 849–857. [DOI] [PubMed] [Google Scholar]
- Yakovlev PI, Lecours AR (1967): The myelogenetic cycles of regional maturation of the brain In: Minkowski A, editor. Regional development of the brain in early life. Oxford: Blackwell; p 3–70. [Google Scholar]