

Abstract
Several human imaging studies have described the neural network involved in power grip under visual control and the subset of cortical areas within this network that are sensitive to force modulation. As there is behavioral evidence for late maturation in even simple hand motor tasks involving visual feedback, we aimed at identifying the neural correlates of these developmental changes. Subjects from three developmental age groups (9–11, 15–17, and adults) performed the same power grip task in both a functional magnetic resonance imaging and an event‐related potential (ERP) session. Trials started with a visual target indicating whether to squeeze at 20%, 40%, or 75% of their maximum and online visual feedback on the actual amount of force was provided. Longer reaction times and more shallow slopes of the force curve characterized the behavior of the younger age groups, especially the children. Both neurophysiological methods detected both general as well as force modulation‐specific maturational changes. General development was characterized by decreasing ERP amplitudes and increasing deactivation of an extended network, closely resembling the so‐called “default” network. The most pronounced developmental changes specific for force control were observed in an ERP component and brain regions involved in feedback processing. In contrast to adult subjects, we found evidence for a stronger dependency on visual feedback information in the younger age groups. Our results also suggest that the ability to deactivate task‐irrelevant networks might be a late developmental achievement. Hum Brain Mapp, 2007. © 2006 Wiley‐Liss, Inc.
Keywords: evoked potentials, fMRI, default mode, visual feedback, development
INTRODUCTION
The neural basis for power grip and associated hand force control [Napier, 1956] under visual feedback have been extensively studied in the past, as these functions play a major role for humans in their daily life. While the neuronal network involved in the power grip and associated force control under visual feedback is well described [Ward and Frackowiak,2003], a maturational description thereof is largely lacking.
Although hand movements and power grip are phylogenetically old functions, and thus thought to mature early in life, there is evidence that aspects of these functions that are under visual or external control undergo more protracted maturational refinement. Behavioral developmental studies have reported that force control, especially under visual feedback, has not reached adult levels in children ages 6–10 [Deutsch and Newell,2001]. In addition, there is evidence that externally guided force control develops later than anticipatory grip force control in 3‐ to 6‐year‐old children [Blank et al.,1999], although the study leaves open whether subsequent maturation continues to be slower.
These late behavioral improvements might rely on both structural and functional maturation of the underlying network. Transcranial electromagnetic stimulation studies suggest that, although the most prominent development of the corticospinal motor pathways occurs before age 10, some central maturation continues at least up to age 13 [Eyre et al.,1991; Koh and Eyre,1988; Muller et al.,1991,1997; Nezu et al.,1997] and parallels further gains in motor speed [Muller and Homberg,1992]. However, it remains unclear how these findings are related to functional cortical maturation as measured by electroencephalography and hemodynamics. Recent structural MRI studies investigating developmental changes in white and gray matter volumes [see Casey et al.,2005, for a review] have found differential patterns of maturation for white and gray matter. While white matter has been shown to increase in volume and density until young adulthood [Giedd et al.,1999; Gogtay et al.,2004; Paus et al.,1999; Pfefferbaum et al.,1994], gray matter volume in most regions decreases after the age of 10–12 [Gogtay et al.,2004; Sowell et al.,2004]. These studies on gray matter loss suggest that regions subserving primary motor and sensory function, including the primary sensorimotor areas near the interhemispheric margin and the precentral gyrus as well as the occipital pole [Gogtay et al.,2004] mature earliest, followed by temporal and parietal cortices and higher‐order association areas. These latter regions are thought to play a major role in integrating primary sensorimotor processes and modulate attention [Gogtay et al.,2004; Sowell et al.,2004]. This is consistent with the previously described behavioral differences in maturation of force control with and without visual feedback.
Power grip under visual control activates an extended motor network in adults, involving the contralateral primary sensorimotor cortex, the ipsilateral cerebellum, the superior parietal cortex, and the ventrolateral thalamus as well as premotor and parietal regions [Binkofski et al.,1998; Ehrsson et al.,2000; Kollias et al.,2001; Ward and Frackowiak,2003]. Within this network, activity in several regions is modulated by the amount of force employed. Single‐cell recording studies in monkeys have reported force‐sensitive neurons in primary motor cortex (M1) [Evarts,1968; Hepp‐Reymond et al.,1978], primary somatosensory cortex (S1) [Wannier et al.,1991], supplementary motor area (SMA) [Smith et al.,1975], and thalamus [Anner‐Baratti et al.,1986]. In humans these findings have been largely replicated with the description of a linear relationship between force and activity in those regions [Cramer et al.,2002; Dai et al.,2001; Dettmers et al.,1995; Ehrsson et al.,2000; Peck et al.,2001; Ward and Frackowiak,2003]. Some of these studies have identified additional brain areas responsive to force modulation, such as the ipsilateral cerebellum, cingulate, prefrontal, and parietal cortices. Studies using scalp‐recorded event‐related potentials (ERPs) identified various components of the movement‐related cortical potentials that are responsive to changes in the force level applied [Siemionow et al.,2000; Slobounov et al.,2002; Slobounov and Ray,1998]. Peak amplitude at the central electrodes, thought to reflect activity in contralateral primary motor cortex [Halder et al.,2005; Toma et al.,2002], has been shown to be particularly sensitive to this force parameter.
The aim of this study was to describe general maturational changes in the neuronal control of power grip and associated force control under visual feedback. We expected to find general as well force modulation‐specific late maturational effects within regions and components related to visuomotor integration processes, needed to transform the online visual feedback information into appropriate motor adjustments. In contrast, evidence of late maturation was not expected in primary areas, such as M1. Two imaging methods, ERPs and functional MRI (fMRI) were used to elucidate differential aspects of late development. Concerning ERP analyses, we focused on two previously identified components: the motor component, which has been shown to modulate activity with force, and second, a visual feedback‐related component. While we expected the fMRI to show a stable active network involved in hand control over the investigated age range, we aimed at identifying further neural correlates of protracted maturation that are specific for graded motor control under visual feedback.
SUBJECTS AND METHODS
Subjects
Groups of 17 adults, 17 adolescents, and 26 children participated in the study. All subjects were healthy, with no history of medical or psychiatric disease, and had normal or corrected to normal vision. All were right‐hand dominant as assessed by the Edinburgh Handedness Inventory [Oldfield,1971]. All adult subjects and the parents of children and adolescents gave written informed consent to participate in this study. Due to ghosting artifacts and major head movement (over 2 mm) during the fMRI measurement, nine children had to be excluded. Thus, for all analyses, 17 adults (mean age, 25 ± 3 years; 9 males), 17 adolescents (mean age, 16 ± 0.5 years; 7 males), as well as 17 children (mean age, 10 ± 0.5 years, i.e., during final corticospinal maturation; 8 males) were included. The study was approved by the local ethics committee and was conducted in accordance with the guidelines determined in the Helsinki Declaration. Participation was rewarded with 60 SFr in the case of adults and with gift coupons in the case of children and adolescents.
Task and Procedure
ERP and fMRI were measured sequentially in two separate counterbalanced sessions (mean time between sessions: 13 ± 8 days). In the same study three further visual experiments (not reported here) were run. The order of the experiments was counterbalanced across subjects and identical for both sessions.
During the ERP‐recordings stimuli were presented on a computer monitor placed 60 cm in front of the subjects. During the fMRI measurement subjects saw the stimuli via a mirror attached to the MR‐coil on a translucent screen. For both sessions the task was displayed with identical visual angle.
The force device (ALEA Solutions, Zurich, Switzerland) consisted of a sphygmomanometer bulb connected to a blood pressure transducer via a 10‐m silicon tube. The transducer translated air compression into an analog signal that was digitized at 12 bit resolution with 100 Hz. During the ERP session, each time the signal changed a marker was written online into the EEG indicating the amount of force exerted at 8 bit resolution. These markers allowed a continuous force trajectory to be calculated offline as an additional channel along with the EEG for the event‐related analyses. A more detailed description of this force task can be found elsewhere [Halder et al.,2005].
Maximum voluntary hand contraction (MVC) was determined just before the experiment in each recording session (EEG/fMRI) and after a minimal practice session consisting of about 10 bulb squeezes per target force level using 20%, 40%, and 75% of their MVC (power grip). Participants were instructed to squeeze the bulb ballistically (reach the requested target force level as quickly and accurately as possible and then release immediately, no holding) with their right hand after visual target presentation. Continuous feedback on the applied force was presented on the screen. The task was divided into 18 pseudorandomized blocks (six blocks per force level). Each block lasted for 30 s and consisted of eight squeezes with targets presented on the average every 4 s using a Stimulus Onset Asynchrony of 4000 ± 500 ms, which varied in a pseudorandomized fashion. Breaks of 15 s were inserted after each block. Thus, the duration of each experimental session was 13.25 min.
The display consisted of a set of concentric rectangles on a white background. The grayscale value of the outer rectangle represented the target force level. Within this frame, a second “response” rectangle (7 × 7.5 cm) indicated the amount of force exerted when squeezing the ball by changing grayscale values. Trials began when the frame turned from white to gray (target) and a small inner rectangle turned from green to red. Participants were instructed to ballistically squeeze the ball as hard as necessary to match the response grayscale value to that of the target. To indicate achievement of the task, the innermost rectangle turned from red to green again when the response force was within a tolerance of 10% MVC of the target value. Each trial lasted for 2 s and ended with the target frame turning white again.
Behavioral Analysis
Performance data was pooled over both experimental sessions. Reaction time (measured from target presentation to force onset), peak amplitude, and slopes (ascending/descending) of the force trajectory (calculated between force onset (for descending slope: force peak) and the point with the steepest slope) as well as movement variability (from 0–100 ms to include the ascending slope of the force trajectory in all groups, calculated individually as the standard deviation of the averaged force trajectories in the same time interval) were analyzed using multivariate analysis of variance (MANOVA; three force levels by three groups). With the exception of reaction time, all behavioral analyses were conducted with values transformed to %MVC.
ERP Recordings
The continuous EEG was recorded using a cap (FMS, Munich, Germany) with 64 channels at 500 Hz/channel, filter set to 0.1–70 Hz (Brainproducts, Munich, Germany). Electrode positions included all 10–20 system electrodes and the additional electrodes Fpz, FCz, CPz, POz, Oz, Iz, AF1/2, F5/6, FC1/2/3/4/5/6, FT7/8/9/10, C1/2/5/6, CP1/2/3/4/5,TP7/8/9/10, P5/6, PO1/2/9/10, OI1/2 plus two electrodes below the outer canthus of each eye. O1′/2′ and Fp1′/2′ were placed 5% (about 2 cm) more laterally for even coverage [Brem et al.,2005]. Impedances for over 80% of the electrodes were kept below 20 kOhm. The few electrodes (less than 1.5%) with high impedances (between 40–60 kOhm) nonetheless delivered reliable EEG‐signal [Ferree et al.,2001].
EEG Analysis
Using Brainvision Analyzer Software (Brainproducts) and custom programs, the continuous raw data were re‐referenced offline to average reference [Lehmann and Skrandies,1980], bandpass‐filtered from 0.3–70 Hz and eyeblink‐corrected by means of independent component analysis [Jung et al.,2000]. Continuous raw data with artifacts exceeding ±80 μV at any electrode were excluded for subsequent analysis. Epochs from −500 to 1000 ms were defined according to the force trajectory‐onset and averaged. Separate averages for each force condition were calculated. The mean number (±SD) of sweeps over all subjects was 42 ± 6 for the high, 43 ± 4 for the medium, and 43 ± 4 for the low force level.
To identify general, temporally stable differences observed between children and adults (where the most pronounced differences were expected) low‐resolution electromagnetic tomography (LORETA) analysis was conducted over the whole time range of the ERP segment (−500 to 1,000 ms). Time frame to time frame comparison with a two‐sample t test using a bootstrapping correction for multiple testing [Nichols and Holmes,2002] was conducted for the average of all force levels between children and adults, resulting in a t value time course for all 2,934 LORETA voxels. These values were subsequently transformed to either 100 (if that time point within the voxel differed significantly between the groups) or zero. The mean value for a voxel over the time segment therefore indicates the fraction of the period (in percent) during which there was a significant difference in the ERPs for that voxel.
In order to identify components of interest, global field power (GFP) was calculated for each subject and condition. GFP peaks [Lehmann and Skrandies,1980] are thought to represent temporally stable map configurations also called microstates. These microstates reflect the stable states of a neural network and can be linked to specific steps in information processing [Steger et al.,2000]. We focused on the peak activity of two previously identified ERP components characteristic to this task [Halder et al.,2005]: the peak of the movement‐related cortical potential occurring 0–100 ms after movement onset, where force‐related amplitude modulation has been reported [Halder et al.,2005; Slobounov and Ray,1998]. And second, a feedback‐related component, which was expected later (200–400 ms). Peak detection on group‐wise overall grand means of the GFP curves was used to identify these components after visual inspection in these particular time ranges. Subsequently, the topographical map derived from the peak of each segment was used to calculate the force level specific covariance of individuals [Brandeis et al.,1992]. Peaks in the covariance channel thus indicated best fit of the mean topographical map with individual files. The peak locations were mapped to the individual GFP curves and the amplitudes and latencies of these were then exported for each force level. MANOVA was used to identify maturational changes.
In order to search for the spatial sources of the group differences between children and adults in the components identified above, the individual ERP datasets were used to compute the distributed LORETA solution of each [Pascual‐Marqui et al.,1994,1999] based on standardized mean electrode positions. Only the highest force level was tested (highest signal‐to‐noise ratio). Eye electrodes were excluded due to localization errors introduced by nonuniform sampling of scalp potentials [Gottselig et al.,2004]. Group comparisons were based on independent sample t tests [Nichols and Holmes,2002]. All LORETA results are reported in the Talairach coordinate system [Talairach and Tournoux,1988].
fMRI Acquisition
Imaging was performed on a 1.5 T Philips Intera system (Philips Medical Systems, Best, The Netherlands). For functional imaging, 268 volumes each consisting of 28 axial slices (whole brain coverage) were acquired with BOLD contrast weighted echo planar imaging (TR = 3 s; TE = 55 ms, TA = 2.57 s; image matrix = 64 × 64; interleaved slice acquisition, slice thickness = 5 mm; no interslice gap; flip angle = 90°). The resulting voxel size was 3.5 × 3.5 × 5 mm. The first four scans of each session were discarded to allow for stabilization of T1‐related saturations effects. Subjects were fitted with earplugs and the head was padded to minimize head movements.
fMRI Data Analysis
Preprocessing and statistical analysis were done using SPM2 (Wellcome Department of Cognitive Neurology, London, http://www.fil.ion.ucl.ac.uk/spm). The data were first slice‐scan‐time corrected, realigned and unwarped [Andersson et al.,2001], and subsequently normalized to the Montreal Neurological Institute (MNI) template (new voxel size 3 × 3 × 3 mm). Spatial smoothing with a 9‐mm full‐width at half‐maximum isotropic Gaussian kernel was performed to enhance statistical power in global random effects analyses. Unsmoothed data were used for the region of interest (ROI) analyses.
While resembling a block design, our test also included variability between trial onsets. We thus used an event‐related analysis, modeling individual movement onsets as single events and convolved them with the canonical hemodynamic response function for a more accurate estimation of the experimental effects [Mechelli et al.,2003]. Movements of the different force levels were coded separately. Global scaling was performed to remove global signal drifts across individual time series. The data were highpass temporally filtered with a frequency cut‐off period of 320 s. No lowpass filter was applied.
In order to identify the network generally involved (disregarding age) in the task the subjects' contrasts of all force levels (against resting blocks) were entered into a one sample t test. The negative contrast (baseline > force) was also calculated. General age‐related effects were tested by correlating these individual contrasts with age (log transformed). To identify the network responsive to force modulation over all age ranges (disregarding age) a linear parametric modulation with force (mean individual %MVC per force level) was conducted per subject and subsequently entered into a one sample t test. Again, we tested for positive as well as negative effects. To test specifically for developmental force modulation related effects, the correlation of age (log transformed) with the individual parametric modulation contrasts was calculated. Regions of interest were defined as the significant clusters and mean percent signal change was extracted for each force level using MarsBar (v. 0.38.2) software [Brett et al.,2002].
Results are reported in the Talairach stereotactic system of coordinates [Talairach and Tournoux,1988]. P values for global analysis were corrected for multiple comparisons using either the stringent family‐wise error (FWE) correction or the false discovery rate (FDR) correction. A corrected significance level of P < 0.05 was adopted for the FWE correction and P < 0.01 for the FDR correction.
RESULTS
Behavior
Mean reaction time (over all groups) was 449 ± 122 ms for the low force condition, 405 ± 98 ms for the medium and 350 ± 80 ms for the high force condition. Figure 1A shows the reaction times by group and force level. Main effects of force (F(2,47) = 55.8, P < 0.001) and group (F(2,48) = 7.126, P < 0.01) as well as a force by group interaction (F(4,96) = 3.469, P = 0.011) were detected. The main effect of force was due to systematically increased reaction times for lower forces (P < 0.001 for all force comparisons). Post‐hoc ANOVAs revealed that the interaction was due to different reaction times at the two lower force levels (F(2,48) = 7.608, P = 0.001), and was absent for the higher force levels. While adults showed only a trend (P = 0.06) for reaction time differences between the low and the medium condition, both adolescents (P < 0.01) and children (P < 0.001) showed a strong reaction time modulation between these force levels. The main effect of group was largely due to the longer latencies in the children compared to adults (P < 0.01 at all force levels).
Figure 1.
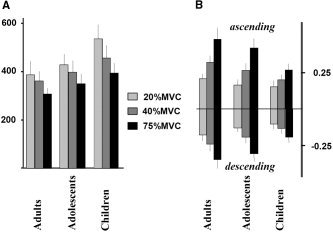
Performance across groups and force levels computed from force curves. A: Reaction time in milliseconds for each force level and group. B: Ascending and descending slopes (in %MVC/ms) for each force level and group.
Mean peak amplitudes for adults (low: 26 ± 4, medium: 42 ± 4 and high 76 ± 6% MVC), adolescents (23 ± 5, 40 ± 4 and 74 ± 6% MVC), and children (26 ± 7, 40 ± 4 and 71 ± 10% MVC) were in the expected range and indicated that all groups were able to perform the task as requested. This was supported by a very significant main effect of force (F(2,47) = 1208.568, P < 0.001) without group effects.
For the ascending force trajectory slope, effects of force (F(2,47) = 162.1, P < 0.001) and group (F(2,47) = 8.589, P = 0.001) as well as a force by group interaction (F(4,96) = 6.858, P < 0.001) were detected. Higher force levels were generally achieved through steeper slopes. Post‐hoc ANOVAs revealed that these effects were stable for both the higher and the lower forces tested separately. As all groups showed significant differences between all force levels, additional normalizing was conducted within a case over the force levels to eliminate the general slope differences between the groups. This reduced the interaction to a trend (P = 0.094) and indicates that the steeper slopes in adults accounts for much of the interaction. Very similar results were obtained for the descending slope (Fig. 1B).
Movement variability within subjects was investigated in the time segment from 0–100 ms including the ascending slope of the force trajectory. No significant group effects were found. However, movement variability increased with higher force levels (F(2,47) = 23.503, P < 0.001), with significant differences between all force levels (P < 0.001).
ERPs
General group differences between children and adults
LORETA revealed generally higher activity in several regions in children compared to adults. Those included the cingulate, posterior cingulate, bilateral middle frontal gyri, and bilateral inferior parietal lobules. See Table I for a more detailed description.
Table I.
LORETA results: general differences between children and adults
| Anatomical region (cytoarchitectural area) | Hemisphere | Talairach coordinates: x, y, z | Time of significant difference (%) |
|---|---|---|---|
| Anterior cingulate (BA 24) | L | −3, 38, 8 | 58 |
| Cingulate gyrus (BA 23) | R | 4, −32, 29 | 71 |
| Cingulate gyrus (BA 31) | R | 4, −46, 29 | 58 |
| Cingulate gyrus (BA 32) | R | 11, 24, 36 | 54 |
| R | 4, 24, 36 | 54 | |
| R | 11, 17, 36 | 54 | |
| Cuneus (BA 18) | L | −3, −95, 22 | 58 |
| L | −17, −67, 15 | 54 | |
| Fusiform gyrus (BA 20) | L | −38, −11, −27 | 58 |
| Inferior parietal lobule (BA 40) | L | −66, −32, 29 | 62 |
| L | −59, −32, 29 | 62 | |
| R | 60, −32, 29 | 58 | |
| Inferior parietal lobule (BA 7) | L | −45, −67, 50 | 54 |
| Inferior temporal gyrus (BA 20) | R | 53, −18, −27 | 62 |
| L | −52, −11, −27 | 58 | |
| Medial frontal gyrus (BA 6) | L | −3, 38, 36 | 54 |
| Medial frontal gyrus (BA 9) | R | 4, 45, 22 | 58 |
| Middle frontal gyrus (BA 10) | L | −38, 38, 8 | 62 |
| Middle frontal gyrus (BA 9) | R | 39, 24, 36 | 71 |
| R | 32, 45, 22 | 58 | |
| R | 53, 24, 36 | 67 | |
| L | −24, 38, 36 | 67 | |
| L | −38, 38, 36 | 62 | |
| Parahippocampal gyrus (BA 36) | R | 32, −32, −27 | 54 |
| Posterior cingulate (BA 31) | L | −10, −67, 15 | 54 |
| Precuneus (BA 7) | L | −17, −67, 50 | 54 |
| L | −3, −67, 50 | 54 | |
| Superior frontal gyrus (BA 10) | L | −31, 52, 22 | 54 |
| Superior frontal gyrus (BA 6) | R | 4, 3, 64 | 54 |
| L | −3, 31, 57 | 54 | |
| Superior occipital gyrus (BA 19) | L | −38, −88, 22 | 62 |
| R | 32, −88, 22 | 58 | |
| Superior parietal lobule (BA 7) | R | 32, −74, 50 | 54 |
| L | −31, −46, 64 | 54 | |
| R | 32, −53, 64 | 54 | |
| R | 25, −53, 64 | 54 | |
| L | −45, −60, 50 | 54 | |
| Supramarginal gyrus (BA 40) | R | 53, −46, 29 | 62 |
All regions exhibiting significant differences over more than 50% of the time are displayed.
Motor component
Figure 2A (upper part) shows the motor component for each group and force level. The lower left panel shows the sources identified as significantly different between children and adults for the high force condition. Table II lists the activation loci displaying developmental differences (t value > 5; corrected P < 0.01). Children showed enhanced activity in several regions, including cuneus and posterior cingulate. Latencies did not differ between groups and conditions. However, amplitudes showed the expected modulation with force, with differences between the highest and the other force levels (P < 0.001). No significant difference could be detected between the lower two force levels.
Figure 2.
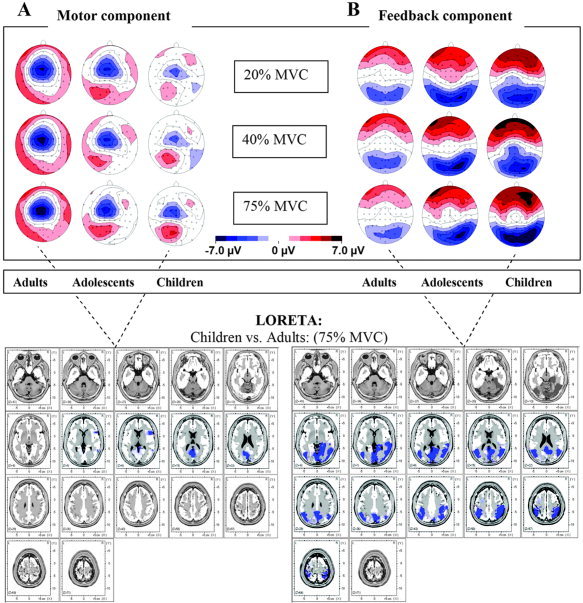
A: Motor component. B: Feedback‐related component. Upper part: Topographical ERP maps for each force level and group for the two time segments of interest. Lower part: Corresponding localization of the ERP differences between children and adults in the highest force condition using LORETA. Slices ranging from z = −41 to z = 57 in 7‐mm steps, blue regions indicating less activity in adults (P < 0.01, see text).
Table II.
LORETA results: location of brain regions with significant, component‐specific ERP differences between children and adults in the highest force condition
| Anatomical region (cytoarchitectural area) | Hemisphere | Talairach Coordinates: x, y, z | T |
|---|---|---|---|
| Motor component | |||
| Angular gyrus (BA 39) | L | −45, −74, 36 | −5.15 |
| Cuneus (BA 19) | L | −3, −88, 29 | −5.2 |
| L | −17, −88, 36 | −5.05 | |
| Inferior parietal lobule (BA 40) | R | 53, −53, 36 | −6.23 |
| Inferior temporal gyrus (BA 19) | L | −45, −74, 1 | −5.44 |
| Lingual gyrus (BA 19) | R | 11, −60, 1 | −5.2 |
| L | −10, −60, 1 | −5.15 | |
| Middle occipital gyrus (BA 19) | L | −45, −74, 8 | −5.44 |
| L | −45, −81, 8 | −5.44 | |
| L | −45, −81, 1 | −5.44 | |
| L | −38, −81, 15 | −5.44 | |
| Middle temporal gyrus (BA 21) | R | 60, −60, 1 | −5.35 |
| Posterior cingulate (BA 30) | R | 4, −60, 8 | −5.2 |
| R | 11, −53, 8 | −5.2 | |
| Precentral gyrus (BA 44) | R | 46, 17, 8 | −5.39 |
| Precuneus (BA 31) | L | −17, −60, 22 | −5.35 |
| L | −17, −67, 22 | −5.35 | |
| Supramarginal gyrus (BA 40) | L | −59, −46, 22 | −5.05 |
| L | −52, −46, 22 | −5.05 | |
| Feedback component | |||
| Cuneus (BA 17) | R | 4, −81, 8 | −5.76 |
| Cuneus (BA 18) | R | 4, −95, 8 | −5.7 |
| Cuneus (BA 19) | L | −17, −88, 36 | −6.1 |
| R | 11, −81, 36 | −6.05 | |
| Fusiform gyrus (BA 37) | R | 46, −46, −13 | −5.53 |
| Inferior frontal gyrus (BA 47) | R | 32, 24, −6 | −5.88 |
| Inferior occipital gyrus (BA 18) | R | 39, −88, −13 | −6.67 |
| R | 32, −88, −13 | −6.67 | |
| Inferior occipital gyrus (BA 19) | L | −45, −81, −6 | −5.59 |
| Inferior parietal lobule (BA 40) | R | 60, −39, 50 | −7.24 |
| Lingual gyrus (BA 19) | R | 18, −67, −6 | −5.93 |
| R | 11, −46, −6 | −5.42 | |
| Lingual gyrus (BA 30) | R | 18, −39, 1 | −5.42 |
| Middle frontal gyrus (BA 6) | L | −31, −4, 57 | −5.53 |
| L | −31, −4, 50 | −5.53 | |
| L | −24, −4, 50 | −5.53 | |
| Middle occipital gyrus (BA 19) | L | −38, −81, 15 | −5.42 |
| Middle temporal gyrus (BA 21) | R | 60, −53, 1 | −6.1 |
| Parahippocampal gyrus (BA 19) | R | 18, −46, −6 | −5.42 |
| Parahippocampal gyrus (BA 30) | R | 18, −39, −6 | −5.42 |
| Parahippocampal gyrus (BA 37) | R | 32, −39, −6 | −5.48 |
| Postcentral gyrus (BA 40) | R | 46, −32, 50 | −7.24 |
| Postcentral gyrus (BA 40) | L | −38, −32, 57 | −6.67 |
| Posterior cingulate (BA 23) | R | 4, −53, 15 | −5.65 |
| Precentral gyrus (BA 6) | L | −31, −11, 57 | −5.53 |
| Sub‐Gyral (BA 6) | L | −24, 3, 50 | −5.53 |
| Superior parietal lobule (BA 7) | L | −31, −60, 43 | −7.07 |
| Superior temporal gyrus | R | 46, −32, 15 | −5.65 |
| Superior temporal gyrus (BA 22) | L | −52, −11, −6 | −5.65 |
| Superior temporal gyrus (BA 42) | R | 60, −32, 8 | −5.82 |
ERP, event‐related potential.
Feedback component
Figure 2B (upper part) shows the topography of the feedback‐related component for all force levels and groups. The lower right panel shows the spatial origin of the difference (t value > 5; corrected P < 0.01) between children and adults at the highest force level. The differences were located primarily in parietal and occipital visual regions, but also in the posterior cingulate (see also Table II). For latencies, a significant group difference was found (F(2,48) = 3.814, P < 0.05), with post‐hoc t tests, revealing that this difference was due to prolonged latencies in children, while adults and adolescents did not show a group difference. Concerning amplitudes, significant general as well as force control–specific group differences were found (main effect group: F(2,48) = 18.349, P < 0.001; group by force interaction: F(2,48) = 3.814, P < 0.05). Post‐hoc tests indicated that amplitudes were generally higher in both children (P < 0.001) and adolescents (P = 0.001) compared with adults. The interaction mainly contrasted adults vs. children, as children showed significant positive amplitude modulation within the higher force levels (high vs. medium and high vs. low), while adults showed decreasing amplitudes with increasing force levels (high vs. medium and high vs. low).
fMRI
Main effects of handgrip
The network activated (disregarding age and force level) included the expected regions, such as M1, S1, cerebellum, SMA, basalganglia, a large cluster in visual occipital areas, as well as parietal areas (superior parietal lobule, precuneus). We also detected a sizeable network consistently downregulated with the task, which, in addition to a large cluster in the posterior cingulate, included parietal areas as well as ipsilateral M1/S1, and bilateral superior temporal gyri. Figure 3 shows activated (red) and deactivated (green) regions of the second‐level analysis, including all participants (FWE, P < 0.05, cluster size ke ≥ 20). A complete listing of activated and deactivated clusters is given in Table III.
Figure 3.
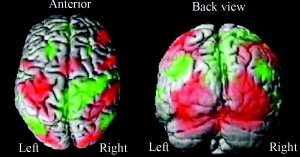
Main effects of handgrip in fMRI. Activated areas are shown in red, deactivated areas in green. FWE correction, P < 0.05, ke ≥ 20. See also corresponding Table III.
Table III.
Location of brain regions activated (positive BOLD) and deactivated (negative BOLD) disregarding age (FWE, P < 0.05)
| Anatomical region (cytoarchitectural area) | Hemisphere | Talairach coordinates: x, y, z | t | Z |
|---|---|---|---|---|
| Activation (positive BOLD) | ||||
| Brainstem (red nucleus) | L | −6, −24, −11 | 7.93 | 6.31 |
| Cerebellum | R | 21, −50, −18 | 18.91 | >7.84 |
| Cerebellum (declive) | L | −33, −68, −17 | 15.61 | >7.84 |
| L | −30, −71, −19 | 15.59 | >7.84 | |
| R | 30, −65, −17 | 15.53 | >7.84 | |
| Cerebellum (culmen) | L | −33, −60, −25 | 14.58 | >7.84 |
| Cerebellum (pyramis) | R | 6, −68, −24 | 9.12 | 6.92 |
| Cerebellum (nodule) | L | −3, −54, −25 | 7.14 | 5.87 |
| Cingulate gyrus (BA 32) | L | −9, 14, 38 | 8.45 | 6.58 |
| Claustrum | L | −27, 18, 5 | 9.54 | 7.11 |
| R | 30, 18, 7 | 6.71 | 5.61 | |
| Cuneus (BA 18) | R | 15, −98, 13 | 9.09 | 6.9 |
| L | −15, −99, 10 | 8.69 | 6.71 | |
| Inferior frontal gyrus (BA 9) | L | −50, 4, 27 | 10.24 | 7.42 |
| L | −56, 7, 27 | 10.14 | 7.38 | |
| R | 50, 7, 30 | 9.78 | 7.22 | |
| Inferior frontal gyrus (BA 44) | L | −59, 9, 13 | 6.5 | 5.48 |
| Inferior frontal gyrus (BA 45) | R | 27, 29, 4 | 5.7 | 4.96 |
| Inferior occipital gyrus (BA 18) | L | −33, −79, −4 | 14.35 | >7.84 |
| R | 33, −82, −6 | 14.35 | >7.84 | |
| Inferior parietal lobule (BA 40) | R | 48, −36, 46 | 12.88 | >7.84 |
| Inferior parietal lobule (BA 40) | L | −53, −22, 23 | 7.24 | 5.92 |
| Insula (BA 13) | L | −39, −2, 19 | 8.37 | 6.54 |
| R | 42, 3, 3 | 6.58 | 5.53 | |
| Left brainstem | L | −3, −39, −13 | 6.28 | 5.34 |
| Lentiform nucleus (putamen) | L | −21, −5, 9 | 9.12 | 6.92 |
| R | 21, 15, 5 | 7.06 | 5.82 | |
| R | 15, 9, −3 | 8 | 6.34 | |
| Lentiform nucleus (lateral globus pallidus) | R | 18, 0, 0 | 7.94 | 6.31 |
| Lentiform nucleus (lateral globus pallidus) | R | 18, −5, 9 | 5.98 | 5.15 |
| Medial frontal gyrus (BA 6) | L | −6, 3, 52 | 10.58 | 7.56 |
| Middle frontal gyrus (BA 46) | R | 50, 44, 6 | 8.02 | 6.35 |
| R | 42, 39, 26 | 7.77 | 6.22 | |
| Middle occipital gyrus (BA 18) | R | 42, −76, −9 | 14.26 | >7.84 |
| Middle occipital gyrus (BA 19) | R | 36, −84, 12 | 13.16 | >7.84 |
| L | −27, −87, 7 | 12.32 | >7.84 | |
| R | 30, −78, 23 | 11.42 | >7.84 | |
| L | −45, −73, 4 | 11.31 | 7.84 | |
| R | 39, −70, 3 | 10.22 | 7.41 | |
| R | 48, −79, 1 | 10.2 | 7.4 | |
| Posterior cingulate (BA 30) | L | −30, −75, 12 | 11.92 | >7.84 |
| Precentral gyrus (BA 4) | L | −36, −21, 54 | 15.63 | >7.84 |
| L | −36, −20, 62 | 15.25 | >7.84 | |
| Precuneus (BA 7) | L | −30, −50, 49 | 9.57 | 7.12 |
| Right brainstem | R | 6, −36, −16 | 6.67 | 5.59 |
| Superior frontal gyrus (BA 6) | R | 9, 6, 63 | 8.13 | 6.41 |
| R | 12, 9, 60 | 8.07 | 6.38 | |
| Superior parietal lobule (BA 7) | R | 30, −53, 47 | 12.76 | >7.84 |
| R | 33, −50, 49 | 12.61 | >7.84 | |
| Supramarginal gyrus (BA 40) | L | −42, −27, 43 | 12.75 | >7.84 |
| Thalamus (ventral posterior lateral nucleus) | L | −15, −17, 9 | 8.66 | 6.69 |
| Deactivation (negative BOLD) | ||||
| Angular gyrus (BA 39) | R | 50, −66, 28 | 9.67 | 7.17 |
| Anterior cingulate (BA 24) | R | 3, 29, 7 | 7.34 | 5.98 |
| Cingulate gyrus (BA 31) | L | −3, −45, 41 | 12.13 | >7.83 |
| R | 12, −54, 28 | 12.06 | >7.83 | |
| Fusiform gyrus (BA 37) | L | −30, −36, −11 | 7.15 | 5.87 |
| Inferior temporal gyrus (BA 20) | R | 56, −7, −20 | 8.38 | 6.55 |
| Insula (BA 13) | R | 42, −14, 15 | 10.89 | 7.68 |
| Medial frontal gyrus (BA 10) | R | 3, 49, −5 | 10.47 | 7.52 |
| Middle frontal gyrus (BA 8) | R | 27, 25, 43 | 7.74 | 6.21 |
| Middle temporal gyrus (BA 21) | L | −53, −12, −15 | 9.29 | 7 |
| R | 39, 7, −33 | 6.25 | 5.32 | |
| Parahippocampal gyrus (hippocampus) | L | −27, −18, −17 | 7.56 | 6.11 |
| R | 27, −18, −19 | 6.1 | 5.22 | |
| Precentral gyrus (BA 4) | R | 39, −23, 62 | 10.46 | 7.51 |
| Precentral gyrus (BA 6) | L | −45, −13, 31 | 7.06 | 5.82 |
| Precuneus (BA 19) | L | −36, −80, 40 | 11.3 | 7.83 |
| Superior frontal gyrus (BA 9) | L | −9, 54, 25 | 5.83 | 5.04 |
| Superior frontal gyrus (BA 8) | L | −24, 23, 49 | 8.73 | 6.72 |
| Superior temporal gyrus (BA 39) | L | −59, −57, 28 | 6.46 | 5.45 |
| Superior temporal gyrus (BA 22) | R | 48, −15, 1 | 9.98 | 7.31 |
| L | −48, −32, 7 | 6.86 | 5.7 | |
| L | −65, −40, 10 | 6.69 | 5.6 | |
| Uncus (BA 28) | L | −27, −10, −25 | 6.11 | 5.23 |
BOLD, blood oxygenation level‐dependent; FWE, family‐wise error.
Linear correlation between BOLD signal and force
Figure 4 shows regions in which activity was enhanced with increasing force disregarding age (see also Table IV). Those included the contralateral sensorimotor cortex and SMA, the ipsilateral cerebellum, as well as several visual occipital regions. No negative effects were detected.
Figure 4.
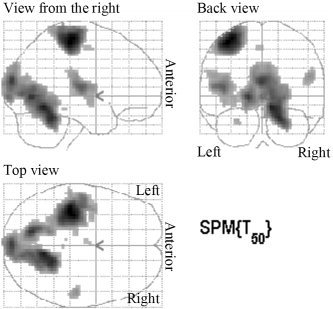
Linear correlation between BOLD signal and force for all subjects (FWE correction, P < 0.05, ke ≥ 0). See also corresponding Table IV.
Table IV.
Location of brain regions in which increasing BOLD signal was linearly correlated to peak force of hand grip (disregarding age; FWE, P < 0.05)
| Anatomical region (cytoarchitectural area) | Hemisphere | Talairach coordinates: x, y, z | T | Z |
|---|---|---|---|---|
| Cerebellum (culmen) | L | −27, −51, −20 | 6.06 | 5.23 |
| R | 18, −48, −18 | 10.53 | 7.6 | |
| Cuneus (BA 18) | L | 0, −93, 5 | 7.95 | 6.36 |
| L | 0, −89, 18 | 9.61 | 7.2 | |
| Inferior parietal lobule (BA 40) | L | −50, −25, 21 | 5.29 | 5.37 |
| Insula (BA 13) | L | −42, −6, −5 | 6.04 | 5.21 |
| R | 50, −19, 20 | 6.79 | 5.69 | |
| L | −42, −14, 9 | 8.56 | 6.68 | |
| Lentiform nucleus (putamen) | L | −30, −3, −5 | 6.06 | 5.22 |
| Lingual gyrus (BA 18) | R | 12, −78, 7 | 8.53 | 6.67 |
| R | 9, −70, 6 | 8.64 | 6.73 | |
| R | 12, −67, 1 | 8.75 | 6.78 | |
| L | −15, −70, 1 | 9.99 | 7.37 | |
| Lingual gyrus (BA 19) | L | −15, −50, −3 | 7.38 | 6.04 |
| R | 9, −56, −7 | 10.99 | 7.78 | |
| Medial Frontal gyrus (BA 6) | L | −6, −9, 50 | 5.51 | 4.85 |
| Postcentral gyrus (BA 3), including Precentral gyrus (BA 4) | L | −39, −24, 54 | 11.96 | >7.78 |
BOLD, blood oxygenation level‐dependent; FWE, family‐wise error.
General developmental findings
To identify general age‐related changes, we conducted a correlation analysis between individual main effects of handgrip and age (log transformed). No positive effects were found. Instead, a significant negative correlation with age was revealed (see Fig. 5A and corresponding Table V). This could indicate either decreased activation (decreased positive BOLD effect) or increased deactivation (increased negative BOLD effect) with age. Masking with the generally deactivated network revealed the same results, indicating that the ability to deactivate this network is enhanced with age.
Figure 5.
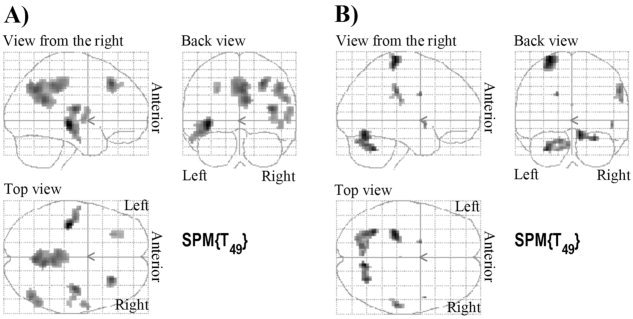
Age differences in fMRI. A: General age differences. B: Force‐specific age differences. FDR correction, P < 0.01, ke ≥ 0. See also corresponding Table V.
Table V.
Location of brain regions with general as well as force specific developmental fMRI effects (FDR, P < 0.01)
| Anatomical region (cytoarchitectural area) | Hemisphere | Talairach coordinates: x, y, z | t | Z |
|---|---|---|---|---|
| General age‐related differences | ||||
| Cingulate gyrus (BA 31) | R | 6, −39, 41 | 5.03 | 4.49 |
| Inferior parietal lobule (BA 39) | R | 48, −65, 39 | 4.91 | 4.41 |
| Inferior temporal gyrus (BA 20) | L | −59, −10, −20 | 4.41 | 4.03 |
| Insula (BA 13) | R | 39, −14, 12 | 5.3 | 4.69 |
| R | 39, −20, 4 | 4.28 | 3.93 | |
| Insula (BA 22) | L | −39, −24, −4 | 6.2 | 5.3 |
| Middle frontal gyrus (BA 8) | R | 27, 28, 40 | 5.31 | 4.7 |
| Middle frontal gyrus (BA 9) | L | −27, 31, 32 | 4.35 | 3.98 |
| L | −27, 40, 37 | 4.08 | 3.77 | |
| Middle temporal gyrus (BA 21) | L | −48, −15, −12 | 4.86 | 4.37 |
| Posterior cingulate (BA 23) | R | 6, −48, 25 | 5.16 | 4.59 |
| Precentral gyrus (BA 6) | R | 59, 1, 11 | 4.46 | 4.07 |
| Precuneus (BA 7) | R | 3, −59, 36 | 5.25 | 4.65 |
| Superior temporal gyrus (BA 22) | R | 56, −3, 3 | 4.46 | 4.07 |
| R | 48, −18, −2 | 4.24 | 3.9 | |
| Superior temporal gyrus (BA 39) | R | 53, −57, 28 | 4.65 | 4.21 |
| Force‐specific age‐related differences | ||||
| Cerebellum (anterior lobe) | L | −30, −57, −27 | 5.14 | 4.58 |
| Cerebellum (declive) | R | 9, −65, −12 | 5.29 | 4.68 |
| R | 27, −65, −17 | 5.03 | 4.49 | |
| L | −27, −65, −22 | 4.86 | 4.37 | |
| L | −15, −71, −17 | 4.79 | 4.32 | |
| Inferior parietal lobule (BA 40) | R | 56, −28, 32 | 4.81 | 4.33 |
| R | 59, −22, 23 | 4.57 | 4.15 | |
| R | 50, −31, 26 | 4.26 | 3.91 | |
| Precentral gyrus (BA 4) | L | −27, −26, 68 | 5.35 | 4.72 |
| Thalamus | L | 0, −22, 18 | 4.27 | 3.92 |
| Superior temporal gyrus (BA 22) | R | 48, 6, −5 | 4.64 | 4.21 |
FDR, false discovery rate.
Force modulation‐specific developmental findings
Correlation between age (log transformed) and the individual parametric contrasts identified bilateral cerebellum as well as a region in contralateral M1 and in the right inferior parietal lobule, contralateral thalamus, and right superior temporal gyrus. These significant clusters (Fig. 5B; Table V) were subsequently defined as ROIs and individual values for each force level were extracted to visualize the group differences in force modulation (Fig. 6). In almost all these regions, force modulation was present in children and adolescents but absent in adults. This general observation was tested using MANOVA (six ROIs, three force levels) for each group separately. While children (F(2,15) = 45.665, P < 0.001) and adolescents (F(2,15) = 13.342, P < 0.001) exhibited significant main effects of force, this effect was absent in adults.
Figure 6.
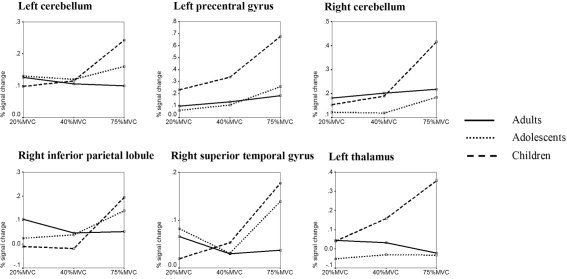
Percent signal change in ROIs with force‐specific maturation in fMRI for all age groups separately.
DISCUSSION
Network Involved in Hand Movement With Visual Feedback
Our developmental study largely replicates previous findings concerning the fMRI‐derived spatial network involved in adult hand movement control under visual feedback [Binkofski et al.,1998; Ward and Frackowiak,2003]. In addition, the ERP‐derived temporal sequence of activations within this network closely resembles the one previously described for adults performing the task at constant force [Halder et al.,2005]. As expected, contralateral M1 and S1, ipsilateral cerebellum, SMA, and other premotor regions as well as parietal regions were activated. In addition, large activation was seen in visual areas.
We found that this activated network was spatially stable over the developmental age range studied. In addition, we detected several areas that showed strong deactivation (negative BOLD effects compared to the baseline condition). Those include ipsilateral M1, the posterior cingulate, parietal (precuneus), and also temporal regions. While such deactivation of the ipsilateral M1 is thought to represent interhemispheric inhibition through the corpus callosum [Allison et al.,2000; Hamzei et al.,2002], it remains unclear whether deactivation can generally be considered an inhibitory process. Instead, this deactivation may reflect a default mode of brain function that has recently been characterized [Fransson,2005; Greicius et al.,2003; Greicius and Menon,2004; Laurienti,2004; Raichle et al.,2001]. It has been suggested that this default network, which resembles the deactivation observed here, is downregulated during specific goal‐directed behaviors. This interpretation of deactivation during our task is of particular interest, as it closely resembles the network found to show late unspecific maturation (see below).
Effects of Force
All investigated behavioral parameters proved responsive to force modulation. As expected, higher force was generally coupled with increased slopes of the force trajectory. In addition, we found a robust pattern of systematic reaction time changes with force levels in all age groups characterized by an inverse relationship between amount of force and reaction time. This most probably reflects the increased demands on movement preparation at lower forces, as these require a more controlled or skilled movement. Electrophysiologically, we replicated the expected force modulation at the peak of the movement‐related cortical potential [Siemionow et al.,2000; Slobounov and Ray,1998]. This effect was stable over the investigated age range. No latency differences could be detected. These findings are thus in agreement with the proposed early maturation of primary motor cortex. Correspondingly, fMRI revealed force modulation in most of the expected areas when age was disregarded. These included contralateral primary sensorimotor cortex, ipsilateral cerebellum, SMA, as well as several regions in the visual cortex (for regions exhibiting differential force modulation with age, see below).
General Developmental Findings
Typical general (i.e., not force control‐specific) developmental changes were observed in our data. Decreasing reaction times with ongoing development have repeatedly been reported across numerous studies, tasks, and methods. Furthermore, children had shallower slopes (both increasing and decreasing) to their force trajectories than adults and adolescents, which is in agreement with earlier reports on the maturation of hand force control under visual feedback [Smits‐Engelsman et al.,2003].
No positive correlation with age was found in fMRI, suggesting that no area was more active in the adult subjects compared to the younger age groups. This is in line with the general ERP differences. In this respect, the fMRI analysis indicated an early maturation of the spatial extent of this activated network. This contrasts with other developmental findings in the motor system, where enhanced activity in primary motor cortices with age has been reported in a bimanual sequential finger tapping task [Schapiro et al.,2004]. A possible explanation for these contrasting findings might be the differences in the tasks used. Whereas power grip is thought to be a phylogenetically old function, coordinated sequential finger tapping skills might undergo specific development and further improvement with exposure after reading age to precision devices such as computers. Another possible explanation is the lack of controlling variables predictive of M1 activity, such as force and rate of force deployment. The confounding effects of interhemispheric inhibition in the bimanual task might also contribute. In the present study, neither ERP nor fMRI indicated any further general maturation in contralateral primary motor hand area.
In contrast, the network deactivated by the task was negatively correlated with age, exhibiting a general developmental difference. This network closely resembles the so‐called “default network” [Raichle et al.,2001], which was shown to be active at rest and downregulated during goal‐directed behavior. In addition, it has been suggested that the ability to deactivate this network is lost in Alzheimer's disease [Greicius et al.,2004], and that the default network is linked to the ability of memory encoding [Daselaar et al.,2004]. While adults showed a robust deactivation, the deactivation in the younger age groups was less pronounced or absent. We speculate that the lack of deactivation in the developmental groups might be responsible for their generally enhanced ERP amplitudes, although enhanced baseline activity (representing noise) likely contributes somewhat to the amplitude differences. Such enhanced noise, however, cannot explain the whole extent of amplitude differences observed during the ERP segment (Fig. 7, upper part). The LORETA analysis over the whole time segment further supports the idea that the lack of deactivation in children observed in the fMRI data is visible as additional ERP activity. The most consistent differences over the ERP segment were found in voxels of the (posterior) cingulate, bilateral middle frontal gyri, as well as parietal areas, in line with the fMRI results of reduced deactivation in children in these regions (Fig. 7).
Figure 7.
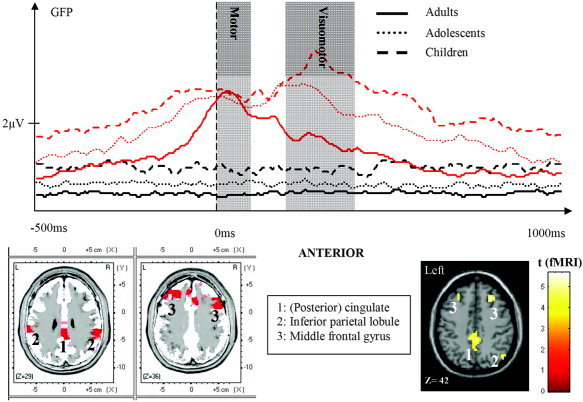
Upper part: global field power curves of ERP reflecting baseline (black lines) and task‐related activity (red lines) of the three age groups. Motor component (0–100 ms) and feedback component (200–400 ms) are shaded. Note the increased activity in children and adolescents compared to adults throughout the trial except for the motor component. Lower part: general age‐related differences between children and adults; selected regions are shown with LORETA (left) as well as fMRI (right). These include (posterior) cingulate (1), inferior parietal lobule (2), and middle frontal gyrus (3). Note the correspondence of localization between the methods.
It is worth noting that the motor component within the ERP segment did not show decreasing amplitudes with age (Fig. 7). It could be argued that children showed shallower slopes in their force trajectories, which has been shown to reduce movement‐related ERP peak amplitude. Alternatively, the inability to deactivate the previously described default network might lead to cancellation of electric fields, thus reducing GFP amplitudes. The topographies of the motor‐related component (Fig. 2A) would favor such a scenario, as the posterior positivity (probably coming from posterior cingulate) seems indeed to partially cancel the contralateral frontocentral negativity.
Maturation of Force Control Under Visual Feedback Condition
In addition to general maturation of the network involved in hand movement control under visual feedback, we could also identify developmental differences specific to force modulation. Reaction time differences between the age groups depended in part on the force level. The decrease of reaction times was most pronounced at the lowest and probably most demanding force level. Electrophysiologically, we detected force modulation‐specific maturation effects as well. The feedback‐related component showed much higher amplitude differences between the groups compared to the rest of the segment. For this component, the additional activity appeared to be due to activity in middle occipital gyrus and parietal areas, as shown by the LORETA localization. This is in line with the hypothesis of enhanced use of visual feedback in children [Konczak et al.,2003; Smits‐Engelsman et al.,2003], and with their slower force release, which might point to the need for concurrent visual feedback monitoring. As higher forces were accompanied by stronger contrast changes during visual feedback, we expected this component to modulate with force as well. However, while children showed this expected modulation in the ERP data, the adults showed reduced amplitudes with increasing force. This pattern in adults is unexpected, as reduced attention to visual feedback should lead to more similar, but not to decreasing feedback‐related amplitudes across increasing force levels. It could be speculated that this amplitude reduction indicates a change from feedback‐based strategy at lower and more demanding force levels to internal model‐based movement control at higher force levels. This would be in agreement with previous electromyographic studies suggesting that forces above 50% MVC are controlled differently than forces below this level [Huesler et al.,2000; Suzuki et al.,1994]. Interestingly, a recent study using the same task at constant force showed large training/repetition effects in this component, which were interpreted as decreased need for visual feedback with movement repetition [Halder et al.,2005]. No difference in force modulation was found in occipital areas in fMRI. This most probably reflects the poor time resolution in fMRI, as the same visual area is expected to be involved in target processing. Some clusters with group‐specific force modulation differences were located at the edge of the core motor regions in the case of contralateral M1 and ipsilateral cerebellum with their prominent force modulation in all three groups. This might indicate further force modulation‐specific focalization with age in these regions. However, most of the investigated clusters showed positive modulation with force in children and partly adolescents, but no force modulation was seen in adults. These clusters thus show similar developmental changes as detected in the ERP feedback component, thereby suggesting a role in feedback processing. In addition, some of these clusters, such as the bilateral cerebellum and the inferior parietal lobule, are involved in visuomotor transformation [Vaillancourt et al.,2003]. However, no significant correlation was found, indicating that the relationship between this component and fMRI‐derived ROIs is not simply linear or involves a combination of different, simultaneously activated ROIs. In addition, the ROIs might not be selectively active during the feedback processing step.
CONCLUSIONS
The network activated in hand movement and force control under visual feedback appears largely stable in its spatial extent over the ages 9–28. Interestingly, the most prominent general developmental difference was found for the ability to deactivate a different “default” network independent of the force level applied. We suggest that this late maturational effect corresponds to the almost generally enhanced ERP amplitudes at younger ages. More specific developmental differences in the control of force modulation were shown to be related mostly to feedback processing and less to motor core regions.
REFERENCES
- Allison JD, Meador KJ, Loring DW, Figueroa RE, Wright JC (2000): Functional MRI cerebral activation and deactivation during finger movement. Neurology 54: 135–142. [DOI] [PubMed] [Google Scholar]
- Andersson JL, Hutton C, Ashburner J, Turner R, Friston K (2001): Modeling geometric deformations in EPI time series. Neuroimage 13: 903–919. [DOI] [PubMed] [Google Scholar]
- Anner‐Baratti R, Allum JH, Hepp‐Reymond MC (1986): Neural correlates of isometric force in the “motor” thalamus. Exp Brain Res 63: 567–580. [DOI] [PubMed] [Google Scholar]
- Binkofski F, Dohle C, Posse S, Stephan KM, Hefter H, Seitz RJ, Freund HJ (1998): Human anterior intraparietal area subserves prehension: a combined lesion and functional MRI activation study. Neurology 50: 1253–1259. [DOI] [PubMed] [Google Scholar]
- Blank R, Heizer W, von Voss H (1999): Externally guided control of static grip forces by visual feedback‐age and task effects in 3‐6‐year old children and in adults. Neurosci Lett 271: 41–44. [DOI] [PubMed] [Google Scholar]
- Brandeis D, Naylor H, Halliday R, Callaway E, Yano L (1992): Scopolamine effects on visual information processing, attention, and event‐related potential map latencies. Psychophysiology 29: 315–336. [DOI] [PubMed] [Google Scholar]
- Brem S, Lang‐Dullenkopf A, Maurer U, Halder P, Bucher K, Brandeis D (2005): Neurophysiological signs of rapidly emerging visual expertise for symbol strings. Neuroreport 16: 45–48. [DOI] [PubMed] [Google Scholar]
- Brett M, Anton J, Valabregue R, Poline J (2002): Region of interest analysis using an SPM toolbox. Abstr Hum Brain Mapp Sendai, Japan. [Google Scholar]
- Casey BJ, Tottenham N, Liston C, Durston S (2005): Imaging the developing brain: what have we learned about cognitive development? Trends Cogn Sci 9: 104–110. [DOI] [PubMed] [Google Scholar]
- Cramer SC, Weisskoff RM, Schaechter JD, Nelles G, Foley M, Finklestein SP, Rosen BR (2002): Motor cortex activation is related to force of squeezing. Hum Brain Mapp 16: 197–205. [DOI] [PMC free article] [PubMed] [Google Scholar]
- Dai TH, Liu JZ, Sahgal V, Brown RW, Yue GH (2001): Relationship between muscle output and functional MRI‐measured brain activation. Exp Brain Res 140: 290–300. [DOI] [PubMed] [Google Scholar]
- Daselaar SM, Prince SE, Cabeza R (2004): When less means more: deactivations during encoding that predict subsequent memory. Neuroimage 23: 921–927. [DOI] [PubMed] [Google Scholar]
- Dettmers C, Fink GR, Lemon RN, Stephan KM, Passingham RE, Silbersweig D, Holmes A, Ridding MC, Brooks DJ, Frackowiak RS (1995): Relation between cerebral activity and force in the motor areas of the human brain. J Neurophysiol 74: 802–815. [DOI] [PubMed] [Google Scholar]
- Deutsch KM, Newell KM (2001): Age differences in noise and variability of isometric force production. J Exp Child Psychol 80: 392–408. [DOI] [PubMed] [Google Scholar]
- Ehrsson HH, Fagergren A, Jonsson T, Westling G, Johansson RS, Forssberg H (2000): Cortical activity in precision‐ versus power‐grip tasks: an fMRI study. J Neurophysiol 83: 528–536. [DOI] [PubMed] [Google Scholar]
- Evarts EV (1968): Relation of pyramidal tract activity to force exerted during voluntary movement. J Neurophysiol 31: 14–27. [DOI] [PubMed] [Google Scholar]
- Eyre JA, Miller S, Ramesh V (1991): Constancy of central conduction delays during development in man: investigation of motor and somatosensory pathways. J Physiol 434: 441–452. [DOI] [PMC free article] [PubMed] [Google Scholar]
- Ferree TC, Luu P, Russell GS, Tucker DM (2001): Scalp electrode impedance, infection risk, and EEG data quality. Clin Neurophysiol 112: 536–544. [DOI] [PubMed] [Google Scholar]
- Fransson P (2005): Spontaneous low‐frequency BOLD signal fluctuations: an fMRI investigation of the resting‐state default mode of brain function hypothesis. Hum Brain Mapp 26: 15–29. [DOI] [PMC free article] [PubMed] [Google Scholar]
- Giedd JN, Blumenthal J, Jeffries NO, Castellanos FX, Liu H, Zijdenbos A, Paus T, Evans AC, Rapoport JL (1999): Brain development during childhood and adolescence: a longitudinal MRI study. Nat Neurosci 2: 861–863. [DOI] [PubMed] [Google Scholar]
- Gogtay N, Giedd JN, Lusk L, Hayashi KM, Greenstein D, Vaituzis AC, Nugent TF 3rd, Herman DH, Clasen LS, Toga AW, Rappaport JL, Thompson PM (2004): Dynamic mapping of human cortical development during childhood through early adulthood. Proc Natl Acad Sci U S A 101: 8174–8179. [DOI] [PMC free article] [PubMed] [Google Scholar]
- Gottselig JM, Brandeis D, Hofer‐Tinguely G, Borbely AA, Achermann P (2004): Human central auditory plasticity associated with tone sequence learning. Learn Mem 11: 162–171. [DOI] [PMC free article] [PubMed] [Google Scholar]
- Greicius MD, Menon V (2004): Default‐mode activity during a passive sensory task: uncoupled from deactivation but impacting activation. J Cogn Neurosci 16: 1484–1492. [DOI] [PubMed] [Google Scholar]
- Greicius MD, Krasnow B, Reiss AL, Menon V (2003): Functional connectivity in the resting brain: a network analysis of the default mode hypothesis. Proc Natl Acad Sci U S A 100: 253–258. [DOI] [PMC free article] [PubMed] [Google Scholar]
- Greicius MD, Srivastava G, Reiss AL, Menon V (2004): Default‐mode network activity distinguishes Alzheimer's disease from healthy aging: evidence from functional MRI. Proc Natl Acad Sci U S A 101: 4637–4642. [DOI] [PMC free article] [PubMed] [Google Scholar]
- Halder P, Sterr A, Brem S, Bucher K, Kollias S, Brandeis D (2005): Electrophysiological evidence for cortical plasticity with movement repetition. Eur J Neurosci 21: 2271–2277. [DOI] [PubMed] [Google Scholar]
- Hamzei F, Dettmers C, Rzanny R, Liepert J, Buchel C, Weiller C (2002): Reduction of excitability (“inhibition”) in the ipsilateral primary motor cortex is mirrored by fMRI signal decreases. Neuroimage 17: 490–496. [DOI] [PubMed] [Google Scholar]
- Hepp‐Reymond MC, Wyss UR, Anner R (1978): Neuronal coding of static force in the primate motor cortex. J Physiol (Paris) 74: 287–291. [PubMed] [Google Scholar]
- Huesler EJ, Maier MA, Hepp‐Reymond MC (2000): EMG activation patterns during force production in precision grip. III. Synchronisation of single motor units. Exp Brain Res 134: 441–455. [DOI] [PubMed] [Google Scholar]
- Jung TP, Makeig S, Westerfield M, Townsend J, Courchesne E, Sejnowski TJ (2000): Removal of eye activity artifacts from visual event‐related potentials in normal and clinical subjects. Clin Neurophysiol 111: 1745–1758. [DOI] [PubMed] [Google Scholar]
- Koh TH, Eyre JA (1988): Maturation of corticospinal tracts assessed by electromagnetic stimulation of the motor cortex. Arch Dis Child 63: 1347–1352. [DOI] [PMC free article] [PubMed] [Google Scholar]
- Kollias SS, Alkadhi H, Jaermann T, Crelier G, Hepp‐Reymond MC (2001): Identification of multiple nonprimary motor cortical areas with simple movements. Brain Res Brain Res Rev 36: 185–195. [DOI] [PubMed] [Google Scholar]
- Konczak J, Jansen‐Osmann P, Kalveram KT (2003): Development of force adaptation during childhood. J Mot Behav 35: 41–52. [DOI] [PubMed] [Google Scholar]
- Laurienti PJ (2004): Deactivations, global signal, and the default mode of brain function. J Cogn Neurosci 16: 1481–1483. [DOI] [PubMed] [Google Scholar]
- Lehmann D, Skrandies W (1980): Reference‐free identification of components of checkerboard‐evoked multichannel potential fields. Electroencephalogr Clin Neurophysiol 48: 609–621. [DOI] [PubMed] [Google Scholar]
- Mechelli A, Henson RN, Price CJ, Friston KJ (2003): Comparing event‐related and epoch analysis in blocked design fMRI. Neuroimage 18: 806–810. [DOI] [PubMed] [Google Scholar]
- Muller K, Homberg V (1992): Development of speed of repetitive movements in children is determined by structural changes in corticospinal efferents. Neurosci Lett 144: 57–60. [DOI] [PubMed] [Google Scholar]
- Muller K, Homberg V, Lenard HG (1991): Magnetic stimulation of motor cortex and nerve roots in children. Maturation of cortico‐motoneuronal projections. Electroencephalogr Clin Neurophysiol 81: 63–70. [DOI] [PubMed] [Google Scholar]
- Muller K, Kass‐Iliyya F, Reitz M (1997): Ontogeny of ipsilateral corticospinal projections: a developmental study with transcranial magnetic stimulation. Ann Neurol 42: 705–711. [DOI] [PubMed] [Google Scholar]
- Napier JR (1956): The prehensile movements of the human hand. J Bone Joint Surg Br 38‐B: 902–913. [DOI] [PubMed] [Google Scholar]
- Nezu A, Kimura S, Uehara S, Kobayashi T, Tanaka M, Saito K (1997): Magnetic stimulation of motor cortex in children: maturity of corticospinal pathway and problem of clinical application. Brain Dev 19: 176–180. [DOI] [PubMed] [Google Scholar]
- Nichols TE, Holmes AP (2002): Nonparametric permutation tests for functional neuroimaging: a primer with examples. Hum Brain Mapp 15: 1–25. [DOI] [PMC free article] [PubMed] [Google Scholar]
- Oldfield RC (1971): The assessment and analysis of handedness: the Edinburgh inventory. Neuropsychologia 9: 97–113. [DOI] [PubMed] [Google Scholar]
- Pascual‐Marqui RD, Michel CM, Lehmann D (1994): Low resolution electromagnetic tomography: a new method for localizing electrical activity in the brain. Int J Psychophysiol 18: 49–65. [DOI] [PubMed] [Google Scholar]
- Pascual‐Marqui RD, Lehmann D, Koenig T, Kochi K, Merlo MC, Hell D, Koukkou M (1999): Low resolution brain electromagnetic tomography (LORETA) functional imaging in acute, neuroleptic‐naive, first‐episode, productive schizophrenia. Psychiatry Res 90: 169–179. [DOI] [PubMed] [Google Scholar]
- Paus T, Zijdenbos A, Worsley K, Collins DL, Blumenthal J, Giedd JN, Rapoport JL, Evans AC (1999): Structural maturation of neural pathways in children and adolescents: in vivo study. Science 283: 1908–1911. [DOI] [PubMed] [Google Scholar]
- Peck KK, Sunderland A, Peters AM, Butterworth S, Clark P, Gowland PA (2001): Cerebral activation during a simple force production task: changes in the time course of the haemodynamic response. Neuroreport 12: 2813–2816. [DOI] [PubMed] [Google Scholar]
- Pfefferbaum A, Mathalon DH, Sullivan EV, Rawles JM, Zipursky RB, Lim KO (1994): A quantitative magnetic resonance imaging study of changes in brain morphology from infancy to late adulthood. Arch Neurol 51: 874–887. [DOI] [PubMed] [Google Scholar]
- Raichle ME, MacLeod AM, Snyder AZ, Powers WJ, Gusnard DA, Shulman GL (2001): A default mode of brain function. Proc Natl Acad Sci U S A 98: 676–682. [DOI] [PMC free article] [PubMed] [Google Scholar]
- Schapiro MB, Schmithorst VJ, Wilke M, Byars AW, Strawsburg RH, Holland SK (2004): BOLD fMRI signal increases with age in selected brain regions in children. Neuroreport 15: 2575–2578. [DOI] [PMC free article] [PubMed] [Google Scholar]
- Siemionow V, Yue GH, Ranganathan VK, Liu JZ, Sahgal V (2000): Relationship between motor activity‐related cortical potential and voluntary muscle activation. Exp Brain Res 133: 303–311. [DOI] [PubMed] [Google Scholar]
- Slobounov SM, Ray WJ (1998): Movement‐related potentials with reference to isometric force output in discrete and repetitive tasks. Exp Brain Res 123: 461–473. [DOI] [PubMed] [Google Scholar]
- Slobounov S, Johnston J, Chiang H, Ray W (2002): Movement‐related EEG potentials are force or end‐effector dependent: evidence from a multi‐finger experiment. Clin Neurophysiol 113: 1125–1135. [DOI] [PubMed] [Google Scholar]
- Smith AM, Hepp‐Reymond MC, Wyss UR (1975): Relation of activity in precentral cortical neurons to force and rate of force change during isometric contractions of finger muscles. Exp Brain Res 23: 315–332. [DOI] [PubMed] [Google Scholar]
- Smits‐Engelsman BC, Westenberg Y, Duysens J (2003): Development of isometric force and force control in children. Brain Res Cogn Brain Res 17: 68–74. [DOI] [PubMed] [Google Scholar]
- Sowell ER, Thompson PM, Leonard CM, Welcome SE, Kan E, Toga AW (2004): Longitudinal mapping of cortical thickness and brain growth in normal children. J Neurosci 24: 8223–8231. [DOI] [PMC free article] [PubMed] [Google Scholar]
- Steger J, Imhof K, Steinhausen H, Brandeis D (2000): Brain mapping of bilateral interactions in attention deficit hyperactivity disorder and control boys. Clin Neurophysiol 111: 1141–1156. [DOI] [PubMed] [Google Scholar]
- Suzuki M, Yamazaki Y, Matsunami K (1994): Relationship between force and electromyographic activity during rapid isometric contraction in power grip. Electroencephalogr Clin Neurophysiol 93: 218–224. [DOI] [PubMed] [Google Scholar]
- Talairach J, Tournoux P (1988): Co‐planar stereotaxic atlas of the human brain. New York: Georg Thieme. [Google Scholar]
- Toma K, Matsuoka T, Immisch I, Mima T, Waldvogel D, Koshy B, Hanakawa T, Shill H, Hallett M (2002): Generators of movement‐related cortical potentials: fMRI‐constrained EEG dipole source analysis. Neuroimage 17: 161–173. [DOI] [PubMed] [Google Scholar]
- Vaillancourt DE, Thulborn KR, Corcos DM (2003): Neural basis for the processes that underlie visually guided and internally guided force control in humans. J Neurophysiol 90: 3330–3340. [DOI] [PubMed] [Google Scholar]
- Wannier TM, Maier MA, Hepp‐Reymond MC (1991): Contrasting properties of monkey somatosensory and motor cortex neurons activated during the control of force in precision grip. J Neurophysiol 65: 572–589. [DOI] [PubMed] [Google Scholar]
- Ward NS, Frackowiak RS (2003): Age‐related changes in the neural correlates of motor performance. Brain 126: 873–888. [DOI] [PMC free article] [PubMed] [Google Scholar]