

Abstract
We examined the neural substrate of motor response inhibition and performance monitoring in the stop signal task (SST) using event‐related functional magnetic resonance imaging (fMRI). The SST involves a go task and the occasional requirement to stop the go response. We posit that both the go and the stop phases of the SST involve components of inhibition and performance monitoring. The goal of this study was to determine whether inhibition and performance monitoring during go and stop phases of the task activated different networks. We isolated go‐phase activities underlying response withholding, monitoring, and sensorimotor processing and contrasted these with successful inhibition to identify the substrate of response inhibition. Error detection activity was isolated using trials in which a stop signal appeared but the response was executed. These trials were modeled as a hand‐specific go trial followed by error processing. Cognitive go‐phase processes included response withholding and monitoring and activated right prefrontal and midline networks. Response withdrawal additionally activated right inferior frontal gyrus and basal ganglia (caudate). Error detection invoked by failed inhibition activated dorsal anterior cingulate cortex (dACC) and right middle frontal Brodmann's area 9. Our results confirm that there are distinct aspects of inhibition and performance monitoring functions which come into play at various phases within a given trial of the SST, and that these are separable using fMRI. Hum Brain Mapp, 2007. © 2007 Wiley‐Liss, Inc.
Keywords: inhibition, deconvolution, inferior frontal gyrus, dorsal anterior cingulate cortex, stop signal task, error detection, performance monitoring, fMRI
INTRODUCTION
Inhibitory control and performance monitoring are interrelated aspects of executive control. Executive control is crucial to the scheduling and optimizing of subsidiary processes that are required to meet changing goals in a flexible manner [Mesulam, 1986; Miller and Cohen, 2001; Shallice and Burgess, 1996]. Inhibition is involved in the withholding and withdrawing of motor responses. Withholding comes into play when prepared responses are restrained pending further information; withdrawing refers to the cancellation of a response that is already underway. These executive processes play a crucial role in the control of movement [Band and van Boxtel, 1999], in normal development [Harnishfeger and Pope, 1996; Williams et al., 1999], in the consequences of various neuropathologies, e.g., Parkinson's disease [Gauggel et al., 2004; Seiss and Praamstra, 2004], and in the etiology of several psychiatric disorders (e.g., attention deficit hyperactivity disorder (ADHD) [Willcutt et al., 2005]). Performance monitoring involves the monitoring for and detection of errors and the subsequent adjustment of ongoing behavior in order to optimize subsequent performance [Holroyd et al., 2002, 2004]. Performance monitoring is critical to learning in the presence of reward [Schultz et al., 2000] and abnormalities in performance monitoring are implicated in the behavioral manifestations of some lesions [Ullsperger et al., 2002; Woods et al., 1993], in addictions [Di Chiara, 1998], and in various psychopathologies such as ADHD and obsessive compulsive disorder [Schachar et al., 2004; Solanto et al., 2001; Ursu et al., 2003]. There has been considerable interest in localizing brain activity related to these processes because of the broad importance of inhibition and performance monitoring to normal and abnormal development.
In the current study, we examine the neural substrate of motor response inhibition and performance monitoring in the stop signal task (SST) using rapid event‐related functional magnetic resonance imaging (fMRI). The SST is a widely used laboratory paradigm for studying the physiology and anatomy of response inhibition [Band and van Boxtel, 1999; Dimitrov et al., 2003], the consequences of brain lesions [Aron et al., 2003a], and the nature of psychopathology [Willcutt et al., 2005]. The SST engages the demand for inhibitory control by presenting participants with two concurrent tasks—a go task and a stop task. The go task is a simple choice reaction time task in which participants perform as quickly and as accurately as possible. The stop task involves the random presentation of a stop signal on a subset of trials that instructs the participant to cancel or withdraw their ongoing response on that particular trial (Fig. 1). The stop signal follows the go signal by some delay that is dynamically adjusted to ensure that half of the stop trials result in a failed inhibition trial (signal‐respond) and half in a successful inhibition trial (signal‐inhibit).
Figure 1.
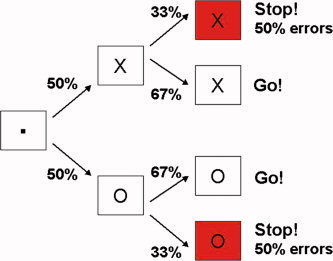
Stop signal task. Each trial began with a fixation dot in the middle of the screen for 500 ms followed by a go‐stimulus. The go stimulus was either an “X” indicating the subject should make a left‐hand button response, or an “O” indicating a right‐hand response. Go stimuli remained on screen for 1,000 ms. 33% of trials contained a stop signal (background color change to red), which followed the go signal indicating that the subject should not make the given response. Delay between go and stop signals was adaptively adjusted to ensure that half of stop trials presented contained erroneous responses despite the appearance of the stop signal. A blank screen occupied the remaining time between trials. [Color figure can be viewed in the online issue, which is available at www.interscience.wiley.com.]
According to the race model proposed to account for performance in the SST [Band et al., 2003; Logan et al., 1984], whether or not a participant responds on a particular trial depends on the outcome of a race between two independent processes—the go process starts with the presentation of the go signal and the stop process starts with the presentation of a stop signal. Whether or not a particular response can be stopped depends, therefore, on the speed of the response, the speed of the inhibitory process, and the delay between the onset of the go and the stop processes. The latency of go reaction times can be observed directly from trials that contain no stop signals and therefore involve responses. The latency of the stopping process cannot be observed directly because there is no button press on a successful stop trial. However, it can be estimated by subtracting the mean delay at which the probability of inhibition is 0.5 from the mean go reaction time [Logan et al., 1984].
In addition to inhibition processes triggered by stop signals, the SST also involves performance monitoring. Dynamic adjustment of the delay between the onset of the go and the stop signal ensures that participants fail to inhibit their responses on 50% of trials. Inhibition errors (signal‐respond trials) activate the performance monitoring system as can be seen in the electrophysiological signature of error detection, the error‐related negativity (ERN). Partial ERNs are also present on trials with no stop signal. The presence of an ERN on trials without errors indicates a go‐phase component of performance monitoring, generally referred to as conflict monitoring. Go task trials that follow signal‐respond trials are typically slower than are go trials that do not follow errors [Gehring et al., 1993], indicating an error detection process which has its effect on subsequent go responses [Gehring et al., 2000; Hogan et al., 2005; Schachar et al., 2004]. Therefore the SST engages conflict monitoring during go phases and error processing on failed stop phases.
Stop signals in the SST activate inhibition networks as is evident in the neurophysiological signature of response inhibition, the N200. Partial N200s are present even on trials with no stop signal, indicating that there is a go‐phase component of inhibition. The function of the go‐phase component of inhibition is to withhold responses in case a stop signal appears. Further evidence for this conclusion is derived from comparison of the latency of go trials when the task is run without any stop signals and when it is run with stop signals. Typically, the mean go reaction time on the go task is slower when the task is run with stop signals present. Slowing of go responses in the presence of possible stop signals indicates that there are withholding processes mixed with go response processes during the go‐phase of the task. Signal‐inhibit phases of the SST activate a response withdrawal network, which may be anatomically distinct from that involved in response withholding. Signal‐inhibit trials additionally involve some motor activity, but less so than the trials that contain responses. It follows that in order to isolate inhibition involved in withdrawing a response when a stop signal appears, it is necessary to take into account the cognitive (e.g. inhibition and performance monitoring) and motor activities that are involved in go phases.
Therefore, direct contrast of a stop task with a go task, as is often found in fMRI studies of inhibitory control using block designs, would be confounded by marked changes in the go process invoked by the addition of stop signals [Band and van Boxtel, 1999; van Boxtel et al., 2001]. Conversely, event‐related designs have subtracted failed from successful stop trial activities in order to isolate inhibition, which assumes that signal inhibit trials involve inhibition while signal respond trials do not. As explained above, the assumption that there are no inhibition‐related activities during go phases is unlikely to be true. Event‐related designs have also subtracted successful from failed stop trial activities in order to isolate error detection using the contradictory assumption that both trials involve the same inhibition activity.
The approach used in this study began by isolating cognitive activities from motor activities during go phases. Activities corresponding to right‐ and left‐hand responses were contrasted in a way that preferentially conserved common activities (including withholding component of inhibition and monitoring component of performance monitoring) while suppressing those specific to the handedness of the response (motor component). This estimate of cognitive go‐phase activity was then subtracted from signal inhibit trials to isolate activities underlying successful response withdrawal. To separate left‐hand response from right‐hand response activities, it was necessary to randomize trial lengths and incorporate rests to avoid multicollinearity of event types [Ollinger et al., 2001a, b]. Reconstructing cognitive go‐phase activities permits separation of the networks involved in withholding responses (go‐phase) from those involved in withdrawing responses when a stop signal is presented (stop‐phase).
Separating left‐ and right‐hand responses in the analytical model also benefits the isolation of error processing activities on signal‐respond trials. We isolated error detection activity by modeling signal‐respond trials, which do contain a response, as a hand‐specific motor response (go‐phase) followed by an error‐processing stimulus (stopphase). This stands in contrast with previous event‐related studies which have subtracted signal‐respond and signal‐inhibit trials to control for inhibitory functions. Modeling signal respond trials as go trials followed by error processing allows for the isolation of unsuccessful stop‐phase activities from go‐phase activities without the need of a statistical contrast. Most importantly, the model does not require a contrast of signal respond and signal‐inhibit trials, thus eliminating questionable assumptions regarding the “similarity” of inhibition on failed and successful stop trials. This approach to encoding failed inhibition trials can distinguish brain regions involved in monitoring during go phases from those involved in detecting and processing inhibition errors. This is the first study to attempt this. Previous studies have been able to relate ERN amplitude to BOLD responses in midline regions of interest [Debener et al., 2005] but have still not allowed for neuroanatomical differentiation between go and fail components of the ERN. It should be noted that although the current approach separates withholding and monitoring from withdrawal and error processing, it does not separate withholding from monitoring. Further, withholding and monitoring are also not isolated from certain go‐task maintenance functions such as response selection. However, withholding is likely associated with right prefrontal regions where the N200 is strongest, and monitoring is likely associated with midline areas where the ERN is strongest.
The goal of the current study was twofold. First, to isolate activities associated with withdrawal of a motor response (inhibition) and with errors (performance monitoring) in the stop task more specifically than in previous imaging designs by accounting for the appropriate amount of concurrent go‐phase activity. The second goal was to determine if cognitive activities during go‐phases reveal neural candidates for response withholding and monitoring processes in right prefrontal and midline regions, respectively.
METHOD
Subjects and Task Design
Fourteen healthy subjects (8 male, 6 female) ranging in age from 22 to 35 years (mean 29.4) were studied. All were right‐handed, had normal or corrected‐to‐normal vision and reported no medication use, medical illness, or psychological problems. Subjects gave informed written consent to participate in the study. The study was approved by our institutional research ethics board.
The SST involved two components, a primary go task and a secondary stop task. Each trial began with a fixation point which appeared in the center of a black screen for 500 ms, followed by the stimulus (the letter “X” or “O”) for 1,000 ms. A blank screen appeared between go stimuli and subsequent fixation dots. Participants were required to make a response as quickly and as accurately as possible with their left thumb if the go stimulus was an X or their right thumb if it was an O. Stop‐trials involved a change in screen color from black to red. The stop‐signal followed the go‐stimulus randomly on 33% of trials and instructed participants to withhold that particular response. Trial types encountered in the SST are graphically portrayed in Figure 1. A tracking algorithm [Logan et al., 1984] ensured an approximately equal number of failed and successful stop‐trials within a given run. The initial stop‐signal delay was 250 ms and increased or decreased by 50 ms when subjects succeeded or failed to stop, respectively. Intertrial interval (ITI) was jittered from 2.5 to 3.5 s to ensure no multicollinearity of event types. Every fourteenth trial was followed by a 17.5 s rest in order to establish a well‐defined baseline of neural activity [Friston et al., 1999]. Trial timing was manipulated in this way in order to be within the bounds established by Ollinger et al. [2001a, b] for separating processes within a trial. Trial order within each block was pseudorandomized [Miezin et al., 2000] so that each trial type (X or O; go, stop, or fail) was equally likely to follow each other. Task timing was optimized prior to scanning by testing the inherent standard deviation of various randomization designs [Friston et al., 1999]. The task involved 322 trials, requiring a total scan time of 21 min 40 s.
The mean go response time (RT) was observable from the 67% of trials in which no stop signal appeared. The stop‐signal reaction time (SSRT) was estimated by subtracting the mean delay from the mean go RT [Logan et al., 1984].
Scanning Parameters and Data Analysis
Imaging was done with a GE LX 1.5T MRI scanner (General Electric, Milwaukee). Anatomical data were acquired with a standard high‐quality SPGR sequence (96 slices, 1.5‐mm thick, FOV = 20 cm, 256 × 256 matrix). Functional data were collected using a gradient echo sequence with a spiral readout (1 interleaf, 4,096 points, TE/TR/θ = 40/2,000/90, 24 slices, 6‐mm thick, FOV = 24 cm, 100‐kHz readout bandwidth) [Glover and Lai, 1998]. These images were reconstructed offline using a regridding algorithm based on a Kaiser–Bessel resampling kernel, resulting in a 64 × 64 pixel resolution and final voxel size of 3.75 × 3.75 × 5 mm3 thick. Physiologic data was collected using a Lumitouch fibreoptic button box (Lightwave Medical, Burnaby, BC, Canada) interfaced to a laptop running the stop task paradigm.
Functional data were analyzed using AFNI [Cox, 1996]. Images were motion corrected using a standard coregistration algorithm [Woods et al., 1998]. A general linear model of stimulus vectors convolved with the hemodynamic response function (HRF) was used in the deconvolution analysis. Estimates of baseline and linear drift were generated along with 5‐point HRFs (10‐s duration) for each event type outlined below (HRF delay = 2TR = 4 s).
The following event types were involved in the deconvolution analysis: X, left‐hand response; O, right‐hand response; stop, successful inhibition; fail, error processing on failed inhibition trials. Failed inhibition (signal respond) trials were modeled as consisting of response execution and error processing triggers. In this way, cognitive activities associated with the go‐phase would be captured by the response trigger (X or O), leaving the error processing stimulus to capture failed stop phase activities (i.e. attempted inhibition and error detection). Although responses and errors occur within the same TR, their activities are separable because they do not always co‐occur [Ollinger et al., 2001a, b]. The temporal jittering, short ITIs (including rests, mean fixate‐to‐fixate = 4.0 s) and long scan time in the task design were modeled to result in sufficient power to resolve successful and failed inhibition activities while keeping all event types separable. Jittering ITIs and randomizing trial types ensured that the event types chosen in the analysis were not multicollinear, while 17.5 s rests every minute provided a well‐defined baseline.
Intensity maps for all event types, for each subject, were generated by taking the area under the HRF (estimated by the sum of HRF coefficients generated from 3dDeconvolve), warped into Talairach space, Gaussian blurred (6‐mm FWHM), and resampled at 1 mm3 resolution. These warped and blurred single subject activation maps were then passed on to a group random effects ANOVA analysis. The sum of HRF coefficients was used as the dependent variable instead of amplitude because of the nonparametric deconvolution approach. Such approaches often use maximum amplitude as dependent variables because they do not explicitly model a gamma function response. However, in this framework, noisy voxels may generate high amplitude estimates within the HRF window, leading to unnecessarily high false‐positive rates. Spurious HRF estimates due to noisy voxels are expected to be distributed about zero because they are deconvolved simultaneously with baseline and drift terms. Therefore, using the area under the curve decreases the rate of false positives without being constrained to gamma function responses.
We reconstructed withholding and monitoring functions during go‐phases using the statistical contrast: [1/2] (X + O). This contrast was used as an estimate of activities common to left‐ and right‐hand response phases, while suppressing those specific to the handedness of the response. Activity due to withdrawing responses on signal‐inhibit trials was calculated by subtracting cognitive go‐phase activities from signal‐inhibit trials: withdraw = stop − [1/2] (X + O). The parsing of the task into event types and reconstruction of processes of interest is graphically portrayed in Figure 2. Statistical estimates obtained from the ANOVA analysis (distributed as t* with 52 degrees of freedom due to the number of subjects and regressors in the model) were converted to raw Z‐scores and corrected for multiple comparisons according to Gaussian field theory (program AlphaSim in AFNI; http://afni.nimh.gov/afni/) for an overall α < 0.05. Using AFNIs AlphaSim program, we performed Monte Carlo simulations based on single subject noise full‐width half‐maximum (FWHM) estimates, a span of 253 mm3 (three original voxels) and a target α < 0.05. These simulations yielded a required z value of 3.1. In order to further suppress the possibility of false positives, we increased the threshold and spatial extent, requiring significant voxels to be part of a larger cluster of at least 300 mm3 with minimum Z score of 3.5. Finally, locations and cortical structures were identified and volumes of significant activations were determined.
Figure 2.
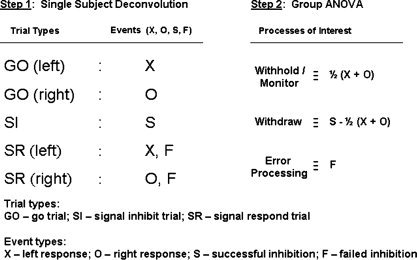
Overview of the analytical model used in this study. First, single subject data was parsed into five unique trial types (Step 1, left side). Trials were modeled using different combinations of four event types (Step 1, right side). Go trials contain left “X” (row 1) or right “O” (row 2) response triggers, while successful stop trials contain successful inhibition triggers “S” (row 3). Failed stop trials contain a left or right response trigger and an error‐processing stimulus “F” (rows 4, 5). Five‐point HRFs were deconvolved along with baseline and linear drift terms for each subject's fMRI time series data. Activation maps for each event type were generated by taking the area under the HRF, estimated by the direct sum of HRF coefficients. Second, a random effects group ANOVA analysis was performed on the deconvolution outputs from all subjects (Step 2) to isolate the three maps of interest: withholding and monitoring during go phases; response withdrawal; and error processing.
RESULTS
Subject's task performance during scanning was in keeping with normal adults in a non‐MRI environment: go responses were fast (go RT = 597.7 ± 53.7 ms) and participants inhibited on roughly half of the stop trials (51.2 ± 2.4%), indicating that the tracking algorithm performed as expected. Mean SSRT was 210.3 ± 48.0 ms, representative of normal inhibitory control, and subjects slowed responses after errors indicating normal performance monitoring. Each subject's behavioral data was void of multicollinearity (i.e., model matrices were invertible) indicating event type separation was possible, but this is not a guarantee that they are well separated. Confidence in the analytical model is increased by the distinct, meaningful activations in the results. Below we discuss the ways in which significant neural activity during go and stop phases of the SST corresponded with what would be expected from emerging theories of inhibitory control and performance monitoring. Brain areas showing significant activity associated with cognitive functions during go‐phases, successful response withdrawal, and processing errors on failed stop trials are summarized in Table I.
Table I.
(A) Cognitive activities during go‐phases, (B) activities during successful stop phases, and (C) activities during unsuccessful stop phases
| Structure | Position (x, y, z) | Z value | Volume (mm3) | BA |
|---|---|---|---|---|
| (A) Cognitive go‐phase activities | ||||
| L precentral/middle frontal | −32, −5, 50 | 3.3 | 328 | 6 |
| Bi superior/medial frontal | −1, 9, 51 | 3.4 | 681 | 6/32 |
| R superior/middle frontal | 33, 39, 30 | 3.7 | 640 | 9 |
| R superior/middle frontal | 22, 54, 0 | 3.6 | 1404 | 10 |
| L superior/medial frontal | −2, 60, 9 | −3.4 | 566 | 10 |
| Bi medial frontal | 0, 46, −10 | −3.3 | 1475 | 10 |
| L inferior parietal | −35, −51, 44 | 3.7 | 1113 | 40 |
| Bi paracentral | −4, −34, 60 | −3.8 | 1196 | 5 |
| Bi cingulate | 0, −46, 37 | −4.6 | 7760 | 31 |
| L angular gyrus | −45, −69, 32 | −3.6 | 435 | 39 |
| R insula | 43, −11, 2 | −3.4 | 415 | 13 |
| R middle occipital | 28, −86, 0 | 5.3 | 13902 | 18 |
| L middle occipital | −28, −87, 1 | 4.4 | 16131 | 18 |
| L superior vermis | −8, −74, −19 | 5.1 | 4542 | – |
| R cerebellar tonsil | 22, −56, −42 | 4.3 | 498 | – |
| (B) Successful stop‐phase activities | ||||
| R inferior frontal | 45, 11, 23 | 3.6 | 394 | 9 |
| R caudate | 5, 2, 10 | 3.6 | 437 | – |
| Bi cuneus | −2, −85, 8 | 13 | 19645 | 17 |
| (C) Unsuccessful stop‐phase activities | ||||
| R middle frontal | 45, 16, 35 | 3.7 | 1920 | 9 |
| R anterior cingulate | 6, 33, 25 | 3.9 | 600 | 32 |
| L postcentral gyrus (contains Bi pre/post) | −41, −31, 54 | −3.6 | 2230 | 2/3/4 |
| L supramarginal gyrus | −56, −48, 33 | 3.6 | 367 | 40 |
| R supramarginal gyrus | 51, −47, 32 | 3.9 | 740 | 40 |
| L cingulate | −6, −30, 35 | −3.7 | 97 | 31 |
| L insula | −30, −25, 13 | −4.3 | 689 | 13 |
| Bi cuneus | −1, −78, 7 | 4.8 | 10197 | 18 |
| R middle temporal | 54, −31, 0 | 3.6 | 964 | 21 |
| R uncus/middle temporal | 33, 1, −32 | 3.8 | 310 | 20 |
Activities common to left‐ and right‐hand responses ([1/2](X + O) map) were found in right prefrontal and midline areas, which may underlie the withholding and monitoring, which occur during go‐phases in the SST. Activity was also seen in posterior attention networks (posterior parietal, cingulate, and occipital areas) and vermis of the cerebellum. A second analysis was performed in which go trials were modeled with a single stimulus (not hand‐differentiated) and compared it to the [1/2](X + O) map to determine whether separating handedness of responses in the analysis offers any advantage. The go map from the second analysis did not contain the right prefrontal and midline activities that the [1/2](X + O) map did, suggesting that accounting for handedness of responses in a simultaneous deconvolution reveals activities that simply modeling go trials cannot. Subtracting partial go‐phase activity from successful stop trials (stop − [1/2](X + O)) showed activity in right inferior frontal gyrus (IFG) BA 9, caudate and visual areas. In the second analysis, go trials were not parsed according to handedness of responses and this activity was subtracted from successful stop trial activity. This contrast showed significant activity in visual areas but not in prefrontal or subcortical regions, suggesting that the current stop − [1/2](X + O) map better controls for go‐processes on successful stop trials than simply modeling go trials without taking handedness of responses into account. Errors were modeled as hand‐specific responses accompanied by an error processing stimulus. The error processing stimulus revealed activity in visual, temporal, parietal, and, more importantly, right prefrontal and midline areas implicated in behavioral adjustment and error detection. Activities in right prefrontal cortex corresponding to different inhibition phases are portrayed in Figure 3. Medial frontal activities corresponding to different performance monitoring‐phases are graphically portrayed in Figure 4.
Figure 3.
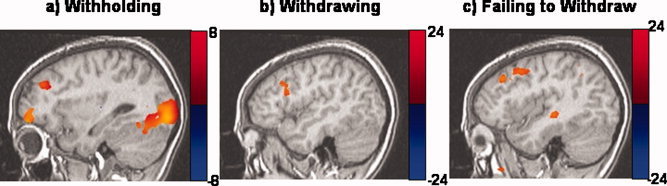
Brain activities corresponding to different inhibitory phases of the SST: (a) gophases (Talairach space y = r 31), (b) successful stop phases (y = r 43), (c) unsuccessful stop phases (y = r 39). These phases represent times when subjects were withholding, withdrawing, and failing to withdraw motor responses. All maps corrected for an overall α < 0.05. [Color figure can be viewed in the online issue, which is available at www.interscience.wiley.com.]
Figure 4.
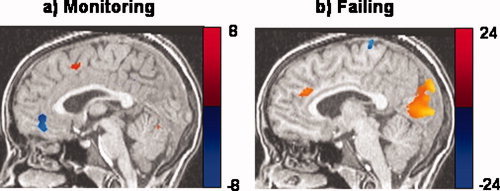
Brain activities corresponding to different performance monitoring phases in the SST: (a) go‐phases (Talairach space y = r 2); (b) failed stop phases (y = r 4). These phases represent times when subjects were monitoring for and processing inhibition errors. All maps corrected for an overall α < 0.05. [Color figure can be viewed in the online issue, which is available at www.interscience.wiley.com.]
DISCUSSION
The goal of this study was to identify go‐ and stop‐phase components of response inhibition and performance monitoring using a novel approach that differed from previously published block or event‐related fMRI studies. The current approach was shaped by a detailed analysis of the cognitive and motor processes involved in the stop task [De Jong et al., 1995] and on existing behavioral [Logan et al., 1984] and neurophysiological [Band and van Boxtel, 1999; Band et al., 2003] evidence. This evidence indicates that go phases in the SST involve inhibitory as well as motor processes that would confound the contrasting of a stop task with a go task, as is commonly found in block designs. We reasoned that signal‐respond and signal‐inhibit trials contain different combinations of motor, inhibition and error processing activity and that a contrast of signal‐inhibit and signal‐respond trials also would not adequately isolate either error or inhibition activity. We argued, instead, that it is necessary to remove cognitive go phase processes from signal inhibit trials in order to isolate the withdrawal component of inhibition. To this end we developed an approach that estimates the partial go‐phase activity on successful stop trial. We differentiated left and right hand responses in order to separate processes common to left and right responses, such as withholding and monitoring, from those involved in executing motor responses. Activities specific to the handedness of the response were considered to be more associated with motor functions, while activities that were less specific to the handedness of the response were ascribed a more cognitive role. This estimate of partial go‐phase activities on signal‐inhibit trials was subtracted from successful stop trial activity in order to isolate the withdrawal component of inhibition. Signal‐respond trials contain a response and were correspondingly modeled as a hand‐specific go‐trial followed by an error processing stimulus. This is the first fMRI study to our knowledge to use this approach for evaluating executive function in a stop task.
The approach required the randomization of trial lengths in order to avoid multicollinearity of event types. The approach also allowed for optimization of timing parameters (and hence the orthogonality of event‐types) prior to scanning by testing the inherent standard deviation of all regressors in the model given various randomized designs [Friston et al., 1999]. Consequently, we are confident that the event types in the design are separable. Further, the experimental design enhanced task‐induced deactivations in our results while suppressing spurious negative activity estimates. There is some controversy regarding the meaning of negative activity in fMRI data [see Binder et al., 1999; McKiernan et al., 2003; Raichle et al., 2001; Stefanovic et al., 2004]. It is not always possible to determine whether negative activity reflects: (a) a task‐related decrease in neural activity [Rekkas et al., 2005; Waldvogel et al., 2000], (b) less activity than in a given “rest” condition [Amedi et al., 2005], or (c) a redistribution of task processing to better suited regions [Rosenbaum et al., 2004]. Conventional approaches cannot discriminate between these cases because they control for concurrent processes by contrasting the “active” condition with a well‐matched “rest” condition. The inherent complexity of the model used in this study suppresses deactivations caused by activities which are out of phase with the task: activities during rest periods, which would normally appear as negative activity, are absorbed across several event types (X, O, Stop, Fail). Jittering ITIs and randomizing trial types had the effect of unevenly distributing events during the active phases, further suppressing deactivations caused by activities during the rest phases. Investigations into the origin of negative BOLD responses have been performed by Shmuel et al. [2002, 2006]. Shmuel et al. have verified negative BOLD responses related to decreases in blood flow and oxygenation caused by phasic decreases in neural activity—in other words, negative fMRI activations due to true cortical deactivations. The design therefore provides a robust foundation from which to interpret deactivations in our results as being task‐induced.
The current results revealed cognitive activities in right prefrontal and midline regions during go‐phases which were different from those which activated during stop phases. Cognitive go phase processes, which we argue are related to response withholding and monitoring, activated right prefrontal and midline networks. Response withdrawal initiated by the stop signal additionally activated right IFG and basal ganglia (caudate), while error detection invoked by failed inhibition activated dorsal anterior cingulate cortex (dACC) and right middle frontal BA9.
Subcomponents of inhibition and performance monitoring each yielded unique activation profiles which were distinct not only in intensity, but in anatomic location. The lack of significant overlap in frontal activities rests on a negative result and should not be over‐interpreted in neuroimaging data. However, we have confidence in our results for several reasons. First, parameters were optimized prior to scanning in order to maximize the separability of event types and a well‐defined baseline of neural activity. Secondly, some regions exhibited both go and stop phase activity, indicating that such overlapping responses can be identified when present. Finally, we have confidence in our results because they are consistent with what one would expect from emerging theories and research involving inhibitory control and error processing, as will be discussed below. The approach used here stands in contrast to blocked designs that confound go‐ and stop‐activities, and event‐related averages that contrast failed and successful stop trials. Neither approach provides the detail seen here.
The observed pattern of activity associated with inhibition and performance monitoring is consistent with observations from event‐related potential (ERP) studies of response inhibition [Band and van Boxtel, 1999]. Firstly, subjects performing stop tasks exhibit a right prefrontal wave on stop trials known as the N200, which has been taken to be an index of response inhibition [Eimer, 1993; Falkenstein et al., 1999; Kok, 1986; Schmajuk et al., 2006; van Boxtel et al., 2001]. Secondly, ERP studies of stop tasks have shown a negative medial frontal wave associated with error detection, known as the ERN, which has been taken to be an index of error processing [Falkenstein et al., 2000; Hajcak et al., 2005; Luu et al., 2003; Mathalon et al., 2003; Yasuda et al., 2004; Yeung et al., 2004]. In addition, both partial N200 and ERN are seen during go‐phases whether a stop signal appears or not [Band and van Boxtel, 1999; Coles et al., 2001]. The partial N200 and ERN seen on go‐trials are likely a reflection of monitoring and withholding processes during go phases in the stop task. These patterns of activity lie behind the accepted notion that inhibition is associated with right prefrontal networks and error detection with medial frontal and cingulate areas. Moreover, the fact that the current experimental design identified these predicted partial activities during go phases confirms the model that served as the basis of the current study and supports our contention that there are inhibition‐ and performance monitoring‐related activities during go phases in the SST which must be taken into account when isolating response withdrawal‐ and error detection‐specific neural activity. This adds substantial detail to the well accepted notion that right prefrontal and midline regions carry out inhibition and performance monitoring functions, respectively [Botvinick et al., 2001; Carter et al., 1998; Chevrier et al., 2004; Dehaene et al., 1994; Garavan et al., 1999; Gehring and Fencsik, 2001; Holroyd et al., 2002; Kelly et al., 2004; Luu et al., 2000; Mathalon et al., 2003; Matthews et al., 2005; Rubia et al., 2003; Wager et al., 2005].
Right Prefrontal Cortex and Inhibition
The current experiment showed that a number of regions in right prefrontal cortex (PFC) are differentially active while withholding, withdrawing, and failing to withdraw motor responses (see Fig. 3). The right IFG is clearly involved in response withdrawal on signal‐inhibit trials, and middle frontal areas in urgent inhibition or attentional reallocation on signal‐respond trials. However, the function of right prefrontal activities we observed during go phases is less clear because the cognitive go‐phase map is less specific. Lack of specificity arises because several processes other than withholding remain when go‐phases are controlled for handedness of the response (e.g. response preparation, selection, task maintenance, etc.). Nonetheless, when viewed in the light of previous ERP and fMRI findings it seems most likely that right PFC activities during go‐phases are functionally involved in withholding the ongoing response. The same right superior/middle frontal areas that we observed during go‐phases have often been found in studies using the go no‐go task, which has no stop delay and therefore primarily involves response withholding, as in go phases of the SST. These regions have also been attributed to inhibition in studies which have contrasted a stop task with a go task, which confounds changes in the go process (e.g. withholding) with stop processes. Therefore, these right dorsal‐lateral prefrontal activities appear to be associated with the withholding component of inhibition invoked when monitoring for a possible stop signal. The full N200 seen on signal‐inhibit trials is likely due to the added contribution of IFG activity upon successful response withdrawal.
Signal‐respond trials are known to evoke an even stronger N200 than do signal inhibit trials [van Boxtel et al., 2001]. This is in keeping with the current results which show additional activation of right middle frontal BA9 (and not IFG) when subjects processed inhibition errors. The increased N200 on signal‐respond trials has been interpreted as evidence of an urgent inhibition mechanism invoked by last‐ditch efforts to stop a response that is already underway [van Boxtel et al., 2001]. We contend that right middle frontal activity on signal‐respond trials may be related to error detection, attentional shifts and increased withholding. This interpretation is underscored by the fact that right frontal error‐related activity was accompanied by activity in temporal and parietal areas, which together have been shown to comprise an endogenous (top–down) network for voluntary attentional orientation [Foucher et al., 2004]. IFG, on the other hand, was active upon successful response withdrawal, and has been associated with an exogenous (bottom–up) network for the arousal of attention by incoming salient information [Downar et al., 2000], in this case the stop signal.
The right PFC activities that we observed during going, stopping, and failing have all been attributed to response inhibition in various studies. Right superior and middle frontal areas which we observed during go‐phases and erroneous responses, although not directly involved in withdrawing responses, have been associated with inhibition in previous neuroimaging studies [see Aron and Poldrack, 2005 for review]. The current results indicate that right IFG is the only frontal structure associated with the withdrawal of a response when go‐processes are controlled for. This finding further suggests that right superior and middle frontal activities often found in neuroimaging studies of inhibition are related to withholding rather than to response withdrawal. IFG has been the most strongly and consistently implicated cortical structure in response inhibition [Aron and Poldrack, 2005; Aron et al., 2003a, 2004; Garavan et al., 1999; Matthews et al., 2005; Rubia et al., 2003] and was the only frontal activity we found to be attributable to successful response withdrawal, further validating the specificity of the current approach.
Significant activity was also found in the striatum of the basal ganglia (caudate) upon successful response withdrawal. Basal ganglia activation is rarely seen in neuroimaging studies of inhibition although it is expected from theories of inhibitory control. The striatum is a critical relay in the frontostriatal loops known to be involved in cognitive control of motor behavior [Alexander and Crutcher, 1990], and specifically involved in inhibition [Aron et al., 2003b; Vink et al., 2005]. The basal ganglia have also been implicated in inhibitory deficits from neurodegenerative conditions [Dubois et al., 1994; Gauggel et al., 2004; Saint‐Cyr et al., 1995] and lesions [Rieger et al., 2003]. A meta‐analysis of existing neuroimaging studies [Aron and Poldrack, 2005] found that only 2 out of 11 studies reported basal ganglia activity related to response inhibition. Aron and Poldrack suggested that basal ganglia activation was simply not present at the same threshold as prefrontal activation. We suggest that the lack of basal ganglia findings in previous studies may also have to do with contrasting failed and successful stop trials, both of which may involve frontostriatal activities [Falkenstein et al., 2001; Koechlin et al., 2002; Seiss and Praamstra, 2004], yielding a low net result when these conditions are subtracted from one another. The current approach is not subject to the potential confounds that arise from contrasting failed and successful stop trials.
Midline Structures and Performance Monitoring
The current approach showed that distinct midline areas were active during go phases (while monitoring for stop signals) and while processing inhibition errors.
Detection of inhibition errors activated dACC. Monitoring for stop signals during go phases did not activate dACC but did activate BA 6 and deactivate BA 10 along the midline (see Fig. 4). Previous neuroimaging studies have shown that ACC is active not only in response to errors, but also to circumstances in which errors are more likely to occur. A study conducted by Brown and Braver [2005] using a modified stop‐change task and nonlinear analysis showed that after an initial learning phase, cues indicating higher probabilities of errors were associated with increases in ACC activity even when no change signal appeared. This is consistent with the current results, which show midline activities while anticipating potential stop cues, as well as upon processing errors of inhibition.
The absence of dACC activity during go‐phases indicates that dACC is either not the source of the partial ERN, or that activity in this region during go phases was below threshold in this experiment. Midline activity during go phases (BA 6/32) was more posterior and superior to dACC. Negative activity was seen anterior to dACC during go phases in medial frontal BA 10 and in posterior cingulate BA 31. These regions correspond with activities which have been identified using dipole source localization upon equivocal (i.e. noninformative) feedback [Muller et al., 2005], similar to the conflict monitoring which occurs during go‐phases in the SST. Another fMRI study found age‐related deactivations in these regions in an interference suppression task [Marsh et al., 2006], which was attributed to greater self‐monitoring and free associative thought during the baseline task.
In summary, inhibitory control in the SST manifests as a sequence of neural activity over the course of a trial. Identifying brain regions corresponding to components of these sequences of activity requires a method that takes into account the cognitive and motor processes involved in each phase of the task. The approach used in this study appears to divide certain bottom–up and top–down components of neural activity which, given their reentrant nature, have been very difficult to separate. In the SST, context changes over the course of a trial when a stop signal appears. During go phases, right prefrontal and midline regions operate together, withholding the response while monitoring for the appearance of a stop signal. Functional connectivity between these regions in the context of response conflict and inhibition has previously been demonstrated [Kemmotsu et al., 2005]. This connectivity appears to decouple on stop trials in a way that depends primarily on the success of the inhibition. A dynamic causal modeling approach [Friston et al., 2003] would be necessary to measure such changes in functional connectivity and is beyond the scope of this paper. Nonetheless, successful stop trials activated a bottom–up component of right PFC in response to the stop signal but did not activate midline regions implicated in monitoring, which is consistent with the fact that successful performance induces less performance monitoring than unsuccessful performance. Unsuccessful stop trials activated dACC, part of the “ascending” (bottom–up) dopamine network which responds to performance errors, and a top–down component of right PFC involved in shifting attention according to goals and directives.
REFERENCES
- Alexander GE,Crutcher MD( 1990): Functional architecture of basal ganglia circuits: Neural substrates of parallel processing. Trends Neurosci 13: 266–271. [DOI] [PubMed] [Google Scholar]
- Amedi A,Malach R,Pascual‐Leone A( 2005): Negative BOLD differentiates visual imagery and perception. Neuron 48: 859–872. [DOI] [PubMed] [Google Scholar]
- Aron AR,Poldrack RA( 2005): The cognitive neuroscience of response inhibition: Relevance for genetic research in attention‐deficit/hyperactivity disorder. Biol Psychiatry 57: 1285–1292. Epub Dec 23, 2004. [DOI] [PubMed] [Google Scholar]
- Aron AR,Fletcher PC,Bullmore ET,Sahakian BJ,Robbins TW( 2003a): Stop‐signal inhibition disrupted by damage to right inferior frontal gyrus in humans. Nat Neurosci 6: 115–116. [DOI] [PubMed] [Google Scholar]
- Aron AR,Schlaghecken F,Fletcher PC,Bullmore ET,Eimer M,Barker R,Sahakian BJ,Robbins TW( 2003b): Inhibition of subliminally primed responses is mediated by the caudate and thalamus: Evidence from functional MRI and Huntington's disease. Brain 126(Pt 3): 713–723. [DOI] [PMC free article] [PubMed] [Google Scholar]
- Aron AR,Robbins TW,Poldrack RA( 2004): Inhibition and the right inferior frontal cortex. Trends Cogn Sci 8: 170–177. [DOI] [PubMed] [Google Scholar]
- Band GP,van Boxtel GJ( 1999): Inhibitory motor control in stop paradigms: Review and reinterpretation of neural mechanisms. Acta Psychol (Amst) 101: 179–211. [DOI] [PubMed] [Google Scholar]
- Band GP,van der Molen MW,Logan GD( 2003): Horse‐race model simulations of the stop‐signal procedure. Acta Psychol (Amst) 112: 105–142. [DOI] [PubMed] [Google Scholar]
- Binder JR,Frost JA,Hammeke TA,Bellgowan PS,Rao SM,Cox RW( 1999): Conceptual processing during the conscious resting state. A functional MRI study. J Cogn Neurosci 11: 80–95. [DOI] [PubMed] [Google Scholar]
- Botvinick MM,Braver TS,Barch DM,Carter CS,Cohen JD( 2001): Conflict monitoring and cognitive control. Psychol Rev 108: 624–652. [DOI] [PubMed] [Google Scholar]
- Brown JW,Braver TS( 2005): Learned predictions of error likelihood in the anterior cingulate cortex. Science 307: 1118–1121. [DOI] [PubMed] [Google Scholar]
- Carter CS,Braver TS,Barch DM,Botvinick MM,Noll D,Cohen JD( 1998): Anterior cingulate cortex, error detection, and the online monitoring of performance. Science 280: 747–749. [DOI] [PubMed] [Google Scholar]
- Chevrier A,Noseworthy MD,Schachar R( 2004): Neural activity associated with failed inhibition: An event related fMRI study or performance monitoring. Brain Cogn 54: 163–165. [PubMed] [Google Scholar]
- Coles MG,Scheffers MK,Holroyd CB( 2001): Why is there an ERN/Ne on correct trials? Response representations, stimulus‐related components, and the theory of error‐processing. Biol Psychol 56: 173–189. [DOI] [PubMed] [Google Scholar]
- Cox RW( 1996): AFNI: Software for analysis and visualization of functional magnetic resonance neuroimages. Comput Biomed Res 29: 162–173. [DOI] [PubMed] [Google Scholar]
- De Jong R,Coles MG,Logan GD( 1995): Strategies and mechanisms in nonselective and selective inhibitory motor control. J Exp Psychol Hum Percept Perform 21: 498–511. [DOI] [PubMed] [Google Scholar]
- Debener S,Ullsperger M,Siegel M,Fiehler K,von Cramon DY,Engel AK( 2005): Trial‐by‐trial coupling of concurrent electroencephalogram and functional magnetic resonance imaging identifies the dynamics of performance monitoring. J Neurosci 25: 11730–11737. [DOI] [PMC free article] [PubMed] [Google Scholar]
- Dehaene S,Posner MI,Tucker DM( 1994): Localization of a neural system for error detection and compensation. Psychol Sci 5: 303–305. [Google Scholar]
- Di Chiara G( 1998): A motivational learning hypothesis of the role of mesolimbic dopamine in compulsive drug use. J Psychopharmacol 12: 54–67. [DOI] [PubMed] [Google Scholar]
- Dimitrov M,Nakic M,Elpern‐Waxman J,Granetz J,O'Grady J,Phipps M,Milne E,Logan GD,Hasher L,Grafman J( 2003): Inhibitory attentional control in patients with frontal lobe damage. Brain Cogn 52: 258–270. [DOI] [PMC free article] [PubMed] [Google Scholar]
- Downar J,Crawley AP,Mikulis DJ,Davis KD( 2000): A multimodal cortical network for the detection of changes in the sensory environment. Nat Neurosci 3: 277–283. [DOI] [PubMed] [Google Scholar]
- Dubois B,Malapani C,Verin M,Rogelet P,Deweer B,Pillon B( 1994): [Cognitive functions and the basal ganglia: The model of Parkinson disease]. Rev Neurol (Paris) 150: 763–770. [PubMed] [Google Scholar]
- Eimer M( 1993): Effects of attention and stimulus probability on ERPs in a Go/No go task. Biol Psychol 35: 123–138. [DOI] [PubMed] [Google Scholar]
- Falkenstein M,Hoormann J,Hohnsbein J( 1999): ERP components in Go/Nogo tasks and their relation to inhibition. Acta Psychol (Amst) 101: 267–291. [DOI] [PubMed] [Google Scholar]
- Falkenstein M,Hoormann J,Christ S,Hohnsbein J( 2000): ERP components on reaction errors and their functional significance: A tutorial. Biol Psychol 51: 87–107. [DOI] [PubMed] [Google Scholar]
- Falkenstein M,Hielscher H,Dziobek I,Schwarzenau P,Hoormann J,Sunderman B,Hohnsbein J( 2001): Action monitoring, error detection, and the basal ganglia: An ERP study. Neuroreport 12: 157–161. [DOI] [PubMed] [Google Scholar]
- Foucher JR,Otzenberger H,Gounot D( 2004): Where arousal meets attention: A simultaneous fMRI and EEG recording study. Neuroimage 22: 688–697. [DOI] [PubMed] [Google Scholar]
- Friston KJ,Zarahn E,Josephs O,Henson RN,Dale AM( 1999): Stochastic designs in event‐related fMRI. Neuroimage 10: 607–619. [DOI] [PubMed] [Google Scholar]
- Friston KJ,Harrison L,Penny W( 2003): Dynamic causal modelling. Neuroimage 19: 1273–1302. [DOI] [PubMed] [Google Scholar]
- Garavan H,Ross TJ,Stein EA( 1999): Right hemispheric dominance of inhibitory control: An event‐related functional MRI study. Proc Natl Acad Sci USA 96: 8301–8306. [DOI] [PMC free article] [PubMed] [Google Scholar]
- Gauggel S,Rieger M,Feghoff TA( 2004): Inhibition of ongoing responses in patients with Parkinson's disease. J Neurol Neurosurg Psychiatry 75: 539–544. [DOI] [PMC free article] [PubMed] [Google Scholar]
- Gehring WJ,Fencsik DE( 2001): Functions of the medial frontal cortex in the processing of conflict and errors. J Neurosci 21: 9430–9437. [DOI] [PMC free article] [PubMed] [Google Scholar]
- Gehring WJ,Goss B,Coles MGH,Meyers DE,Donchin E( 1993): A neural system for error detection and compensation. Psychol Sci 4: 385–390. [Google Scholar]
- Gehring WJ,Himle J,Nisenson LG( 2000): Action‐monitoring dysfunction in obsessive compulsive disorder. Psychol Sci 11: 1–6. [DOI] [PubMed] [Google Scholar]
- Glover GH,Lai S( 1998): Self‐navigated spiral fMRI: Interleaved versus single‐shot. Magn Reson Med 39: 361–368. [DOI] [PubMed] [Google Scholar]
- Hajcak G,Moser JS,Yeung N,Simons RF( 2005): On the ERN and the significance of errors. Psychophysiology 42: 151–160. [DOI] [PubMed] [Google Scholar]
- Harnishfeger KK,Pope RS( 1996): Intending to forget: The development of cognitive inhibition in directed forgetting. J Exp Child Psychol 62: 292–315. [DOI] [PubMed] [Google Scholar]
- Hogan AM,Vargha‐Khadem F,Kirkham FJ,Baldeweg T( 2005): Maturation of action monitoring from adolescence to adulthood: An ERP study. Dev Sci 8: 525–534. [DOI] [PubMed] [Google Scholar]
- Holroyd CB,Coles MG,Nieuwenhuis S( 2002): Medial prefrontal cortex and error potentials. Science 296: 1610–1611; author reply 1610–1611. [DOI] [PubMed] [Google Scholar]
- Holroyd CB,Nieuwenhuis S,Yeung N,Nystrom L,Mars RB,Coles MG,Cohen JD( 2004): Dorsal anterior cingulate cortex shows fMRI response to internal and external error signals. Nat Neurosci 7: 497–498. [DOI] [PubMed] [Google Scholar]
- Kelly AM,Hester R,Murphy K,Javitt DC,Foxe JJ,Garavan H( 2004): Prefrontalsubcortical dissociations underlying inhibitory control revealed by event‐related fMRI. Eur J Neurosci 19: 3105–3112. [DOI] [PubMed] [Google Scholar]
- Kemmotsu N,Villalobos ME,Gaffrey MS,Courchesne E,Muller RA( 2005): Activity and functional connectivity of inferior frontal cortex associated with response conflict. Brain Res Cogn Brain Res 24: 335–342. [DOI] [PubMed] [Google Scholar]
- Koechlin E,Danek A,Burnod Y,Grafman J( 2002): Medial prefrontal and subcortical mechanisms underlying the acquisition of motor and cognitive action sequences in humans. Neuron 35: 371–381. [DOI] [PubMed] [Google Scholar]
- Kok A( 1986): Effects of degradation of visual stimulation on components of the event‐related potential (ERP) in go/nogo reaction tasks. Biol Psychol 23: 21–38. [DOI] [PubMed] [Google Scholar]
- Logan GD,Cowan WB,Davis KA( 1984): On the ability to inhibit simple and choice reaction time responses: A model and a method. J Exp Psychol Hum Percept Perform 10: 276–291. [DOI] [PubMed] [Google Scholar]
- Luu P,Flaisch T,Tucker DM( 2000): Medial frontal cortex in action monitoring. J Neurosci 20: 464–469. [DOI] [PMC free article] [PubMed] [Google Scholar]
- Luu P,Tucker DM,Derryberry D,Reed M,Poulsen C( 2003): Electrophysiological responses to errors and feedback in the process of action regulation. Psychol Sci 14: 47–53. [DOI] [PubMed] [Google Scholar]
- Marsh R,Zhu H,Schultz RT,Quackenbush G,Royal J,Skudlarski P,Peterson BS( 2006): A developmental fMRI study of self‐regulatory control. Hum Brain Mapp 27: 848–863. [DOI] [PMC free article] [PubMed] [Google Scholar]
- Mathalon DH,Whitfield SL,Ford JM( 2003): Anatomy of an error: ERP and fMRI. Biol Psychol 64: 119–141. [DOI] [PubMed] [Google Scholar]
- Matthews SC,Simmons AN,Arce E,Paulus MP( 2005): Dissociation of inhibition from error processing using a parametric inhibitory task during functional magnetic resonance imaging. Neuroreport 16: 755–760. [DOI] [PubMed] [Google Scholar]
- McKiernan KA,Kaufman JN,Kucera‐Thompson J,Binder JR( 2003): A parametric manipulation of factors affecting task‐induced deactivation in functional neuroimaging. J Cogn Neurosci 15: 394–408. [DOI] [PubMed] [Google Scholar]
- Mesulam MM( 1986): Frontal cortex and behavior. Ann Neurol 19: 320–325. [DOI] [PubMed] [Google Scholar]
- Miezin FM,Maccotta L,Ollinger JM,Petersen SE,Buckner RL( 2000): Characterizing the hemodynamic response: Effects of presentation rate, sampling procedure, and the possibility of ordering brain activity based on relative timing. Neuroimage 11(6 Pt 1): 735–759. [DOI] [PubMed] [Google Scholar]
- Miller EK,Cohen JD( 2001): An integrative theory of prefrontal cortex function. Annu Rev Neurosci 24: 167–202. [DOI] [PubMed] [Google Scholar]
- Muller SV,Moller J,Rodriguez‐Fornells A,Munte TF( 2005): Brain potentials related to self‐generated and external information used for performance monitoring. Clin Neurophysiol 116: 63–74. [DOI] [PubMed] [Google Scholar]
- Ollinger JM,Corbetta M,Shulman GL( 2001a): Separating processes within a trial in event‐related functional MRI. Neuroimage 13: 218–229. [DOI] [PubMed] [Google Scholar]
- Ollinger JM,Shulman GL,Corbetta M( 2001b): Separating processes within a trial in event‐related functional MRI. Neuroimage 13: 210–217. [DOI] [PubMed] [Google Scholar]
- Raichle ME,MacLeod AM,Snyder AZ,Powers WJ,Gusnard DA,Shulman GL( 2001): A default mode of brain function. Proc Natl Acad Sci USA 98: 676–682. [DOI] [PMC free article] [PubMed] [Google Scholar]
- Rekkas PV,Westerveld M,Skudlarski P,Zumer J,Pugh K,Spencer DD,Constable RT( 2005): Neural correlates of temporal‐order judgments versus those of spatiallocation: Deactivation of hippocampus may facilitate spatial performance. Brain Cogn 59: 103–113. [DOI] [PubMed] [Google Scholar]
- Rieger M,Gauggel S,Burmeister K. ( 2003): Inhibition of ongoing responses following frontal, nonfrontal, and basal ganglia lesions. Neuropsychology 17: 272–282. [DOI] [PubMed] [Google Scholar]
- Rosenbaum RS,Ziegler M,Winocur G,Grady CL,Moscovitch M( 2004): “I have often walked down this street before”: fMRI studies on the hippocampus and other structures during mental navigation of an old environment. Hippocampus 14: 826–835. [DOI] [PubMed] [Google Scholar]
- Rubia K,Smith AB,Brammer MJ,Taylor E( 2003): Right inferior prefrontal cortex mediates response inhibition while mesial prefrontal cortex is responsible for error detection. Neuroimage 20: 351–358. [DOI] [PubMed] [Google Scholar]
- Saint‐Cyr JA,Taylor AE,Nicholson K( 1995): Behavior and the basal ganglia. Adv Neurol 65: 1–28. [PubMed] [Google Scholar]
- Schachar RJ,Chen S,Logan GD,Ornstein TJ,Crosbie J,Ickowicz A,Pakulak A( 2004): Evidence for an error monitoring deficit in attention deficit hyperactivity disorder. J Abnorm Child Psychol 32: 285–293. [DOI] [PubMed] [Google Scholar]
- Schmajuk M,Liotti M,Busse L,Woldorff MG( 2006): Electrophysiological activity underlying inhibitory control processes in normal adults. Neuropsychologia 44: 384–395. Epub Aug 10, 2005. [DOI] [PubMed] [Google Scholar]
- Schultz W,Tremblay L,Hollerman JR( 2000): Reward processing in primate orbitofrontal cortex and basal ganglia. Cereb Cortex 10: 272–284. [DOI] [PubMed] [Google Scholar]
- Seiss E,Praamstra P( 2004): The basal ganglia and inhibitory mechanisms in response selection: Evidence from subliminal priming of motor responses in Parkinson's disease. Brain 127(Pt 2): 330–339. Epub Nov 25, 2003. [DOI] [PubMed] [Google Scholar]
- Shallice T,Burgess P( 1996): The domain of supervisory processes and temporal organization of behaviour. Philos Trans R Soc Lond B Biol Sci 351: 1405–1411; discussion 1411–1412. [DOI] [PubMed] [Google Scholar]
- Shmuel A,Yacoub E,Pfeuffer J,Van de Moortele PF,Adriany G,Hu X,Ugurbil K( 2002): Sustained negative BOLD, blood flow and oxygen consumption response and its coupling to the positive response in the human brain. Neuron 36: 1195–1210. [DOI] [PubMed] [Google Scholar]
- Shmuel A,Augath M,Oeltermann A,Logothetis NK( 2006): Negative functional MRI response correlates with decreases in neuronal activity in monkey visual area V1. Nat Neurosci 9: 569–577. [DOI] [PubMed] [Google Scholar]
- Solanto MV,Abikoff H,Sonuga‐Barke E,Schachar R,Logan GD,Wigal T,Hechtman L,Hinshaw S,Turkel E( 2001): The ecological validity of delay aversion and response inhibition as measures of impulsivity in AD/HD: A supplement to the NIMH multimodal treatment study of AD/HD. J Abnorm Child Psychol 29: 215–228. [DOI] [PubMed] [Google Scholar]
- Stefanovic B,Warnking JM,Pike GB( 2004): Hemodynamic and metabolic responses to neuronal inhibition. Neuroimage 22: 771–778. [DOI] [PubMed] [Google Scholar]
- Ullsperger M,von Cramon DY,Muller NG( 2002): Interactions of focal cortical lesions with error processing: Evidence from event‐related brain potentials. Neuropsychology 16: 548–561. [DOI] [PubMed] [Google Scholar]
- Ursu S,Stenger VA,Shear MK,Jones MR,Carter CS( 2003): Overactive action monitoring in obsessive‐compulsive disorder: Evidence from functional magnetic resonance imaging. Psychol Sci 14: 347–353. [DOI] [PubMed] [Google Scholar]
- van Boxtel GJ,van der Molen MW,Jennings JR,Brunia CH( 2001): A psychophysiological analysis of inhibitory motor control in the stop‐signal paradigm. Biol Psychol 58: 229–262. [DOI] [PubMed] [Google Scholar]
- Vink M,Kahn RS,Raemaekers M,van den Heuvel M,Boersma M,Ramsey NF( 2005): Function of striatum beyond inhibition and execution of motor responses. Hum Brain Mapp 25: 336–344. [DOI] [PMC free article] [PubMed] [Google Scholar]
- Wager TD,Sylvester CY,Lacey SC,Nee DE,Franklin M,Jonides J( 2005): Common and unique components of response inhibition revealed by fMRI. Neuroimage 27: 323–340. [DOI] [PubMed] [Google Scholar]
- Waldvogel D,van Gelderen P,Muellbacher W,Ziemann U,Immisch I,Hallett M( 2000): The relative metabolic demand of inhibition and excitation. Nature 406: 995–998. [DOI] [PubMed] [Google Scholar]
- Willcutt EG,Doyle AE,Nigg JT,Faraone SV,Pennington BF( 2005): Validity of the executive function theory of attention‐deficit/hyperactivity disorder: A metaanalytic review. Biol Psychiatry 57: 1336–1346. [DOI] [PubMed] [Google Scholar]
- Williams BR,Ponesse JS,Schachar RJ,Logan GD,Tannock R( 1999): Development of inhibitory control across the life span. Dev Psychol 35: 205–213. [DOI] [PubMed] [Google Scholar]
- Woods DL,Knight RT,Scabini D( 1993): Anatomical substrates of auditory selective attention: Behavioral and electrophysiological effects of posterior association cortex lesions. Brain Res Cogn Brain Res 1: 227–240. [DOI] [PubMed] [Google Scholar]
- Woods RP,Grafton ST,Holmes CJ,Cherry SR,Mazziotta JC( 1998): Automated image registration. I. General methods and intrasubject, intramodality validation. J Comput Assist Tomogr 22: 139–152. [DOI] [PubMed] [Google Scholar]
- Yasuda A,Sato A,Miyawaki K,Kumano H,Kuboki T( 2004): Error‐related negativity reflects detection of negative reward prediction error. Neuroreport 15: 2561–2565. [DOI] [PubMed] [Google Scholar]
- Yeung N,Cohen JD,Botvinick MM( 2004): The neural basis of error detection: Conflict monitoring and the error‐related negativity. Psychol Rev 111: 931–959. [DOI] [PubMed] [Google Scholar]