

Abstract
Coherent oscillations of neurons in the primary motor cortex (M1) have been shown to be involved in the corticospinal control of muscle activity. This interaction between M1 and muscle can be measured by the analysis of corticomuscular coherence in the β‐frequency range (β‐CMCoh; 14–30 Hz). Largely based on magnetoencephalographic (MEG) source‐modeling data, it is widely assumed that β‐CMCoh reflects direct coupling between M1 and muscle. Deafferentation is capable of modulating β‐CMCoh, however, and therefore the influence of reafferent somatosensory signaling and corresponding neuronal activity in the somatosensory cortex (S1) has been unclear. We present transcranial magnetic stimulation (TMS) and MEG data from three adult patients suffering from congenital hemiparesis due to pre‐ and perinatally acquired lesions of the pyramidal tract. In these patients, interhemispheric reorganization had resulted in relocation of M1 to the contralesional hemisphere, ipsilateral to the paretic hand, whereas S1 had remained in the lesioned hemisphere. This topographic dichotomy allowed for an unequivocal topographic differentiation of M1 and S1 with MEG (which is not possible if M1 and S1 are directly adjacent within one hemisphere). In all patients, β‐CMCoh originated from the contralesional M1, in accordance with the TMS‐evoked motor responses, and in contrast to the somatosensory evoked fields (SEFs) for which the sources (N20m) were localized in S1 of the lesioned hemisphere. These data provide direct evidence for the concept that β‐CMCoh reflects the motorcortical efferent drive from M1 to the spinal motoneuron pool and muscle. No evidence was found for a relevant contribution of neuronal activity in S1 to β‐CMCoh. Hum Brain Mapp, 2006. © 2006 Wiley‐Liss, Inc.
Keywords: corticospinal, pyramidal tract, plasticity, somatosensory cortex, motor cortex, stroke, congenital hemiparesis, cerebral palsy, MEG, TMS
INTRODUCTION
Frequency coding of information in neurons has gained considerable interest over the past years. In sensorimotor neurophysiology, a fundamental question relates to the coupling of cortical activity and motor output and whether frequency coding can be instrumental for the motor cortex (M1) to control muscle activity. One recent approach to address this issue is the analysis of corticomuscular coherence [CMCoh; Conway et al.,1995]. CMCoh is thought to reflect corticospinal activity during motor behavior and has its spectral maximum in the β‐frequency range (14–30 Hz) both in humans [Gross et al.,2001; Kilner et al.,2000; Mima et al.,2000, 2001a] and in nonhuman primates [Baker et al.,1997]. It can be detected by techniques such as electroencephalography (EEG), magnetoencephalography (MEG), and electrocorticography (ECoG), and has thus been validated across methods and species. As movement is accompanied regularly by reafferent feedback, it has been questioned whether β‐CMCoh reflects motor output exclusively (efferent corticospinal activity) or a combination of motor output and reafferent feedback signaling. β‐CMCoh relates to specific motor parameters [Kilner et al.,2000], and Mima et al. [2000] found that vibratory stimulation of a muscle tendon during tonic contraction had no effect on β‐CMCoh. They concluded that β‐CMCoh is rather independent from somatosensory activity. β‐CMCoh was reduced, however, in a patient with total loss of touch, vibration, pressure, and kinesthetic sensation below the neck [Kilner et al.,2004] and during ischemic nerve block in healthy subjects [Fisher et al.,2002; Pohja and Salenius,2003]. Nevertheless, largely based on MEG source‐modeling data and physiological considerations, it has become “consensus” that the oscillatory activity that can be recorded in EMG of hand and forearm muscles originates mainly in the hand area of M1 [Gross et al.,2000; Hari and Salenius,1999; Kilner et al.,1999, 2000; Salmelin and Hari,1994]. From a methodological point of view, a main difficulty is that M1 and the primary somatosensory cortex (S1) are closely adjacent. Even with whole‐head MEG, two β‐CMCoh sources located within few millimeters in Brodmann areas 4 (M1) and 3 (S1) cannot be safely distinguished if they are active simultaneously and with similar neuronal firing patterns. Considering these limitations and the reduction of coherence after peripheral deafferentation, it is fair to propose that somatosensory afferent processing in S1 might as well contribute to the cortical oscillatory signal of β‐CMCoh. In this context, two more observations are relevant. First, corticomuscular coherence has also been reported in lower frequencies [Mima et al.,2000] including the α band (∼10 Hz), which at the cortical level is thought to reflect sensory rather than motor processing [Hummel and Gerloff,2005; Salmelin et al.,1995]. Second, analyses of corticomuscular latencies (phase) have yielded inconsistent results [Mima et al.,2000; Panzica et al.,2003; Raethjen et al.,2002; Salenius et al.,1997], which could be explained in part by an overlap of efferent and afferent signals. For example, based on β‐CMCoh phase computations, Brown et al. [1998] reported latencies of 2–8 ms for signal coupling between cortex and a hand muscle and 19–25 ms from cortex to leg. Assuming that β‐CMCoh is mediated by fast‐conducting corticospinal connections, these values are incompatible with the known conduction latencies of motor evoked potentials (fast corticospinal fibers) that are in the range of 20 ms for hand and 28–30 ms for distal leg muscles.
One possibility that would enable us to provide further evidence for the generation of β‐CMCoh in M1 is a situation in which the origin of corticospinal motor control (M1) and the site of reafferent feedback processing (S1) are far enough apart to be safely distinguished topographically. In this case, the mere location of the β‐CMCoh maximum in the brain would help to identify its origin in M1 or S1.
In the present work, we report on three hemiparetic patients in whom such a dichotomy of M1 and S1 in the two hemispheres had occurred after pre‐ and perinatally acquired lesions. The subjects were recruited from a cohort of patients with pre‐ and perinatal lesions on which a clinical report, functional magnetic resonance imaging (fMRI) data, and transcranial magnetic stimulation (TMS) data have been published previously by our group [Staudt et al.,2002, 2004]. In this particular subgroup, fMRI showed bilateral activation of the rolandic sensorimotor region (M1 and S1) during movements of the paretic hand, but TMS revealed that corticospinal control was exerted from the contralesional hemisphere, i.e., from the M1 ipsilateral to the moving hand. In these patients, we now studied β‐CMCoh and somatosensory evoked fields (SEFs). The main goal of the present study was to provide direct experimental evidence for the current consensus that β‐CMCoh is generated in M1.
PATIENTS AND METHODS
Patients
Three patients participated in the study after giving written informed consent. The protocol was approved by the local ethics committee (Ethik‐Kommission der Medizinischen Fakultaet der Eberhard‐Karls‐Universitaet, Tuebingen). All patients had right hemiparesis. The clinical data including a hand motor score are given in Table I.
Table I.
Clinical data
| Patient | Gender | Age (yr) | Side of hemiparesis | Type of lesion | Hand motor impairment/MM |
|---|---|---|---|---|---|
| 1 | Female | 21 | Right | Left PVles | 2/+ |
| 2 | Male | 21 | Right | Left schizencephaly (closed‐lip) | 2/+ |
| 3 | Female | 25 | Right | Left PVles | 2/+ |
Hand motor impairment of 2 corresponds to slow/incomplete performance of sequential finger movements in a video‐documented standardized neurological examination (cf. Staudt et al.,2002). Pvles, periventricular lesion; MM, mirror movements; 1, normal performance; 3, inability to perform any independent finger movements; +, present.
Magnetic Resonance Imaging
All scans were obtained from a 1.5 Tesla Siemens Vision scanner (Siemens, Erlangen, Germany). Structural images were obtained as axial dual turbo spin‐echo slices (repetition time [TR] = 4,800 ms; echo time [TE] = 14 and 85 ms] and as 3D datasets consisting of 128 contiguous sagittal T1‐weighted slices (TR = 9.7 ms; inversion time [TI] = 300 ms; TE = 4 ms). The structural T2‐weighted MR scans of the three patients are given in Figure 1. The 3D images with fiducial markers (nasion, left and right preauricular points) were used for coregistration of magnetic sources with individual anatomy.
Figure 1.
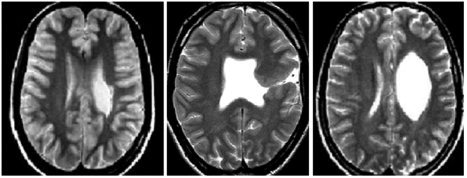
T2‐weighted structural MRI of the three patients (Patients 1–3 from left to right).
Transcranial Magnetic Stimulation
For TMS, a Magstim 200 Stimulator (The Magstim Company Ltd., Whitland, Wales, UK) with a focal 2 × 70 mm figure‐of‐eight coil was used. Motor evoked potentials (MEPs) were recorded with a Nicolet Viking IV D EMG unit (Nicolet Biomedical Instruments, Madison, WI). EMG was digitized at 10 kHz, high‐pass filtered at 100 Hz, and low‐pass filtered at 5 kHz (these values apply to the TMS part of the study only; different settings were used for EMG recordings in the MEG to compute corticomuscular coherence). MEPs were recorded simultaneously from relaxed finger extensors (M. extensor digitorum; ED) of both hands using surface EMG electrodes 5 cm apart.
Both hemispheres were searched for stimulation points eliciting contralateral or ipsilateral MEPs. The optimal points (OP = scalp position where a reproducible muscle response was elicited with the lowest stimulation intensity) and motor thresholds (MT = minimum stimulation intensity that produces five MEPs >50 μV in 10 trials) were determined. Latencies were measured from a superposition of three traces from consecutive stimulations over OP at 110% of MT.
The absence of responses was documented by stimulation with 200% MT or 100% stimulator output at the OP for the contralateral response, and at positions 1 cm and 2 cm anteriorly, posteriorly, laterally, and medially (“grid‐like”). Because no MEPs could be elicited by stimulation of the lesioned hemisphere in any of the three patients, these stimulation positions were centered around a point analogous to the OP of the contralateral, contralesional hemisphere. This corresponded to the anatomically identified central region in the patients with periventricular lesions (PVles) in whom structural MRI had revealed a preserved gyral anatomy in the lesioned hemisphere. In the patient with schizencephaly (closed‐lip), the brain malformation rendered an anatomical identification of the central sulcus impossible and MEPs were searched systematically over a wider range from frontal to parietal locations.
Magnetoencephalography
For the study of SEFs, tactile stimulation was applied to the left and right thumb in subsequent runs with an inflatable diaphragm that generated a short and distinct sensation (BTI, San Diego, CA). Stimulus duration was 50 ms and the interstimulus interval varied randomly between 0.5 and 0.75 s. Five hundred epochs of stimulus‐locked magnetic brain activity were collected using a whole‐head magnetoencephalograph (151‐channel Omega; VSM, Vancouver, Canada) with a digitization frequency of 625 Hz and a low‐pass filter of 208 Hz. To obtain the N20m response, averaged signals were filtered off‐line using a high‐pass of 10 Hz. In Patient 2, the epicritic pathway for the (right) hand contralateral to the lesioned hemisphere was impaired. Electrical stimuli of 0.1‐ms duration and with intensities of 3× the sensory threshold were thus applied in this patient. Patient 3 also had a sensory deficit, but evoked responses of characteristic topography could be obtained with mechanic stimulation. Source localization was carried out based on a spherical head model derived from MRI scans using a single equivalent dipole. A coordinate system was defined by three fiducials (nasion, left and right preauricular points) to specify spatial locations of neural activity. The origin of the coordinate system was halfway between the left and right preauricular point. The x‐axis was defined by the nasion. The y‐axis was located in plane of the fiducial points, orthogonal to the x‐axis, and pointed toward the left hemisphere. The z‐axis was orthogonal to x and y and pointed toward the vertex.
For calculation of CMCoh, EMG and MEG were recorded simultaneously (Omega; VSM). Patients sat on a comfortable chair with their arms placed on a rest and produced a precision grip by opposing thumb (D I) and index finger (D II) of the right or left hand. Subjects had to generate a grip force of 1 N (isometric contraction) that was measured by a strain gauge whose output was recorded and fed back to the subjects by a visual signal every 12 s for 2 s. To this effect, the force generated by the subjects controlled the extent of a white rectangle that was projected onto a screen in the shielded room using a video beamer. As a reference, a black rectangle was presented that corresponded to a force of 1 N.
Magnetic brain activity and EMG were recorded during 25 intervals of 10.5‐s duration interspersed between presentations of the visual feedback signals. EMG activity was recorded from four pairs of electrodes (In Vivo Metric, Healdsburg, CA) placed on the thenar (M. abductor pollicis brevis; APB) and forearm (M. extensor digitorum; ED) bilaterally. ED was recorded additionally because during D I–D II precision grip this muscle exerts a stabilizing effect on wrist and fingers D III–D V. Further, ED was used to have MEG–EMG data from the same muscle from which TMS‐induced MEPs had been recorded previously. Raw EMG signals were band‐pass filtered with lower and upper frequencies of 0.1 and 104 Hz, amplified, and digitized with a sampling rate of 312.5 Hz. MEG signals were recorded with the same filter settings and digitization rate as used for the simultaneously recorded EMG (sampling rate, 312.5 Hz; recording low‐pass, 104 Hz). Grip force, EMG, and MEG data were recorded simultaneously and stored in the same dataset. During the experiment, patients looked at a fixation cross presented on the screen in front of them. As an example, power spectra of EMG and MEG activity of Patient 2 are presented in Figure 2.
Figure 2.
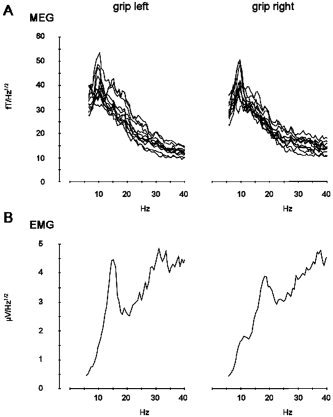
Power spectra of muscular and cortical activity for Patient 2. A: Power spectra of MEG activity over the right M1 during precision grip with the nonaffected (left) and paretic (right) hand. Spectra of channels with maximal power representing neuronal activity in M1 are superimposed. B: EMG spectra for grip with the nonaffected (left) and paretic (right) hand. Frequencies from 1–40 Hz are displayed.
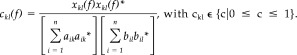
The analysis of the CMCoh involved the following steps: (1) segmentation of the data stream in 150 epochs of 1.6384‐s duration corresponding to 512 data points per interval; (2) offset removal for all channels; (3) rectification of the EMG signal; (4) calculation of the complex spectra a ik(f) for frequencies 0 ≤ f ≤ 104 Hz for MEG channels k, epoch i using a fast Fourier transformation after windowing the time epoch using a Bartlett window. (5) Likewise, spectra b il(f) were calculated for EMG channel l. Due to the segment length of 1. 6384 s, frequency resolution was 0.61 Hz. (6) Calculation of the cross‐product between MEG and EMG spectra according to
| (1) |
where b il(f)* denotes the complex conjugate of b il(f) and a k and b l the mean spectrum for MEG and EMG signals across trials. (7) Calculation of the coherence between MEG channel k and EMG channel l according to
 |
(2) |
(8) Defining the significance level according to
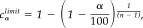 , where n is the number of epochs [Rosenberg et al.,1989]. In the present study, a confidence probability α of 95% was chosen, resulting in a confidence limit C of 0.020. For the presentation of coherence maps, all coherence values below this limit were set to zero. (9) The cortical generator of coherence was determined by dipole source modeling based on the cross‐spectrum. Representing real and imaginary parts of coherence values of all channels in the complex plane yields a straight line for a single source assuming the absence of noise. The MEG system used in the present study has axial gradiometers; therefore, a single source of coherence reveals a phase shift of 180 degrees for channels picking up in‐going magnetic activity on the one hand and the outgoing magnetic field on the other hand. To determine the topography of coherence in the presence of noise, singular value decomposition was used.
The coherence analysis was focused on the β frequency range for three reasons: (1) several previous studies have pointed to maximal corticomuscular coupling between 14 Hz and 30 Hz [Baker et al.,1997; Gross et al.,2001; Kilner et al.,2000; Mima et al.,2000]; (2) the coherence spectra obtained in our patients confirmed these previous observations also showing maximal values between 13 Hz and 30 Hz; and (3) a dipolar coherence topography representing a local cortical source of coherence was only seen in this frequency range in our group of patients.
RESULTS
Stimulation of M1 (TMS)
TMS revealed ipsilateral MEPs on stimulation of the contralesional hemisphere in all patients. The ipsilateral MEPs occurred simultaneously and at similar latencies with MEPs elicited in the nonparetic hand from this position. The difference in latencies between contralateral and ipsilateral responses was below 1 ms. The latencies and motor thresholds for the ipsilateral and contralateral MEPs are given in Table II. No MEPs were obtained with stimulation of the grid positions in the lesioned hemisphere centered around the homologue of the optimal point for stimulating the finger extensors in the contralesional hemisphere.
Table II.
Summary of individual TMS results
| Patient | MEP latency (msec) | MT (% stimulator output) | ||||
|---|---|---|---|---|---|---|
| Lesioned hemisphere (left) | Contralesional hemisphere (right) | Lesioned hemisphere (left) | Contralesional hemisphere (right) | |||
| Paretic hand (right) | Paretic hand (right) | Non‐paretic hand (left) | Paretic hand (right) | Paretic hand (right) | Non‐paretic hand (left) | |
| 1 | — | 17.2 | 17.6 | — | 45 | 45 |
| 2 | — | 16.3 | 17.0 | — | 40 | 43 |
| 3 | — | 16.3 | 17.1 | — | 44 | 55 |
MEP, motor evoked potential elicited by TMS; MT, resting motor threshold; —, no response.
Somatosensory Evoked Fields
Somatosensory (mechanical and electrical) stimulation resulted in SEFs with a topography comparable to normal subjects in all patients. In Patient 2, the latency of the N20m was prolonged on stimulation of the paretic (right) hand (35.2 ms vs. 20.8 ms for the left hand). This patient suffered clinically from a sensory deficit of light touch perception. The characteristic field distribution of the N20m in all patients allowed for reliable source reconstructions. In all recordings, the N20m corresponded to the first prominent peak after the stimulus artifact. The waveforms and topographic maps are shown in Figure 3, the 3D source reconstructions in Figure 4. The N20m latencies and coordinates of the SEF sources are given in Table III. In all patients, the SEF generators for stimulation of the paretic hand were located in the lesioned hemisphere. The primary motor (M1; identified by TMS) and somatosensory (S1; identified by MEG) representations of the paretic hand thus were located in opposite hemispheres in all three patients. For stimulation of the nonparetic hand, the SEF generators were also located contralaterally, i.e., in the S1 of the contralesional hemisphere.
Figure 3.
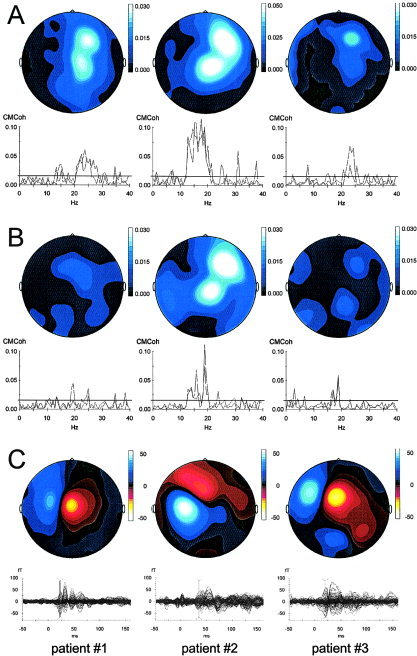
Summary of β‐CMCoh and N20m results for the three patients (Patients 1–3 from left to right; paretic hand). A: β‐CMCoh for the ED muscle. Topographic maps are presented in the top row, coherence spectra below. The bipolar configuration of the two current maxima (map) indicates 180‐degree phase reversal of inward and outward currents and facilitates robust modeling of the coherent sources. In other words, the two maxima correspond to “sink” and “source” of the electromagnetic field generated in M1. This configuration is characteristic for data obtained with radial gradiometers (Omega MEG system; VSM, Vancouver, Canada). Coherence spectra are plotted for two representative channels. The horizontal line in the coherence spectral plots denotes the statistical 95% confidence limit. Coherence values above this level are considered significant. B: β‐CMCoh for the APB muscle. Same conventions as in A. C: Topography of the N20m components (upper row) and butterfly plots of the individual evoked magnetic responses (bottom row). The red vertical lines indicate the latency of the map and source reconstruction. In the topographic maps, red corresponds to inward currents, blue to outward currents. For mapping, data were normalized and the units (−50 to 50) are arbitrary.
Figure 4.
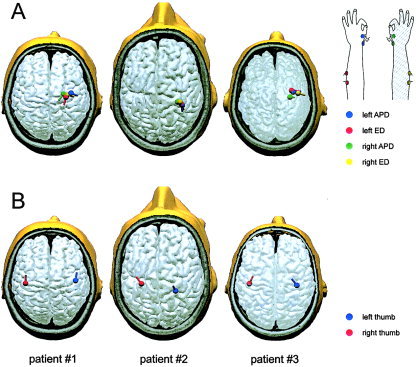
Summary of β‐CMCoh and N20m source reconstructions coregistered with individual anatomy (structural MRI). A: All sources of corticomuscular coupling (β‐CMCoh) were located in the rolandic region of the contralesional hemisphere. No coherence was detected between muscles of the paretic upper limb and the lesioned hemisphere. The sources are represented by the colored dipoles. The color code is given in the insert on the lower right. B: The generators of the N20m were located in the primary somatosensory cortex (S1) contralateral to the hand stimulated, i.e., the N20m source for the paretic hand was located in the lesioned hemisphere in contrast to the source of β‐CMCoh for the same hand, which was located in the primary motor cortex (M1) of the contralesional hemisphere. Note the clear dissociation of M1 and S1 representations of the paretic upper limb in opposite hemispheres. The location of M1 in the contralesional hemisphere was confirmed by transcranial magnetic stimulation.
Table III.
Summary of individual responses to sensory stimulation in the MEG
| Patient | Side of sensory stimulation | SEF latency (msec) | SEF dipole coordinates (cm), x, y, z |
|---|---|---|---|
| 1 | Left | 22.4 | 1.64, −4.42, 9.07 |
| Right | 22.4 | 1.27, 3.71, 10.28 | |
| 2 | Left | 20.8 | 0.21, −2.55, 9.46 |
| Right | 35.2 | 2.00, 2.84, 10.00 | |
| 3 | Left | 23.4 | 4.87, −4.09, 9.67 |
| Right | 20.2 | 5.07, 3.67, 10.23 |
The latencies and coordinates refer to the N20m component. In Patients 1 and 3, the N20m could be reliably elicited by tactile stimulation with a pneumatic diaphragm; in Patient 2 electrical stimulation had to be applied, most likely because of the more pronounced epicritic sensory deficit in this patient. SEF, somatosensory evoked field.
Average goodness of fit for source localization was 94.8 ± 4.8%.
Corticomuscular Coherence
In all patients, significant β‐CMCoh between the EMG of the ED or APB muscle of the paretic hand and cortical oscillatory activity was found. In Patient 1, the maximum occurred at 20–26 Hz, in Patient 2 at 15–21 Hz, and in Patient 3 at 18–24 Hz. For movement of the nonparetic hand, β‐CMCoh was similar (18–29 Hz in Patient 1, 14–18 Hz in Patient 2, and 18–25 Hz in Patient 3) to that observed with contraction of the paretic hand. The amplitude of β‐CMCoh did not differ systematically for paretic and intact hands in Patients 2 and 3. Patient 1 showed a reduction of β‐CMCoh for the paretic compared with the nonparetic hand. Details are given in Table IV. In all patients, significant β‐CMCoh occurred across multiple frequency bins for the ED muscle. For the APB muscle, β‐CMCoh was well above significance level for Patient 2 and above significance level only in a small number of frequency bins in Patients 1 and 3.
Table IV.
Summary of individual results of MEG‐EMG coherence analysis (β‐CMCoh)
| Patient | Site of EMG recording | Frequency of significant coherence (Hz) | Amplitude of significant coherence (× 10−3) | Coherence source coordinates (cm), x, y, z |
|---|---|---|---|---|
| Target muscle to right hemisphere | ||||
| 1 | Left APB | 18.3–25.6 | 16.62 | 2.35, −3.75, 10.16 |
| Left ED | 21.4–28.7 | 20.04 | 1.61, −2.92, 10.05 | |
| Right APB | 22.0–26.2 | 2.26 | 2.05, −2.47, 9.71 | |
| Right ED | 19.5–24.4 | 10.60 | 1.95, −3.08, 9.88 | |
| 2 | Left APB | 14.0–17.7 | 6.37 | 0.74, −3.54, 9.80 |
| Left ED | 14.6–18.3 | 28.83 | 0.82, −3.48, 9.78 | |
| Right APB | 17.7–20.8 | 14.25 | 1.19, −2.89, 9.69 | |
| Right ED | 14.6–20.8 | 29.10 | 1.32, −3.24, 9.95 | |
| 3 | Left APB | 19.5–25.0 | 5.70 | 3.80, −2.25, 10.36 |
| Left ED | 17.7–23.8 | 6.16 | 4.06, −1.97, 10.33 | |
| Right APB | 17.7–21.4 | 1.99 | 1.86, −1.97, 7.96 | |
| Right ED | 22.0–24.4 | 9.44 | 3.48, −3.06, 10.18 |
The frequency range of significant β‐CMCoh refers to coherence exceeding the 95% confidence limit. Significant coherence is consistently present in the β‐frequency range. There was no systematic difference between frequency characteristics of β‐CMCoh for the paretic and non‐paretic hands. The negative y‐values for all generators indicate location in the same hemisphere.
Reconstruction of the coherent sources for movement of the paretic hand revealed locations in the contralesional (ipsilateral) hemisphere in all three patients. For movement of the nonparetic hand, the location of the coherent sources was contralateral, i.e., in the same region as the location for movement of the paretic hand. There was no systematic difference in the locations of β‐CMCoh generators for the ipsilateral and contralateral limb. On average, the generators of β‐CMCoh for the ED and APB were located within 5 mm relative to each other. The coherence spectra are shown in Figure 3, the 3D source reconstructions in Figure 4. The average goodness‐of‐fit for the localization of the coherence sources was 91.6 ± 4.8%. The time lag between brain and muscular bursts of activity can be calculated by deriving the phase of the complex coherence
| (3) |
across frequency
 in the interval showing significant coherence [Mima et al.,2000]. A frequency range of adjacent significant coherences large enough to obtain stable latencies with this algorithm was obtained only for left and right ED of Patient 2. Calculations of time lag thus were only done exemplarily in this patient. The time difference with which bursts of cortical activity preceded the muscular reaction was 9.3 ms for the affected right and 9.0 ms for the unaffected left hand.
DISCUSSION
The main result of the present study was that corticomuscular coupling occurs between M1 and effector muscle with no relevant contribution of S1. This observation was made possible by the unique brain reorganization that had occurred in three patients with pre‐ or perinatally acquired lesions of the pyramidal tract [Staudt et al.,2002]. In these patients, the motor representation of the paretic hand in M1 was located with TMS in the ipsilateral (contralesional) hemisphere, whereas the somatosensory representation of the paretic hand in the S1 had remained in the lesioned hemisphere as revealed by MEG SEFs. This data provides direct evidence that β‐CMCoh represents efferent corticospinal activity and not reafferent feedback processing.
The present findings are noteworthy, in light of the considerations described in the introduction, in particular with respect to the known reduction of β‐CMCoh during deafferentation [Fisher et al.,2002; Kilner et al.,2004; Pohja and Salenius,2003] and the surprising results of phase (latency) calculations [Brown et al.,1998; Mima et al.,2000; Patient 2 of this study]. Despite the consensus that β‐CMCoh arises from M1 [Gross et al.,2000; Hari and Salenius,1999; Kilner et al.,1999, 2000; Salmelin and Hari,1994], experimental data available so far have left open the possibility that oscillatory neuronal activity related to somatosensory afferent feedback processing in S1 directly participates in the generation of the complex oscillatory compound signal used to compute β‐CMCoh. The present results render this conjecture highly unlikely and provide experimental evidence against S1 involvement.
There is a conceptual caveat with any functional imaging results obtained from patients with chronic lesions (lesion studies), which also applies to the present data. The central nervous systems of our patients had undergone substantial neuroplastic reorganization and this might change the neurophysiological properties of the sensorimotor system to an extent that questions inferences made on normal physiology. The present data show that M1 can generate β‐CMCoh without relevant contribution of S1. It remains possible that in healthy subjects a tightly interconnected M1–S1 network generates the cortical oscillatory signal relevant for β‐CMCoh. Although this cannot be ruled out completely, it seems improbable. In our patients, corticomuscular coupling exhibited the typical frequency and amplitude characteristics as seen with β‐CMCoh in normal subjects. The TMS results document normal latencies and motor thresholds for the reorganized M1 in all three patients and the MEG indicates normal N20m latencies in two patients. Finally, to invalidate our data one would need to speculate that an M1 that has reorganized because of a lesion becomes more relevant for corticomuscular coupling than a normal M1 in healthy subjects, and this seems very unlikely.
Representation of S1 in the Lesioned Hemisphere Contralateral to the Paretic Limb
The N20m of SEFs has been used extensively to locate S1 in healthy subjects [Braun et al.,2001; Hoshiyama et al.,1997; Wikstrom et al.,1997] and neurological patients [Braun et al.,2003; Maclin et al.,1994]. In healthy subjects, the N20m source is located in the posterior bank of the central sulcus (Brodmann area 3) contralateral to the stimulated limb. Compared with the generators of movement‐evoked reafferent fields (sometimes referred to as post‐MF, i.e., post‐movement field), the location of the N20m is very similar, e.g., within 5–6 mm inside the S1 [Gerloff et al.,1998]. Likewise, contralateral locations of magnetic sources in S1 have been described for passive finger movements [Xiang et al.,1997]. In the present study, we opted to use tactile stimulation rather than passive movements because in patients with central motor deficits including elevated muscle tone or spasticity, passive movements almost always induce muscular contraction so that the somatosensory task is contaminated by motor cortical activity.
Patients 2 and 3 had impaired sensory function on clinical examination; Patient 2 had a delayed N20m responses of the SEF. The N20m source could be detected reliably for both patients inside the lesioned hemisphere, however, and it seems thus unlikely that these abnormalities confound our major point of interest, i.e., the localization of S1 and M1 in different hemispheres. It cannot be ruled out that delayed conduction of the reafferent signals from the hand interferes with normal corticomuscular coupling. In this case, an amplitude reduction of corticomuscular coherence would be expected [Fisher et al.,2002; Kilner et al.,2004; Pohja and Salenius,2003]. The coherence amplitudes were not altered systematically in these patients; only Patient 1 showed a consistent amplitude reduction for the paretic hand and this patient had no sensory deficit and normal N20m latencies.
Representation of M1 in the Contralesional Hemisphere Ipsilateral to the Paretic Limb
All three patients had acquired a lesion of the pyramidal tract during early brain development. In contrast to the limited reorganization of the corticospinal tract in adult patients suffering from acute stroke, at this early stage of development ipsilateral corticospinal tract fibers can be recruited effectively [Carr et al.,1993; Eyre et al.,2001; Staudt et al.,2002, 2004]. This early capacity for extensive reorganization allowed for a shift of the M1 representations of the paretic limb in our patients into the contralesional hemisphere. We used TMS to identify the motor representations in both hemispheres [Cohen et al.,1991], and despite searching a grid of approximately 4 × 4 cm over both hemispheres at suprathreshold intensity up to 100% of stimulator output, corticospinal responses in the paretic hand could only be elicited by stimulation over the M1 of the contralesional hemisphere. In line with this, the sources of β‐CMCoh as a surrogate marker of corticospinal coupling during voluntary motor action of the paretic hand were located in the contralesional hemisphere, i.e., in the M1 ipsilateral to the moving limb. This is in contrast to β‐CMCoh in healthy subjects [Baker et al.,1997; Halliday et al.,1998; Kilner et al.,2000; Mima and Hallett,1999] and in patients who suffered from subcortical stroke later in life [Mima et al.,2001b]. The frequency characteristics and coherence amplitudes were similar for movement of the paretic and nonparetic hand in our patients. In addition, the signal‐to‐noise ratio was comparable, which makes it unlikely that the validity of source reconstruction was hampered by artifacts.
During voluntary movement of the paretic hand, patients with congenital lesions of the corticospinal tract tend to show involuntary co‐contractions of the contralateral hand. These co‐contractions have been recognized as a problem when bilateral M1 activity is observed with neuroimaging studies like positron emission tomography (PET) or functional MRI in patients with brain lesions [Weiller et al.,1993]. Bilateral M1 activity during bilateral movement cannot be interpreted easily as evidence for plastic reorganization. In the present study, β‐CMCoh analysis revealed functional coupling strictly between paretic hand muscles and the ipsilateral M1. Bilateral coupling to both hemispheres was not present. In addition, neither the TMS nor the SEF data would be affected by involuntary co‐contractions, as both techniques were applied at rest. Involuntary co‐contractions during voluntary movement of the paretic hand thus cannot be a relevant confound in the present study.
Functional Implications for the Understanding of Corticomuscular Coherence
The functional meaning of coherence between oscillatory cortical and muscular activity has been under debate [Fisher et al.,2002; Kilner et al.,2000, 2004; Mima et al.,2000]. An interesting question is whether β‐CMCoh truly reflects interaction between the M1 and the spinal motoneuronal pool, or if it could be significantly influenced by reafferent feedback processing and its neuronal correlates, i.e., oscillatory activity in S1. This is of considerable interest because if β‐CMCoh were influenced by oscillatory activity in S1, its alterations in pathological conditions such as Parkinson's disease [Caviness et al.,2003], myoclonus [Grosse et al.,2003; Panzica et al.,2003], or dystonia [Cordivari et al.,2002] would have to be interpreted differently. As has been pointed out by various authors [Fisher et al.,2002; Kilner et al.,2004] and is pervasive in several experiments on corticomuscular coherence [Kilner et al.,2000; Salmelin and Hari,1994], it is much more likely that sensory feedback has a modulating influence on corticomuscular coupling, but that neurons in S1 do not generate the relevant oscillatory signals coherent with muscle activity. In this sense, our results provide direct experimental support for a concept that had hitherto largely emerged as a logical interpretation of available data. What remains an open question and cannot be answered based on the present data is the validity of phase lag computations for β‐CMCoh. The approaches used in various studies including the technique used here exemplarily in Patient 2 do not consistently provide latencies that match the latencies of stimulation‐evoked motor potentials in hand muscles. The latencies obtained seem rather to correspond to central motor conduction times (∼9 ms as in our Patient 2). This needs further investigation.
Acknowledgements
This work was supported by the Deutsche Forschungsgemeinschaft (DFG), as a collaboration of the projects C4, C5, and C6 of the Sonderforschungsbereich 550.
Contributor Information
Christian Gerloff, Email: christian.gerloff@uni-tuebingen.de.
Christoph Braun, Email: christoph.braun@uni-tuebingen.de.
REFERENCES
- Baker SN, Olivier E, Lemon RN ( 1997): Coherent oscillations in monkey motor cortex and hand muscle EMG show task‐dependent modulation. J Physiol (Lond) 501: 225–241. [DOI] [PMC free article] [PubMed] [Google Scholar]
- Braun C, Heinz U, Schweizer R, Wiech K, Birbaumer N, Topka H ( 2001): Dynamic organization of the somatosensory cortex induced by motor activity. Brain 124: 2259–2267. [DOI] [PubMed] [Google Scholar]
- Braun C, Schweizer R, Heinz U, Wiech K, Birbaumer N, Topka H ( 2003): Task‐specific plasticity of somatosensory cortex in patients with writer's cramp. Neuroimage 20: 1329–1338. [DOI] [PubMed] [Google Scholar]
- Brown P, Salenius S, Rothwell JC, Hari R ( 1998): Cortical correlate of the Piper rhythm in humans. J Neurophysiol 80: 2911–2917. [DOI] [PubMed] [Google Scholar]
- Carr LJ, Harrison LM, Evans AL, Stephens JA ( 1993): Patterns of central motor reorganization in hemiplegic cerebral palsy. Brain 116: 1223–1247. [DOI] [PubMed] [Google Scholar]
- Caviness JN, Adler CH, Sabbagh MN, Connor DJ, Hernandez JL, Lagerlund TD ( 2003): Abnormal corticomuscular coherence is associated with the small amplitude cortical myoclonus in Parkinson's disease. Mov Disord 18: 1157–1162. [DOI] [PubMed] [Google Scholar]
- Cohen LG, Bandinelli S, Topka HR, Fuhr P, Roth BJ, Hallett M ( 1991): Topographic maps of human motor cortex in normal and pathological conditions: mirror movements, amputations and spinal cord injuries. Electroencephalogr Clin Neurophysiol Suppl 43: 36–50. [PubMed] [Google Scholar]
- Conway BA, Halliday DM, Farmer SF, Shahani U, Maas P, Weir AI, Rosenberg JR ( 1995): Synchronization between motor cortex and spinal motoneuronal pool during the performance of a maintained motor task in man. J Physiol (Lond) 489: 917–924. [DOI] [PMC free article] [PubMed] [Google Scholar]
- Cordivari C, Lees AJ, Misra VP, Brown P ( 2002): EMG–EMG coherence in writer's cramp. Mov Disord 17: 1011–1016. [DOI] [PubMed] [Google Scholar]
- Eyre JA, Taylor JP, Villagra F, Smith M, Miller S ( 2001): Evidence of activity‐dependent withdrawal of corticospinal projections during human development. Neurology 57: 1543–1554. [DOI] [PubMed] [Google Scholar]
- Fisher RJ, Galea MP, Brown P, Lemon RN ( 2002): Digital nerve anaesthesia decreases EMG–EMG coherence in a human precision grip task. Exp Brain Res 145: 207–214. [DOI] [PubMed] [Google Scholar]
- Gerloff C, Uenishi N, Nagamine T, Kunieda T, Hallett M, Shibasaki H ( 1998): Cortical activation during fast repetitive finger movements in humans: steady‐state movement‐related magnetic fields and their cortical generators. Electroencephalogr Clin Neurophysiol 109: 444–453. [DOI] [PubMed] [Google Scholar]
- Gross J, Kujala J, Hamalainen M, Timmermann L, Schnitzler A, Salmelin R ( 2001): Dynamic imaging of coherent sources: Studying neural interactions in the human brain. Proc Natl Acad Sci U S A 98: 694–699. [DOI] [PMC free article] [PubMed] [Google Scholar]
- Gross J, Tass PA, Salenius S, Hari R, Freund HJ, Schnitzler A ( 2000): Cortico‐muscular synchronization during isometric muscle contraction in humans as revealed by magnetoencephalography. J Physiol 527: 623–631. [DOI] [PMC free article] [PubMed] [Google Scholar]
- Grosse P, Guerrini R, Parmeggiani L, Bonanni P, Pogosyan A, Brown P ( 2003): Abnormal corticomuscular and intermuscular coupling in high‐frequency rhythmic myoclonus. Brain 126: 326–342. [DOI] [PubMed] [Google Scholar]
- Halliday DM, Conway BA, Farmer SF, Rosenberg JR ( 1998): Using electroencephalography to study functional coupling between cortical activity and electromyograms during voluntary contractions in humans. Neurosci Lett 241: 5–8. [DOI] [PubMed] [Google Scholar]
- Hari R, Salenius S ( 1999): Rhythmical corticomotor communication. Neuroreport 10: R1–10. [PubMed] [Google Scholar]
- Hoshiyama M, Kakigi R, Koyama S, Watanabe S, Shimojo M ( 1997): Activity in posterior parietal cortex following somatosensory stimulation in man: magnetoencephalographic study using spatio‐temporal source analysis. Brain Topogr 10: 23–30. [DOI] [PubMed] [Google Scholar]
- Hummel F, Gerloff C ( 2005): Larger interregional synchrony is associated with greater behavioral success in a complex sensory integration task in humans. Cereb Cortex 15: 670–678. [DOI] [PubMed] [Google Scholar]
- Kilner JM, Baker SN, Salenius S, Hari R, Lemon RN ( 2000): Human cortical muscle coherence is directly related to specific motor parameters. J Neurosci 20: 8838–8845. [DOI] [PMC free article] [PubMed] [Google Scholar]
- Kilner JM, Baker SN, Salenius S, Jousmaki V, Hari R, Lemon RN ( 1999): Task‐dependent modulation of 15‐30 Hz coherence between rectified EMGs from human hand and forearm muscles. J Physiol 516: 559–570. [DOI] [PMC free article] [PubMed] [Google Scholar]
- Kilner JM, Fisher RJ, Lemon RN ( 2004): The coupling of oscillatory activity between muscles is strikingly reduced in a deafferented subject compared with normal controls. J Neurophysiol 92: 790–796. [DOI] [PubMed] [Google Scholar]
- Maclin EL, Rose DF, Knight JE, Orrison WW, Davis LE ( 1994): Somatosensory evoked magnetic fields in patients with stroke. Electroencephalogr Clin Neurophysiol 91: 468–475. [DOI] [PubMed] [Google Scholar]
- Mima T, Hallett M ( 1999): Electroencephalographic analysis of cortico‐muscular coherence: reference effect, volume conduction and generator mechanism. Clin Neurophysiol 110: 1892–1899. [DOI] [PubMed] [Google Scholar]
- Mima T, Matsuoka T, Hallett M ( 2001a): Information flow from the sensorimotor cortex to muscle in humans. Clin Neurophysiol 112: 122–126. [DOI] [PubMed] [Google Scholar]
- Mima T, Steger J, Schulman AE, Gerloff C, Hallett M ( 2000): Electroencephalographic measurement of motor cortex control of muscle activity in humans. Clin Neurophysiol 111: 326–337. [DOI] [PubMed] [Google Scholar]
- Mima T, Toma K, Koshy B, Hallett M ( 2001b): Coherence between cortical and muscular activities after subcortical stroke. Stroke 32: 2597–2601. [DOI] [PubMed] [Google Scholar]
- Panzica F, Canafoglia L, Franceschetti S, Binelli S, Ciano C, Visani E, Avanzini G ( 2003): Movement‐activated myoclonus in genetically defined progressive myoclonic epilepsies: EEG–EMG relationship estimated using autoregressive models. Clin Neurophysiol 114: 1041–1052. [DOI] [PubMed] [Google Scholar]
- Pohja M, Salenius S ( 2003): Modulation of cortex‐muscle oscillatory interaction by ischaemia‐induced deafferentation. Neuroreport 14: 321–324. [DOI] [PubMed] [Google Scholar]
- Raethjen J, Lindemann M, Dumpelmann M, Wenzelburger R, Stolze H, Pfister G, Elger CE, Timmer J, Deuschl G ( 2002): Corticomuscular coherence in the 6–15 Hz band: is the cortex involved in the generation of physiologic tremor? Exp Brain Res 142: 32–40. [DOI] [PubMed] [Google Scholar]
- Rosenberg JR, Amjad AM, Breeze P, Brillinger DR, Halliday DM ( 1989): The Fourier approach to the identification of functional coupling between neuronal spike trains: maximum likelihood analysis of spike trains of interacting nerve cells. Prog Biophys Mol Biol 53: 1–31. [DOI] [PubMed] [Google Scholar]
- Salenius S, Portin K, Kajola M, Salmelin R, Hari R ( 1997): Cortical control of human motoneuron firing during isometric contraction. J Neurophysiol 77: 3401–3405. [DOI] [PubMed] [Google Scholar]
- Salmelin R, Hamalainen M, Kajola M, Hari R ( 1995): Functional segregation of movement‐related rhythmic activity in the human brain. Neuroimage 2: 237–243. [DOI] [PubMed] [Google Scholar]
- Salmelin R, Hari R ( 1994): Spatiotemporal characteristics of sensorimotor neuromagnetic rhythms related to thumb movement. Neuroscience 60: 537–550. [DOI] [PubMed] [Google Scholar]
- Staudt M, Grodd W, Gerloff C, Erb M, Stitz J, Krageloh‐Mann I ( 2002): Two types of ipsilateral reorganization in congenital hemiparesis: a TMS and fMRI study. Brain 125: 2222–2237. [DOI] [PubMed] [Google Scholar]
- Staudt M, Krageloh‐Mann I, Holthausen H, Gerloff C, Grodd W ( 2004): Searching for motor functions in dysgenic cortex: a clinical TMS and fMRI study. J. Neurosurg 101( Suppl): 69–77. [DOI] [PubMed] [Google Scholar]
- Weiller C, Ramsay SC, Wise RJ, Friston KJ, Frackowiak RS ( 1993): Individual patterns of functional reorganization in the human cerebral cortex after capsular infarction. Ann Neurol 33: 181–189. [DOI] [PubMed] [Google Scholar]
- Wikstrom H, Roine RO, Salonen O, Aronen HJ, Virtanen J, Ilmoniemi RJ, Huttunen J ( 1997): Somatosensory evoked magnetic fields to median nerve stimulation: interhemispheric differences in a normal population. Electroencephalogr Clin Neurophysiol 104: 480–487. [DOI] [PubMed] [Google Scholar]
- Xiang J, Hoshiyama M, Koyama S, Kaneoke Y, Suzuki H, Watanabe S, Naka D, Kakigi R ( 1997): Somatosensory evoked magnetic fields following passive finger movement. Brain Res Cogn Brain Res 6: 73–82. [DOI] [PubMed] [Google Scholar]