Abstract
The goal of the present validation study is to show that continuous surface EMG recorded simultaneously with 3T fMRI can be used to identify local brain activity related to (1) motor tasks, and to (2) muscle activity independently of a specific motor task, i.e. spontaneous (abnormal) movements. Five healthy participants performed a motor task, consisting of posture (low EMG power), and slow (medium EMG power) and fast (high EMG power) wrist flexion–extension movements. Brain activation maps derived from a conventional block design analysis (block‐only design) were compared with brain activation maps derived using EMG‐based regressors: (1) using the continuous EMG power as a single regressor of interest (EMG‐only design) to relate motor performance and brain activity, and (2) using EMG power variability as an additional regressor in the fMRI block design analysis to relate movement variability and brain activity (mathematically) independent of the motor task. The agreement between the identified brain areas for the block‐only design and the EMG‐only design was excellent for all participants. Additionally, we showed that EMG power variability correlated well with activity in brain areas known to be involved in movement modulation. These innovative EMG‐fMRI analysis techniques will allow the application of novel motor paradigms. This is an important step forward in the study of both the normally functioning motor system and the pathophysiological mechanisms in movement disorders. Hum Brain Mapp, 2007. © 2007 Wiley‐Liss, Inc.
Keywords: simultaneous EMG‐fMRI, surface EMG power, fMRI analysis, motor paradigm
INTRODUCTION
Human brain function can be measured noninvasively using functional magnetic resonance imaging (fMRI). Normal and superfluous movements can be studied using a block design in which tasks are performed in an on/off fashion (boxcar type). Typically, brain activation maps of healthy participants and patients are compared so as to gain insight in brain areas effecting (pathological) movement. The continuous muscle activity, and thereby task performance, is however not recorded in a conventional fMRI experiment. This makes it difficult to distinguish between normal, compensatory, and pathological brain activity. Simultaneous and continuous recording of surface electromyography (EMG) and fMRI has several potential advantages in this respect. First, it will allow for the verification of motor task execution according to the design. Second, it will permit the use of EMG power (amplitude information) as a regressor in the fMRI analysis and relate spontaneous (ab)normal muscle activity to neuronal circuitry, thereby potentially providing additional information when compared with other conventional analyses.
Obtaining a reliable EMG signal during fMRI is challenging. The magnetic field gradients induce major artifacts in the EMG signal. Notwithstanding, EMG recorded during scanning has been used to determine task onsets [Oga et al., 2002; Toma et al., 1999]. MacIntosh et al. [2005] employed the onsets of EMG activity in an event‐related fMRI analysis and discussed the utility of the timing information obtained from the EMG. The EMG amplitude information was however not used. Other work of Macintosh et al., in which experiments were performed outside the scanner, indicated that there is a relationship between EMG amplitude information and extent of muscle contraction [MacIntosh et al., 2004]. EMG amplitude information obtained during short interscan intervals only was found to correlate with the fMRI signal in motor function‐related cortical fields [Dai et al., 2001; Liu et al., 2000, 2002a, b, 2003, 2004]. Recently, it has been demonstrated that EMG recordings obtained during fMRI at 3T, after application of established artifact correction methods [Allen et al., 2000], can be used to quantify muscle activity even at very low activation [van Duinen et al., 2005]. Relating the EMG amplitude information, derived from EMG obtained continuously during fMRI, to brain activity has as far as we know not been demonstrated before and is the topic of this paper.
The first aim of this validation study is to demonstrate that amplitude information from EMG recorded continuously during scanning can be used as a single regressor of interest in an fMRI analysis to identify motor circuitry––using commercially available software and MR‐compatible EMG recording equipment. Results from a conventional block design analysis are compared with results from a design based on EMG only, expecting to identify similar brain areas. This type of analysis is expected to be useful in the absence of a task design, for instance when self paced movement or unintended (pathological) muscle activity is studied.
The second aim is to relate (superfluous) movements, independent of a motor task, to brain activity. Deviations from constant task performance are a measure of pathological movement and/or irregular task performance, as seen in patients with a movement disorder. In our experimental set‐up, movement variability in healthy participants is approximated by inclusion of a fast and a slow movement task. Deviations from the mean EMG signal amplitude across fast and slow movement form the regressor that is used in the EMG‐based fMRI analysis. Because the on‐ and offsets of fast and slow movement are known, a conventional block analysis can be used to verify whether the identified brain areas are related to movement variability; the brain activation maps are expected to be similar. This experiment serves as a model for the study of hyperkinetic movements when unintended muscle activity is uncontrolled, or when occurring during a specific task.
METHODS
Participants
In this validation study, five right‐handed, as assessed by the Edinburgh Handedness Inventory [Oldfield, 1971], healthy participants were investigated (Table I for participant details). The study protocol was approved by the medical ethical committee of the University Medical Center Groningen and the participants gave informed consent.
Table I.
Participant details
| Participant | Age (yr) | Sex | Muscle |
|---|---|---|---|
| 1 | 63 | Male | RE |
| 2 | 47 | Male | RE |
| 3 | 32 | Female | RE |
| 4 | 42 | Male | RFDI |
| 5 | 33 | Male | RE |
Muscle: electrode pair used in fMRI analyses; RE: right extensor muscles; RFDI: right first dorsal interosseus muscle.
Tasks
The participants were scanned (1) during rest (no intended muscle activity), (2) during maintained posture of the right hand (“posture”; arm in pronation with extended wrist and fingers), and (3) during self‐paced flexion–extension movement of the right wrist (“movement”; arm extended with hand in vertical plane), evenly divided in “fast” movement (∼ 4 Hz), and “slow” movement (∼ 1 Hz) tasks. In rest, no EMG activity was expected, and limited EMG activity was expected during “posture.” During “movement” more EMG activity was expected, with a larger variation in amplitude corresponding with slow and fast movement. All tasks were demonstrated and practiced before scanning. During scanning, the participants were instructed to switch between tasks by visual cues. Each task block lasted for 30 s and was repeated either six times (rest, fast, and slow) or 12 times (posture). The tasks were alternated in a semirandom fashion, in which no consecutive repetition of the same task was allowed. Each session lasted for 15 min, consisted of 30 task blocks, and was performed twice in each participant. At the end of each session, two additional scans were added to be able to capture the slow return to baseline of the blood‐oxygenation level dependent (BOLD) response. A scan is defined as the time required to acquire one full brain image (3 s, see fMRI Analysis).
fMRI Recordings
Functional images were acquired using a 3T Philips Intera MRI scanner (Best, the Netherlands), using a standard transmit/receive head coil. The following pulse sequence parameters were used: fast field echo (FFE) single shot echo planar imaging (EPI); 46 slices; slice thickness 3.5 mm; no gap; field of view 224 mm; scanning matrix 64 × 64; transverse slice orientation; repetition time (TR) = 3 s; echo time (TE) = 35 ms; flip angle 90°. In addition, T1‐weighted 3D FFE anatomical images of the entire brain were obtained with the following pulse sequence parameters: field of view 256 mm; scanning matrix 256 × 256; 120 slices; slice thickness 1 mm; transverse slice orientation; TE = 4.6 ms; TR = 25 ms; flip angle 30°.
EMG Recordings
For EMG recordings and analysis, commercially available software (Brain Recorder and Brain Vision Analyzer) and an MR‐compatible amplifier (BrainAmp MR Plus) were used (Brain Products GmbH, Munich, Germany). A pair (RE) of sintered silver/silver‐chloride EMG electrodes was placed above the right wrist extensor muscles, ∼ 5 and 9 cm distal to the right elbow joint. Another pair (RFDI) was placed above the first dorsal interosseus (FDI) muscle and the metacarpophalangeal joint. The electrode wires were twisted per pair to minimize the differential effect of the magnetic field on the EMG leads. A reference electrode was positioned on the right elbow joint, and a ground electrode was placed on the left elbow joint. Current‐limiting resistors (5 kΩ) were attached to the EMG electrodes in order to prevent possible warming of the electrodes [Lemieux et al., 1997]. All electrodes were attached to an electrode input box, which was connected to the amplifier. The digital signals were transmitted via an optical cable and stored on a PC outside the MR room at a sampling rate of 5,000 Hz/channel.
Offline, the data were corrected for scanner artifacts according to the method described by Allen et al. [2000] and similar to the correction applied in our previous paper [van Duinen et al., 2005]. The quality of the corrected EMG signal was confirmed by visual inspection of the ongoing signal for remaining fMRI artifact, and by inspection of the power spectrum per task block (30 s) for remaining fMRI artifact power peaks. RE was used in subsequent fMRI analyses, except for participant 4, where RFDI was more optimally corrected than RE (Table I). After artifact correction, bipolar derivations were calculated for each muscle and a high‐pass filter of 10 Hz was applied to remove possible movement artifacts. Next, the EMG signals were rectified, to enhance the information on EMG burst‐frequency, thereby recovering the low frequency EMG content [Myers et al., 2003]. Subsequently, frequency extraction from 1 to 250 Hz was applied, calculating the average power (square of spectral amplitude) in the 1–250 Hz range for each data point in mV2. The upper boundary of 250 Hz was chosen because there is generally no significant EMG power at higher frequencies [Basmajian and de Luca, 1985]. The method of frequency extraction employs complex demodulation to extract time‐dependent variations in signal power [Lutzenberger et al., 1985]. Finally, the data were imported into Matlab (version 6.5, The Mathworks, Natick MA) for further processing. The time‐dependent EMG power between 1 and 250 Hz was averaged over the duration of each scan, resulting in a vector EMG all of length 302 with one value per scan.
fMRI Analysis
fMRI data was analyzed with the Statistical Parametric Mapping software (SPM99: http://www.fil.ion.ucl.ac.uk/spm; Wellcome Department of Cognitive Neurology, London [Friston et al., 1995]). The functional images were realigned to correct for head movements, normalized to standard brain coordinates (Montreal Neurological Institute, MNI, standard space, http://www.bic.mni.mcgill.ca/cgi/icbm_view) and spatially smoothed with an isotropic 8‐mm full‐width at half maximum (FWHM) Gaussian kernel. The total range of head motion (translation and rotation) was determined across each session per participant (Table II). To reduce movement artifacts, the six movement parameters derived from realignment corrections were entered as covariates in each analysis.
Table II.
Range (maximum − minimum translation/rotation over entire session) of movement parameters for each participant and session
| Participant | Session | Translation | Rotation | ||||
|---|---|---|---|---|---|---|---|
| x | y | z | Pitch | Roll | Yaw | ||
| 1 | 1 | 0.47 | 0.61 | 1.53 | 0.0198 | 0.0223 | 0.0124 |
| 2 | 0.89 | 0.42 | 1.93 | 0.0253 | 0.0196 | 0.0154 | |
| 2 | 1 | 0.49 | 0.81 | 1.09 | 0.0170 | 0.0095 | 0.0056 |
| 2 | 0.71 | 0.87 | 1.21 | 0.0138 | 0.0081 | 0.0068 | |
| 3 | 1 | 0.41 | 0.38 | 1.11 | 0.0071 | 0.0228 | 0.0121 |
| 2 | 0.61 | 0.44 | 1.00 | 0.0067 | 0.0303 | 0.0103 | |
| 4 | 1 | 0.15 | 1.38 | 1.16 | 0.0097 | 0.0037 | 0.0017 |
| 2 | 0.25 | 1.01 | 1.20 | 0.0109 | 0.0114 | 0.0053 | |
| 5 | 1 | 0.30 | 0.37 | 0.81 | 0.0198 | 0.0095 | 0.0068 |
| 2 | 0.57 | 0.35 | 0.78 | 0.0065 | 0.0090 | 0.0106 | |
Translation in millimeter and rotation in radians.
To verify if translational movement was independent of EMG power, we calculated the normalized inner product |(EMGall · translation)|/(EMGall · EMGall), where translation is the vector of movement parameters in x‐, y‐, or z‐direction. This value ranges from 0 (completely independent) to 1 (completely dependent). To derive mean signal intensities in regions of interest (ROIs), ROIs were derived from the active clusters in a contrast using MarsBaR (http://marsbar.sourceforge.net).
Conventional block‐design; two tasks (A1)
The general linear model (GLM) was applied to the functional data, using covariates for the two tasks posture and movement. The covariates were modeled by a boxcar function and convolved with the canonical hemodynamical response function (HRF) in SPM99. The fast and slow movement tasks were both included in the movement task as one regressor.
EMG‐only design (A2)
EMG all was convolved with the HRF and scaled by its standard deviation (SD) using Matlab. The vector was entered in SPM as a user‐defined regressor resulting in an fMRI model with one vector per session. A similar approach has been used to correlate average electroencephalography (EEG) band power with brain activity [Goldman et al., 2002; Laufs et al., 2003]. By scaling any user‐defined regressor with its SD, the estimated β's (partial regression coefficients in the GLM) will be directly comparable to each other, providing better insight in the relative importance of all predictors in the model [Armitage and Berry, 1994]. By using the EMG as a single regressor of interest, spontaneous (ab)normal EMG, lacking on‐ and offset information is approximated. However, movement variability and rest are represented in the EMG‐amplitude information. The EMG‐only design was verified by visually comparing the resulting activation maps with brain activation maps derived from the block‐design movement contrast expecting similar activation maps (design A1).
Integrated block plus residual EMG design (B1)
Analogous to the conventional block design (A1), we defined a vector block posture for the posture condition and a vector block movement for the movement condition. The vector elements in block posture and block movement are set to one for every volume during the active condition and set to zero elsewhere (boxcar type). Two separate vectors were derived per session from EMG all: a posture vector (EMG posture) and a movement vector, the latter encompassing both fast and slow movement (EMG movement) (Fig. 2, top and middle). For each task, EMG task is equal to the mean EMG power per scan during task execution and zero elsewhere. The EMG derived vectors and the vectors block posture and block movement are strongly (mathematically) dependent, prohibiting simultaneous use as regressors in an fMRI design. After subtraction of the information that is already present in the block design vectors from the corresponding EMG vectors, by subtraction of the mathematical vector projection, they can be integrated into the same design. This procedure (Gram‐Schmidt orthogonalization) has also been used to study correlations between EEG and brain activity [Feige et al., 2005]. For one specific task the residual EMG vector EMG task,res, with respect to the corresponding block design vector block task, was calculated as follows:
| (1) |
where · denotes the inner product of two vectors. The procedure is illustrated in Figure 7A. The resulting vectors EMG posture,res and EMG movement,res were convolved with the canonical HRF and scaled by their respective SDs (Fig. 2, bottom). In SPM, we added the residual EMG vectors as user‐defined regressors to the original (standard SPM) block‐onlydesign (A1). The different designs are described below and illustrated in Figure 3.
Figure 2.
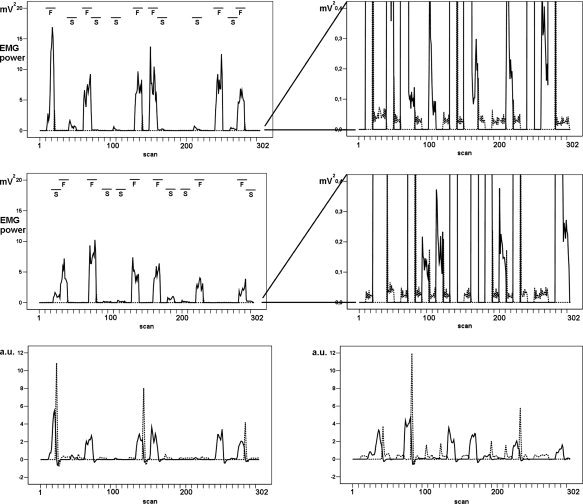
An example of mean EMG power for the posture (EMG posture: see text) and movement (EMG movement: see text) tasks in participant 1. Top: session 1. Middle: session 2. A blow‐up (right upper and middle panel) is provided for each session to show more details of EMG during posture. Bottom: mean EMG power after convolution and scaling with its SD. Bottom left: session 1, bottom right: session 2. (Mean EMG power: bipolar EMG after artifact correction, frequency extraction and averaging per scan; drawn line: movement, dotted line: posture, a.u.: arbitrary units. F/S: fast/slow movement.)
Figure 7.
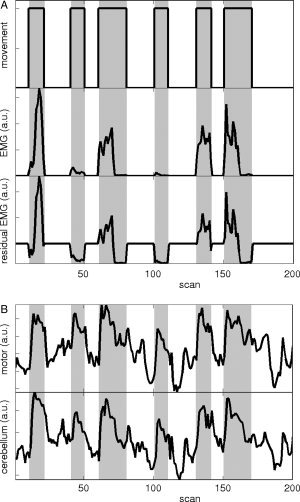
(A) Illustration of Gram‐Schmidt orthogonalization for the movement task in participant 1 for the first 200 scans of session 1. Horizontal axis: scans; vertical axis: regressor, a.u.:arbitrary units. Gray: movement task intervals. Top: block movement: block design (boxcar type) regressor for movement; the task is performed in an on/off fashion. Middle: EMG movement: EMG regressor for movement. The EMG power was averaged per scan (3 s) and equals zero, except during task execution. Note that the movement task was evenly divided in fast (higher EMG power) and slow movement (lower EMG power). Cf. Figure 2, top left. Bottom: Gram‐Schmidt orthogonalization of EMG movement with respect to block movement results in the residual EMG vector EMG movement,res. This is the additional EMG (positive or negative) relative to the mean EMG power (shown here before convolution with the canonical haemodynamical response function and scaling with the standard deviation). (B) Example of mean signal intensity in ROIs for the contralateral sensorimotor cortex (top) and the ipsilateral cerebellum (bottom). Here, ROIs were derived from the active clusters in the block movement contrast in design A1 at T ≥ 14, for participant 1.
Figure 3.
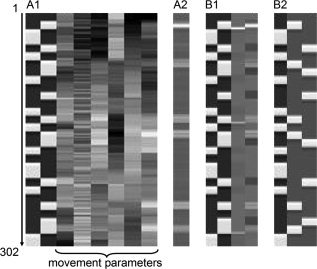
Details of the design matrices for participant 1, session 1 (302 scans). Movement parameters, illustrated here only for design A1, were the same for all designs per participant. (A1) Block‐only design, two tasks: block posture and movement regressors and six movement parameters. (A2) EMG‐only design: “EMG‐only” regressor. Note that the gray values correspond with EMG power, as in Figure 2, bottom left. (B1) Block plus residual EMG design: block posture and movement and residual EMG posture and movement regressors. (B2) Block‐only design, three tasks: block posture, fast, and slow movement regressors.
In nonmathematical terms, the factor (EMG task · block task)/ (block task · block task) is exactly equalto the mean value of the EMG power over the time period defined by the corresponding block. Hence, a residual EMG vector is equal to the additional EMG (positive or negative) relative to the mean EMG value across one task.
Residual EMG reflects deviations from steady task performance, which are approximated in the current set‐up by the inclusion of both slow and fast movement in one task. We verified whether residual EMG can be used as a measure of movement variability by comparing the resulting activation maps visually with brain activation maps derived from the fast–slow movement contrast from a block design in which fast movement and slow movement were modeled as separate regressors (B2, below).
Block‐only design; three tasks (B2)
Block design B2 was similar to design A1, except that the slow and fast movement tasks were modeled separately in addition to the posture task.
Statistical Analysis
For all designs parameter estimates and variance were derived for each covariate in single‐participant fixed‐effects models. We computed the statistical images (T‐maps) corresponding to each contrast. The statistical significance was set at P < 0.05, corrected for multiple comparisons. We only report clusters with an extent threshold of 8 voxels.
RESULTS
EMG Accuracy and Artifact Removal
By inspecting the ongoing EMG for remaining fMRI artifacts and verifying the power spectrum per 30‐s epoch we ensured that the fMRI artifact correction step was sufficient in EMG of FDI, extensor muscle or both muscles. Movement artifacts were sufficiently small not to jeopardize the fMRI artifact correction. Placing the reference electrode close to the EMG electrodes of interest further improved artifact correction [van Duinen et al., 2005]. A representative example of a stretch of bipolar extensor muscles EMG before and after artifact correction in participant 1 is given in Figure 1A,B. Figure 1A illustrates how the correction manifests over several seconds at the interface between two different motor tasks, whereas Figure 1B illustrates the quality of artifact correction over a 100 ms time interval.
Figure 1.
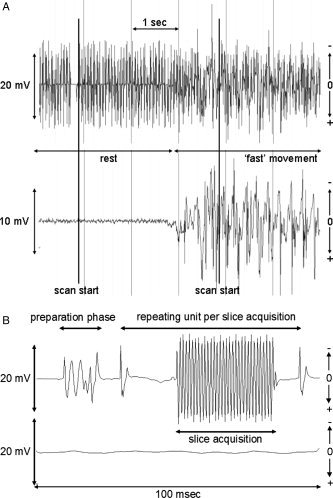
(A) An example of bipolar extensor EMG before (top) and after (bottom) fMRI artifact correction, for 6 s during two subsequent tasks (rest and fast movement) in participant 1. Note that the signal is not corrected for movement artifacts. Scan starts are indicated. Note that positive is down according to neurophysiological standards. (B) An example of bipolar extensor EMG before (top) and after (bottom) fMRI artifact correction, for 100 ms during the initial stage of scan acquisition. The artifacts due to preparation and repeated slice acquisition have been indicated.
Task Execution
Task execution was variable within and between tasks, sessions and participants as reflected in EMG power. The frequency of the flexion–extension movement varied around 1 Hz during slow movement and around 4 Hz during fast movement. As expected, fast movement lead to considerably higher mean extensor EMG power than slow movement (illustrated for participant 1 in Fig. 2, top). The mean EMG power during the posture task was very low (Fig. 2, middle). There was considerable variation within each task, which is clearly seen in the convolved and scaled EMG for participant 1 (Fig. 2, bottom). For all participants, task execution varied between the two sessions.
Head Movements
The range in translational head movements varied from 0.15 to 1.93 mm (x‐direction: 0.15–0.89, median 0.48; y‐direction: 0.35–1.38, median 0.53; z‐direction: 0.78–1.93, median 1.13). The range in rotational head movements varied from 0.0017 to 0.0303 radians (pitch: 0.0065–0.0253, median 0.0124; roll: 0.0037–0.0303, median 0.0105; yaw: 0.0017–0.0154, median 0.0086). Translational movement was virtually independent of EMG power; the normalized inner product varied from 0.0023 to 0.0274 in x‐direction, from 0.0017 to 0.0193 in y‐direction, and from 0.0058 to 0.0650 in z‐direction over all participants and sessions. Similarly, translational movement was virtually independent of residual EMG (movement) power; values ranged from 0.0013 to 0.0262 in x‐direction, from 0.0000 to 0.0185 in y‐direction, and from 0.0040 to 0.0688 in z‐direction over all participants and sessions. This indicates that task‐related head movements were limited.
EMG‐fMRI Analysis
The different design matrices are illustrated in Figure 3 for session 1 in participant 1. Figure 4 shows the activation maps per regressor for the different designs for participant 1. Illustrations are further given for all five participants as to allow judgment of intraindividual as well as between‐participant variability (Figs. 5 and 6). An example of the different regressors (block movement, EMG‐only, and residual EMG movement) and the mean signal intensity in ROIs for the contralateral sensorimotor cortex and the ipsilateral cerebellum are shown in Figure 7A,B. Here, ROIs were derived from the active clusters in the block movement contrast in design A1 at T ≥ 14, for participant 1. The results of the various designs are presented in the following paragraphs. Because movement tasks as studied here yield widespread brain activation in healthy participants, we only discuss main activations.
Figure 4.
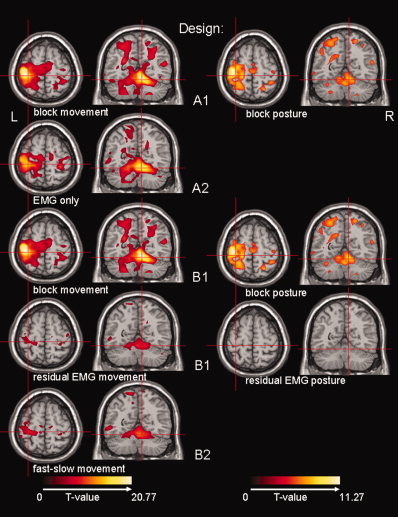
The resulting activation maps for the different regressors per design are shown for participant 1. From top to bottom: design A1 (left: block movement, right: block posture), design A2 (EMG only), design B1 (left: block movement, right: block posture), design B1 (left: residual EMG movement, right: residual EMG posture) and design B2 (fast–slow movement). Activation maps are projected on a normalized single‐participant T1 image (Montreal Neurological Institute, MNI). Transversal section at MNI (−32, −30, 62): contralateral SMC (central sulcus) and coronal section at MNI (9, −56, −18): ipsilateral cerebellum IV–V. Only significant activations (T ≫ 4.83) have been plotted. Note the different color scales for the movement and posture contrasts.
Figure 5.
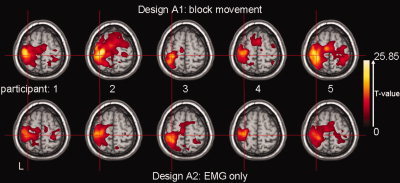
Activation maps for participants 1–5 (left to right) projected on the same T1‐image as in Figure 4. Top: design A1, block movement; bottom: design A2, EMG‐only. Transversal section at MNI (−32, −30, 62): contralateral SMC (central sulcus). Only significant activations (T ≫ 4.83) have been plotted.
Figure 6.
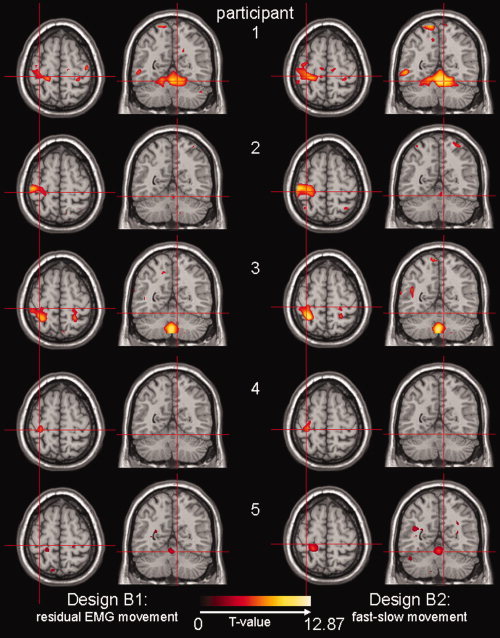
Activation maps for participants 1–5 (top to bottom) projected on the same T1‐image as in Figure 4. Left column: design B1, residual EMG movement; right column: design B2, fast–slow movement. Transversal section at MNI (−32, −30, 62): contralateral SMC (central sulcus) and coronal section at MNI (9, −56, −18): ipsilateral cerebellum IV‐V. Only significant activations (T ≫ 4.83) have been plotted. Note that images for participant 5 are uncorrected (P < 0.001), but at the same cluster size (8). For participant 5, activations where T ≫ 3.1 are plotted.
Conventional block design; two tasks (A1)
Employing design A1, all participants showed activation in the motor system in the movement task as expected; i.e. in the contralateral primary sensorimotor cortex (SMC) and the ipsilateral cerebellum (Figs. 4 and 5). The individual results for the posture task were more variable, and, for the purpose of this study, we refrain from describing all details. An example is given for participant 1, in whom posture correlated with activation in contralateral SMC, but at lower T‐values than for the movement task (Fig. 4, design A1).
EMG‐only design (A2)
With design A2, the motor system was as efficiently identified as with design A1 (movement task) for all participants (Fig. 5). This included both the SMC (Fig. 5) and the cerebellum (illustrated for participant 1 in Fig. 4, design A2).
Block plus residual EMG design (B1)
The residual EMG vector for movement (for an example in participant 1: Fig. 3, design B1, fourth regressor) is positive for the fast movement task and negative for the slow movement task, since the EMG power is higher than average in the first task and lower than average in the latter task. Using the residual EMG movement contrast, the ipsilateral cerebellum and/or the contralateral SMC were identified, variable over participants (Fig. 6). In participant 5, activity was only found at a lower threshold level.
Block‐only design; three tasks (B2)
Results from the residual EMG movement contrast in design B1 were compared to the fast–slow movement contrast in design B2. The resulting activation images were almost indistinguishable between designs for each participant (Fig. 6).
DISCUSSION
In the current study, it was shown that EMG recorded during scanning can be used to identify brain activation related to intended movement (motor task), as well as to identify activation related to movement independent of a motor task (superfluous movement or movement variability).
Activation images derived from a conventional block design (design A1) and a design based on EMG only (design A2) were comparable intraindividually, showing maximum activation in contralateral SMC and ipsilateral cerebellum during movement of the right hand (Fig. 5). This demonstrated that the ongoing EMG, as the single regressor of interest in the analysis, can be directly related to motor circuitry. The intraindividual activation maps for the two designs are not exactly identical. From observing Figure 5, it seems that the analysis using the EMG derived model generally results in a reduced extent of brain activity. There are several explanations why spatial extent of active brain areas is not exactly the same for both designs. (1) As illustrated in Figure 4 (top), brain activity in motor areas can be expected to be lower for posture than for movement. The conventional block design (A1) considers solely movement, while the EMG‐only design (A2) includes movement, posture, and rest. When comparing the results, it is likely that the latter results will be a weighted average of brain activity during movement (higher) and posture (lower), resulting in lower activation for design A2. (2) More regressors (design A1) may result in more explained variance, which also results in higher T‐values (smaller residual errors). On the other hand, a larger spatial extent may also imply more involvement of anterior, parietal, and premotor cortices. One might speculate that activation in design A1 reflects neural processing beyond movement execution, i.e. activation associated with movement preparation and correction. It is however difficult to predict the joint effect of these mechanisms on actual T‐values and spatial extent of active brain areas.
When two separate EMG‐based regressors for posture and movement were used in the analysis, still activated brain regions were not identical (data not shown). Only flawless and constant performance of motor tasks would lead to boxcar type EMG regressors and thus to identical results. An EMG‐only design might be more appropriate than a conventional block‐design to identify movement related brain activation in studies where movement variability is to be expected, as it incorporates (spontaneous) variation in motor task performance and in the actual on‐ and offsets of tasks. The EMG‐only design is expected to be relevant for studies of spontaneous motor activity––self‐paced or abnormal––in the MRI environment, and allows novel paradigms.
Extracting the EMG variability and incorporating this in an integrated block plus residual EMG analysis (design B1) allowed to correlate movement variability, rather than motor task, with brain activity. The on‐ and offsets of slow and fast movement were known, and activation maps resulting from a fast–slow movement contrast (block design B2) could therefore be compared with activation maps for design B1 intraindividually. Per participant, the brain activation maps resulting from the residual EMG movement contrast in design B1 were almost identical to those resulting from the fast–slow movement contrast in design B2 (Fig. 6). Slightly different results between designs per individual can be explained by irregular performance within the fast and slow movement tasks. Residual EMG‐fMRI analysis is therefore useful when task performance is irregular, e.g. in patients with movement disorders, and in the absence of a‐priori known movement modulations. Residual EMG provides information on brain functioning, which cannot be derived from a conventional block design analysis.
In addition to direct correlation with brain activity, EMG may be used to fine‐tune the on‐ and offsets of tasks, or record and correct for unintended (contralateral) movement. In analogy to the integrated block plus residual EMG design, the Gram‐Schmidt orthogonalization can be used ad infinitum to obtain other regressors to model brain activity, such as a residual block regressor, or a regressor extracted from a force recording. The applications of EMG, and other physiological signals, during fMRI studies are multiple, and many are yet to be explored.
A possible problem in the analysis is remaining fMRI artifact in the EMG signal. It has been shown that EMG of isometric muscle contraction obtained during fMRI is accurate after removal of fMRI related artifacts [van Duinen et al., 2005]. The correction method used in the current study is based on the assumption that the artifacts introduced in the EMG signal by the changing magnetic field are highly regular and can serve as a template that can be subtracted from the acquired EMG signal. In the present study, during the flexion–extension task, nonisometric muscle contraction induces movement of the EMG leads in the magnetic field, thereby introducing high voltage movement artifacts in the EMG signal and possibly distortion of the regularity of the fMRI related artifacts. This potentially interferes with removal of fMRI artifact from the EMG signal. The fMRI artifact is reflected in power peaks in the EMG power spectrum. Visual inspection showed that these were absent or limited in the EMG signal from one or both muscles. Additionally, using a 10 Hz high pass filter, it was possible to remove movement‐related artifacts. The low frequency EMG content was recovered by rectification of the signal [Myers et al., 2003]. Another potential problem is head movements that can compromise analysis of the fMRI data. By computing the correlation between movement parameters and EMG signal, we ensured that these were independent. It is likely that further technological and methodological developments will improve future EMG‐fMRI studies.
The combined EMG‐fMRI technique is expected to find, besides possible clinical applications, numerous scientific applications to study both normal and pathological movements.
Acknowledgements
The authors thank Anita Kuiper for operating the MR scanner.
REFERENCES
- Allen PJ,Josephs O,Turner R ( 2000): A method for removing imaging artifact from continuous EEG recorded during functional MRI. Neuroimage 12: 230–239. [DOI] [PubMed] [Google Scholar]
- Armitage P,Berry G ( 1994): Statistical Methods in Medical Research. Oxford: Blackwell Science. [Google Scholar]
- Basmajian JV,de Luca CJ ( 1985): Description and Analysis of the EMG Signal In: Muscles Alive: Their Functions Revealed by Electromyography. Baltimore, MD: Williams and Wilkins; pp 65–100. [Google Scholar]
- Dai TH,Liu JZ,Sahgal V,Brown RW,Yue GH ( 2001): Relationship between muscle output and functional MRI‐measured brain activation. Exp Brain Res 140: 290–300. [DOI] [PubMed] [Google Scholar]
- Feige B,Scheffler K,Esposito F,Di Salle F,Hennig J,Seifritz E ( 2005): Cortical and subcortical correlates of electroencephalographic alpha rhythm modulation.J Neurophysiol 93: 2864–2872. [DOI] [PubMed] [Google Scholar]
- Friston KJ,Holmes AP,Worsley KJ,Poline J‐P,Frith CD,Frackowiak RSJ ( 1995): Statistical parametric maps in functional imaging: A general linear approach. Hum Brain Mapp 2: 189–210. [Google Scholar]
- Goldman RI,Stern JM,Engel J,Cohen MS ( 2002): Simultaneous EEG and fMRI of the α rhythm. Neuroreport 13: 2487–2492. [DOI] [PMC free article] [PubMed] [Google Scholar]
- Laufs H,Krakow K,Sterzer P,Eger E,Beyerle A,Salek‐Haddadi A,Kleinschmidt A ( 2003): Electroencephalographic signatures of attentional and cognitive default modes in spontaneous brain activity fluctuations at rest. Proc Nat Acad Sci USA 100: 1153–11058. [DOI] [PMC free article] [PubMed] [Google Scholar]
- Lemieux L,Allen PJ,Franconi F,Symms MR,Fish DR ( 1997): Recording of EEG during fMRI experiments: Patient safety. Magn Res Med 38: 943–952. [DOI] [PubMed] [Google Scholar]
- Liu JZ,Dai TH,Elster TH,Sahgal V,Brown RW,Yue GH ( 2000): Simultaneous measurement of human joint force, surface electromyograms, and functional MRI‐measured brain activation. J Neurosci Methods 101: 49–57. [DOI] [PubMed] [Google Scholar]
- Liu JZ,Dai TH,Sahgal V,Brown RW,Yue GH( 2002a): Nonlinear cortical modulation of muscle fatigue: A functional MRI study. Brain Res 957: 320–329. [DOI] [PubMed] [Google Scholar]
- Liu JZ,Zhang LD,Yao B,Yue GH ( 2002b): Accessory hardware for neuromuscular measurements during functional MRI experiments. Magn Res Mat Phys Biol Med 13: 164–171. [DOI] [PubMed] [Google Scholar]
- Liu JZ,Shan ZY,Zhang LD,Sahgal V,Brown RW,Yue GH ( 2003): Human brain activation during sustained and intermittent submaximal fatigue muscle contractions: An fMRI study. J Neurophysiol 90: 300–312. [DOI] [PubMed] [Google Scholar]
- Liu JZ,Zhang LD,Brown RW,Yue GH ( 2004): Reproducibility of fMRI at 1.5 T in a strictly controlled motor task. Magn Res Med 52: 751–760. [DOI] [PubMed] [Google Scholar]
- Lutzenberger W,Elbert T,Rockstroh B,Birbaumer N ( 1985): Das EEG. Psychophysiologie und Methodik von Spontan‐EEG und ereigniskorrelierten Potentialen. Berlin: Springer. [Google Scholar]
- MacIntosh BJ,Mraz R,Baker N,Tam F,Staines WR,Graham SJ ( 2004): Optimizing the experimental design for ankle dorsiflexion fMRI. Neuroimage 22: 1619–1627. [DOI] [PubMed] [Google Scholar]
- MacIntosh BJ,Baker SN,Mraz R,Ives JR,McIlroy WE,Graham SJ ( 2005): Improving motor fMRI using EMG‐guided data analysis. Human Brain Mapping 2005, Toronto, Ontario.
- Myers LJ,Lowery M,O'Malley M,Vaughan CL,Heneghan C,St Clair GA,Harley YX,Sreenivasan R ( 2003): Rectification and nonlinear pre‐processing of EMG signals for cortico‐muscular analysis. J Neurosci Methods 124: 157–165. [DOI] [PubMed] [Google Scholar]
- Oga T,Honda M,Toma K,Murase N,Okada T,Hanakawa T,Sawamoto N,Nagamine T,Konishi J,Fukuyama H,Kaji R,Shibasaki H ( 2002): Abnormal cortical mechanisms of voluntary muscle relaxation in patients with writer's cramp: An fMRI study. Brain 125: 895–903. [DOI] [PubMed] [Google Scholar]
- Oldfield RC ( 1971): Assessment and Analysis of Handedness: Edinburgh Inventory. Neuropsychologia 9: 97–113. [DOI] [PubMed] [Google Scholar]
- Toma K,Honda M,Hanakawa T,Okada T,Fukuyama H,Ikeda A,Nishizawa S,Konishi J,Shibasaki H ( 1999): Activities of the primary and supplementary motor areas increase in preparation and execution of voluntary muscle relaxation: An event‐related fMRI study. J Neurosci 19: 3527–3534. [DOI] [PMC free article] [PubMed] [Google Scholar]
- van Duinen H,Zijdewind I,Hoogduin JM,Maurits NM ( 2005): Surface EMG measurements during fMRI at 3T: Accurate EMG recordings after artifact correction. Neuroimage 27: 240–246. [DOI] [PubMed] [Google Scholar]


