

Abstract
Inhibitory and performance‐monitoring functions have been shown to develop throughout adolescence. The developmental functional magnetic resonance imaging (fMRI) literature on inhibitory control, however, has been relatively inconsistent with respect to functional development of prefrontal cortex in the progression from childhood to adulthood. Age‐related performance differences between adults and children have been shown to be a confound and may explain inconsistencies in findings. The development of error‐related processes has not been studied so far using fMRI. The aim of this study was to investigate the neural substrates of the development of inhibitory control and error‐related functions by use of an individually adjusted task design that forced subjects to fail on 50% of trials, and therefore controlled for differences in task difficulty and performance between different age groups. Event‐related fMRI was used to compare brain activation between 21 adults and 26 children/adolescents during successful motor inhibition and inhibition failure. Adults compared with children/adolescents showed increased brain activation in right inferior prefrontal cortex during successful inhibition and in anterior cingulate during inhibition failure. A whole‐brain age‐regression analysis between 10 and 42 years showed progressive age‐related changes in activation in these two brain regions, with additional changes in thalamus, striatum, and cerebellum. Age‐correlated brain regions correlated with each other and with inhibitory performance, suggesting they form developing fronto‐striato‐thalamic and fronto‐cerebellar neural pathways for inhibitory control. This study shows developmental specialization of the integrated function of right inferior prefrontal cortex, basal ganglia, thalamus, and cerebellum for inhibitory control and of anterior cingulate gyrus for error‐related processes. Hum Brain Mapp 2007. © 2007 Wiley‐Liss, Inc.
Keywords: development, cognitive neuroscience, cognitive control, executive functions, fMRI, motor inhibition
INTRODUCTION
Basic cognitive functions are established in childhood; however, more complex self‐regulatory functions such as inhibitory control, interference inhibition, performance monitoring, including conflict and error detection, and cognitive flexibility have been shown to develop throughout adolescence [Levin et al.,1991]. Rudimentary forms of inhibitory control and error monitoring can be observed as early as about the age of 4 [Jones et al.,2003], but the development of these self‐regulatory and performance‐monitoring functions appears not to be fully mature until mid to late adolescence. The development of selective motor response inhibition in the go/no‐go task has thus shown to peak at about 12 years [Levin et al.,1991], whereas withholding of an already triggered motor response in the more difficult stop task has been shown to peak between 13 and 17 years [Williams et al.,1999]. Performance‐ and error‐monitoring functions appear to develop well into puberty [Davies et al.,2004a,b]. The late development of inhibitory control processes have been related to the relatively late anatomical maturation of the frontal lobes [Bjorklund and Harnishfeger,1990; Dempster,1992], which has been confirmed by functional imaging findings of prefrontal mediation of inhibitory control [Durston et al.,2002a; Garavan et al.,1999; Menon et al.,2001; Rubia et al.,2000,2001,2003].
Important brain maturational changes continue well into late adolescence and early adulthood such as synaptic pruning and reorganization, programmed cell death, and dendritic and axonal arborization [Changeux and Danchin,1976; Huttenlocher and Dabholkar,1997]. These maturational changes have been related to progressive morphological changes in white to grey matter ratio in most brain areas from early childhood to late adolescence, presumably reflecting myelination [Giedd et al.,1999; Gogtay et al.,2004; Paus et al.,1999; Sowell et al.,2004]. The myelination processes appear to develop in a posterior‐to‐anterior‐shift, with frontal brain regions myelinating last. Myelination processes in some frontal brain regions peak as late as in midadulthood [Gogtay et al.,2004; Sowell et al.,2004]. The late development of frontal lobe structures that mediate inhibition has made inhibitory control an important target of developmental functional imaging studies.
Functional imaging has the advantage of elucidating the dynamic nature of cognitive development [Rubia,2002]. The existing functional imaging literature on the development of inhibitory control functions, however, has been relatively inconsistent with respect to the maturation of prefrontal function. Some developmental fMRI studies have reported increased frontal activation in adults compared with children during tasks of inhibitory control functions [Bunge et al.,2002; Luna et al.,2001; Rubia et al.,2000,2007; Tamm et al.,2002], supporting a maturational hypothesis of brain function where brain regions that mature latest are also brain regions that increase in function with age. Some of the same studies also reported the recruitment of different prefrontal brain regions in children compared with adults, which has been interpreted as a reflection of alternative strategies for task management [Luna et al.,2001; Rubia et al.,2000; Tamm et al.,2002]. Other developmental imaging studies on inhibitory control, however, have found increased activation in frontal and parietal lobes in children and adolescents compared with adults, which has been interpreted as a reflection of a more diffuse and less specialized prefrontal function in children, related to the need for greater effort in children to manage task performance [Booth et al.,2003; Casey et al.,1997; Durston et al.,2002b].
The majority of developmental fMRI studies on inhibitory control were based on relatively small sample sizes and have used block design fMRI (with the exception of the studies by Bunge et al. [2002] and Durston et al., [2002b,2006]), which may partly explain the inconsistencies in findings. Performance differences in block and event‐related fMRI studies have been shown to be an important confound in the comparison of functional imaging data of different age groups and to contaminate real findings of age‐related brain activation differences in geriatric [Grossman et al.,2002; Murphy and Garavan,2004] and developmental populations [Brown et al.,2005; Schlaggar et al.,2002]. Performance mismatch in developmental data has been shown to lead to a false attribution of such differences between age groups to effects of maturation per se [Brown et al.,2005; Schlaggar et al.,2002]. Different approaches have been used to disentangle performance‐related effects from age‐related effects in developmental imaging data. One approach is to examine correlations between neural activity, performance, and age or to covary for performance [Casey et al.,1997,2002; Thomas et al.,2004]. Another is to compare subgroups from different age groups that are matched in performance [Brown et al.,2005; Bunge et al.,2002; Schlaggar et al.,2002]. A third approach is to incorporate different difficulty levels in the task design, with the aim to post‐hoc compare between matched (easy trials) and nonmatched (difficult trials) performance [Durston et al.,2002b]. These approaches, however, do not address strategy differences that may exist between children and adults and the fact that tasks may be inherently more difficult and effortful for children, even when task performance is matched by external task scores.
The aim of this study was to apply an alternative, novel approach to avoid the problem of differences in difficulty levels between different age groups by the use of a cognitive paradigm that is individually adjusted to control for differences in task difficulty and therefore performance levels between different age groups. We thus aimed to clarify the relationship between the development of inhibitory control and prefrontal brain function in a study design that controlled for potential confounds of task difficulty and performance mismatch between children and adults. For this purpose, we combined event‐related fMRI with a cognitive paradigm that adjusted for individual performance. The fMRI adaptation of the individually adjusted tracking stop task [Rubia et al.,2003] requires withdrawal of a motor response when a go‐signal is shortly followed by a stop signal. The time interval between go and stop signal is altered according to each subjects' performance, making sure that each subject succeeds and fails to 50% of the stop trials throughout the task. Each subject is therefore working at the edge of his/her own inhibitory capacity, providing homogenous difficulty levels between subjects and groups [Rubia et al.,2003].
Another advantage of the tracking stop task is that it also measures neural networks related to error‐related functions such as error detection and performance monitoring during the 50% trials of stop failure. Developmental imaging studies using electroencephalography (EEG) have shown that the error related negative potential (ERN), presumably originating in anterior cingulate gyrus, matures relatively late during adolescence [Davies et al.,2004a; Ladouceur et al.,2004] reaching into mid adulthood [Davies et al.,2004b]. No fMRI studies, however, exist so far on the development of error‐related functions.
In healthy adults, the visual tracking stop task has been shown to elicit brain activation in right inferior prefrontal cortex during successful stop trials and in right mesial prefrontal cortex, anterior cingulate gyrus, and parietal lobes during stop failures [Rubia et al.,2003]. Based on the evidence for development of inhibitory and error detection functions in midadolescence, for anatomical maturation of the prefrontal cortex until midadulthood and for postadolescent functional maturation of inferior and mesial prefrontal brain regions during self‐control functions [Bunge et al.,2002; Rubia et al.,2000; Tamm et al.,2002], we hypothesized that when performance was matched between groups, children, and adolescents compared with adults would show reduced brain activation in right inferior prefrontal cortex during stop trials and in mesial prefrontal cortex and anterior cingulate gyrus during stop failures. We furthermore hypothesized that there would be progressive linear changes in these two brain regions across all subjects in the age range of 10–42 years.
METHOD
Subjects
Forty seven male right‐handed children and adults participated, 21 adults and 26 children and adolescents. The adults were in the age range of 20–42 years (mean age = 28(5)) and the children and adolescents in the age range of 10–17 years (mean age = 15(2)). Exclusion criteria were history of substance abuse, head injury, mental retardation, or mental, clinical or neurological disorder.
fMRI Activation Task Design
Rapid, mixed trial, randomized presentation, and event‐related fMRI design was used. Interstimulus‐intervals (ISI) were randomly jittered between 1.6 and 2 s, and the appearance of target events was randomized to optimize statistical efficiency (Burrock et al.,1998; Dale,1999; Dale and Buckner,1997].
Subjects were practiced once on the stop task prior to scanning to ensure correct understanding of the task instructions. The stop task was presented on a mirror within the MRI scanner during the scan and response data were recorded on a PC.
Tracking Stop Task
The tracking stop task requires withholding of a motor response to a go stimulus when it is followed unexpectedly and unpredictably by a stop signal [Logan et al.,1997]. In our visual fMRI adaptation of this task [Rubia et al.,2003], arrows (of 500 ms duration) pointing either to the left or right side appeared on the middle of the screen with a mean ISI of 1.8 s. Subjects were instructed to respond to the arrow direction by making a button response with their left or right thumb. On the unpredictable, infrequent stop trials (20% of trials), the arrows pointing left or right were followed (about 250 ms later) by arrows pointing upwards, and subjects had to inhibit their motor responses. The time interval of 250 ms between go‐signal and stop signal onsets changes according to each subject's performance and is calculated based on the subject's overall probability of inhibition on all previous trials, which is recalculated after each stop trial. If the overall probability of inhibition on previous trials was over 50%, then the stop signal delay would increase in steps of 50 ms, thus making it harder to inhibit. If the overall probability of inhibition of all previous trials reaches below 50% after any given stop trial, the stop signal delay would decrease in steps of 50 ms, making it easier to inhibit. The tracking algorithm makes sure the task is equally challenging and difficult for each individual, providing 50% successful and 50% unsuccessful inhibition trials. Forty stop trials were pseudorandomly interspersed with 156 go trials (78 left and 78 right pointing arrows) and at least three repetition times apart for adequate separation of the hemodynamic response. Since the algorithm of the task design makes sure that subjects fail to half of all stop events, successful and unsuccessful stop events control each other perfectly for low frequency (i.e. 20 each).
In the event‐related fMRI analysis, brain activation to the 50% successful stop trials is contrasted with that of the 50% unsuccessful stop trials (i.e. successful stop trials–unsuccessful stop trials). Brain activation to unsuccessful stop trials are thus subtracted from brain activation to the successful stop trials to control for attentional effects of the low frequency appearance of stop trials. Activation to go‐response trials is subtracted from activation to unsuccessful stop trials to control for brain activation related to motor response execution (i.e. unsuccessful stop–go trials) [for details of the task see Rubia et al.,2003,2005b].
Analysis of Performance Data
Univariate ANOVAs with IQ as covariate was used to compare groups in their task performance using the following variables: mean reaction time (MRT) to go trials; stop signal reaction time (SSRT), calculated by subtracting the mean stop signal delay (SSD: the average time between go and stop signal at which the subject managed to inhibit to 50% of trials) from the mean reaction time (MRT) to go trials, i.e. MRT − SSD [Logan et al.,1997]; and probability of inhibition (PI) to stop trials. The SSRT is an indicator of the speed of the inhibitory process. P‐values were adjusted for multiple testing using the false discovery rate [FDR; Benjamini and Hochberg,1995]. Pearson correlations were performed to examine linear correlations between age and performance measures across all subjects; significance levels were adjusted using the FDR.
fMRI Image Acquisition
Gradient‐echo echoplanar MR imaging (EPI) data were acquired on a GE Signa 1.5T Horizon LX System (General; Electric, Milwaukee, WI) at the Maudsley Hospital, London. Consistent image quality was ensured by a semiautomated quality control procedure. A quadrature birdcage head coil was used for RF transmission and reception. In each of 16 noncontiguous planes parallel to the anterior–posterior commissural, 196 T2*‐weighted MR images depicting BOLD (Blood Oxygen Level Dependent) contrast covering the whole brain were acquired with TE = 40 ms, TR = 1.8 s, flip angle = 90°, in‐plane resolution = 3.1 mm, slice thickness = 7 mm, and slice‐skip = 0.7 mm. This EPI dataset provided almost complete brain coverage.
fMRI Individual Analysis
The data were first realigned [Bullmore et al.,1999] to minimize motion related artifacts and smoothed using a Gaussian filter (FWHM 7.2 mm). Time series analysis was then carried out by first convolving each experimental condition (i.e. stop–go trials; unsuccessful stop–go trials) with γ variate functions, modeling delays of 4 and 8 s, respectively (to allow variability within this range). Go trials were used as implicit baseline trials and subtracted from the two main experimental conditions (successful and nonsuccessful stop trials). The third contrast of interest (successful stop–unsuccessful stop) is a direct subtraction of the two primary contrasts. The weighted sum of these two convolutions that gave the best fit (least‐squares) to the time series at each voxel was then computed and a goodness of fit statistic was computed at each voxel, consisting of the ratio of the sum of squares of deviations from the mean intensity value due to the model (fitted time series) divided by the sum of squares due to the residuals (original time series minus model time series). This statistic is called the SSQ‐ratio.
Significance of the SSQ ratio volumes obtained was tested using the wavelet‐based time series permutation method described in detail by Bullmore et al. [2001].
fMRI Group Mapping
Statistical maps for each contrast of interest were transformed into standard space, as previously described by Brammer et al. [1997] and tested for significance using permutation methods at voxel and cluster levels [Brammer et al.,1997; Bullmore et al.,2001]. Zero false positive activated clusters were expected at a P‐value of <0.05 at voxel and of <0.0025 at cluster‐levels.
A two‐tailed t‐test was performed to test for between‐group differences in 3D motion for the x, y, z rotation and x, y, z translation during task performance.
ANCOVA for Group Comparisons in Brain Activation
Analysis of variance with IQ as covariate was carried out on the SSQ ratio maps in standard space by first computing the difference in median SSR ratio between groups at each voxel. Subsequent inference of the probability of this difference under the null hypothesis was made by reference to the null distribution obtained by repeated random permutation (1,000 times) of group membership and recomputation of the difference in median SSR ratios between the two groups obtained from the resampling process. Cluster‐level maps were then obtained as described above [Bullmore et al.,1999]. For this particular group comparison, less than one false activated cluster was expected at a P‐value of P < 0.05 for voxel‐comparison and P < 0.025 for cluster comparison.
Phase Analysis
For any given experimental contrast, information can be obtained not only about the size but also the direction of the activation from the general linear model fit to the time series of activation. The sign of BOLD response with respect to baseline can be either positive (in “phase” with the activation condition) or negative (in “phase” with the baseline condition). This estimation can then be taken into account to determine whether a group difference reflects a difference between positive or negative BOLD responses. This analysis was performed at a group level, and was based on the positive or negative average SSQ ratios for each group in any of the between‐group activation clusters. For all between‐group activation differences for all contrasts, only BOLD responses were considered in both groups that were positive‐based on the average SSQ ratio of each group relative to the activation condition of interest. This also applies to the correlation analyses.
Whole‐Brain Correlation Analysis Between Age and Brain Activation
A regression analysis was conducted between brain activation and age with IQ as covariate across all subjects, independent of their group status. For this purpose, the Pearson product‐moment correlation coefficient was first computed at each intracerebral voxel in standard [Talairach and Tournoux,1988] space between the age data and the BOLD response (% change in signal) over all subjects. Random permutation testing (of the age data, 50 times) was used to assess the probability of any particular correlation coefficient under the null hypothesis. Statistical analysis was extended to cluster level as described by Bullmore et al. [1999]. A P‐value of P < 0.05 at voxel and P < 0.025 at cluster‐levels was chosen, resulting in less than one error cluster.
To investigate whether age‐correlated brain activation clusters during successful inhibition were correlated with inhibitory performance, the SSQ ratios were extracted for each subject for every voxel in each of the age‐correlated activation clusters, and the mean values of these SSQ ratios for all voxels in the chosen clusters calculated for each subject. Pearson correlations were then performed between SSRT/PI and the mean SSQ ratios for each subject for all age‐correlated clusters.
RESULTS
Task Performance
There were group differences on the intelligence scores on the Raven's Standard Progressive Matrices Intelligence Questionnaire (IQ) [Raven,1960] (adults: mean converted nonverbal IQ: 114 (11); children/adolescents mean IQ: 106 (13), t = 2.7, df = 45, P < 0.034). Consequently, all analyses were performed with IQ as covariate.
Univariate ANCOVAs showed no group differences in performance. Probability of inhibition to stop trials was close to 50% in all subjects, suggesting that the tracking stop mechanism was successful (PI (standard deviation (SD)) adults: 54% (7%); children/adolescents: 50% (4%), F = 1.8, df = 2, P = 0.07). No significant group differences were observed in SSRT (SD): adults 225 (277); children: 273 (254), F = 0.3, df = 2, n.s. No significant differences were observed for MRT to go trials (SD): adults: 863 (167); Children 763 (188), F = 0.2, df = 2, P < 0.08).
Across all subjects, no significant linear correlations were observed between age and performance measures (PI: r = 0.3, P = n.s.; SSRT:r = −0.1, P = n.s.; MRT go: r = −0.1, P = n.s.).
Within‐Group Brain Activation
During successful stop trials (contrasted with unsuccessful stop trials), adults and children/adolescents showed predominantly right but also left inferior prefrontal and bilateral medial prefrontal activation (see Table I, Fig. 1a). In adults, activation in right (r = −0.4, P < 0.05) and left inferior prefrontal cortex (r = −0.4, P < 0.59) correlated negatively with SSRT (suggesting that subjects with faster inhibitory speed showed greater activation in this area). In adolescents, no activation correlated with SSRT; probability of inhibition was correlated with activation in superior temporal gyrus (r = 0.6, P < 0.007).
Table I.
Group brain activation foci for adults and children/adolescents on the stop task and brain activation differences
| Brain regions of activation (BA) | Tal. coord | N voxels | |
|---|---|---|---|
| Successful stop–unsuccessful stop trials | |||
| Adults | R inferior frontal gyrus (BA 45/47) | 41, 26, 11 | 113 |
| L inferior frontal gyrus (BA 45) | −44, 29, 6 | 31 | |
| R medial frontal gyrus (BA 9) | 9, 40, 22 | 21 | |
| L medial temporal gyrus (BA 37) | −45, −59, −7 | 27 | |
| R cerebellum/occipital gyrus (BA 19) | 33, −73, −11 | 75 | |
| L cerebellum | −22, −40, −19 | 29 | |
| L posterior cingulate (BA 30) | −10, −53, 9 | 43 | |
| Children/adolescents | R inferior frontal gyrus (BA 47/45) | 46, 15, −4 | 48 |
| R medial frontal gyrus (BA 10/46) | 29, 54, 8 | 48 | |
| L medial frontal gyrus (BA 9) | −22, 13, 40 | 29 | |
| L medial prefrontal gyrus (BA 9) | −40, 1, 41 | 24 | |
| R premotor cortex (BA 6) | 37, −9, 40 | 22 | |
| L insula/superior temporal gyrus (BA 22) | −44, 4, 4 | 81 | |
| R superior temporal gyrus (BA 21/38) | 37, 5, −28 | 15 | |
| R precuneus (BA 7) | 4, −56, 46 | 21 | |
| R cerebellum | 18, −79, −22 | 28 | |
| Adults > children/adolescents | R inferior prefrontal gyrus (BA 45) | 43, 33, 9 | 50 |
| Unsuccessful stop–go trials | |||
| Adults | Mesial frontal/anterior cingulate (BA 10/32/24) | 1, 52, 17 | 217 |
| L inferior frontal gyrus (BA 45) | −49, 29, 5 | 17 | |
| R superior/middle temporal gyrus (BA 22/38) | 48, −9, 3 | 173 | |
| L superior temporal gyrus (BA 22) | −49, −29, 29 | 111 | |
| L inferior parietal lobe (BA 39) | −57, −28, 20 | 10 | |
| R posterior cingulate gyrus (BA 31) | 2, −48, 27 | 24 | |
| R middle cingulate gyrus (BA 23) | 2, −18, 29 | 24 | |
| Children/adolescents | Mesial frontal/anterior cingulate (BA 9/32) | −5, 44, 31 | 293 |
| L middle temporal gyrus (BA 21) | −54, −26, −3 | 125 | |
| L middle temporal gyrus (BA 39) | −40, −60, 21 | 49 | |
| R middle temporal gyrus (BA 21) | 47, −18, −1 | 122 | |
| R inf. parietal gyrus (BA 39) | 42, −59, 24 | 30 | |
| Posterior cingulate/precuneus (BA 23/30/31) | 2, −54, 20 | 134 | |
| Adults > children/adolescents | Anterior cingulate gyrus (BA 24/32) | 0, 30, 26 | 31 |
Group Brain Activation maps were conducted at P < 0.05 at voxel and P < 0.0025 at cluster‐levels. ANOVAs were conducted at P < 0.05 at voxel and P < 0.01 at cluster level for the comparison between adults and children/adolescents.
Tal. coord., Talairach coordinates, shown for the peak of the 3D activation cluster; BA, Brodman area; N voxels, number of voxels.
Only clusters larger than 10 voxels are reported.
Figure 1.
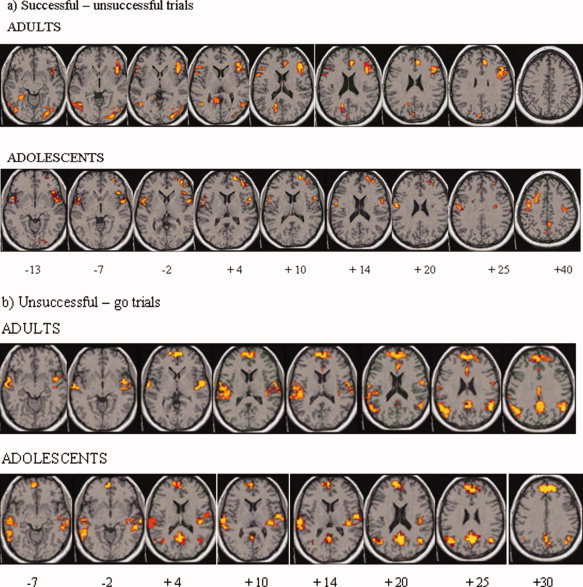
Clusters of brain regions of within‐group activation are shown in horizontal slices in adults and in children/adolescents for (a): the contrast of successful stop trials–unsuccessful stop trials and (b): the contrast of unsuccessful stop trials–go trials. Group activation maps are thresholded at P < 0.05 at voxel and at P < 0.0025 at cluster levels. For the horizontal sections, the z‐coordinate is indicated in distance (mm) from the anterior‐posterior‐commissure. The left side of the brain corresponds to the left side of the image. [Color figure can be viewed in the online issue, which is available at www.interscience.wiley.com.]
During unsuccessful stop trials (contrasted with go‐trials), adults and children/adolescents showed similar activation foci in mainly mesial prefrontal cortex, anterior, and posterior cingulate gyrus (see Table I, Fig. 1b).
Group Differences in Motion
All subjects were within acceptable limits of head motion. No significant group differences were observed in the extent of 3D motion for the x, y, z rotation and x, y, z translation during task performance.
Between‐Group Differences in Activation
ANCOVA (with IQ as covariate) for between‐group differences in brain activation for the successful stop trials contrasted with unsuccessful stop trials showed that adults compared with children/adolescents showed a significant increase of activation in right inferior prefrontal cortex, reaching from orbitofrontal to inferior prefrontal gyrus, bordering premotor cortex (see Table I, Fig. 2a). No brain regions were significantly more activated in children/adolescents compared to adults.
Figure 2.

Brain regions of increased activation in adults compared to children/adolescents (P < 0.01) during (a): successful stop trials contrasted with unsuccessful stop trials. Shown is increased activation in right inferior prefrontal cortex (BA 47/45/44) in adults compared with children/adolescents in 3D and in the horizontal sections. (b) Unsuccessful stop trials contrasted with go‐trials. Shown is increased activation in adults compared with children/adolescents in rostral anterior cingulate gyrus (BA 24) in 3D and in the horizontal sections. For the horizontal sections, the z‐coordinate is indicated in distance (mm) from the anterior‐posterior‐commissure. The left side of the brain corresponds to the left side of the image. [Color figure can be viewed in the online issue, which is available at www.interscience.wiley.com.]
ANCOVA for between‐group differences in brain activation for the contrast of unsuccessful stop trials with go trials showed that there was increased brain activation in adults compared with children/adolescents in pregenual, rostral anterior cingulate gyrus (see Table I, Fig. 2b). No brain regions were significantly more activated in children/adolescents compared with adults.
Whole‐Brain Correlation Analysis Between Age and Brain Activation
For the successful stop trials compared with unsuccessful stop trials, the whole‐brain linear regression analysis with age of all subjects and brain regions showed a positive linear correlation between age and activation in bilateral inferior prefrontal cortex in a large cluster in predominantly right thalamus, insula, caudate, and in the cerebellum. SSRT correlated negatively with activation in bilateral thalamus and caudate and the vermis of the cerebellum. Probability of inhibition correlated positively with bilateral inferior prefrontal gyri, caudate, thalamus, and cerebellum (see Table II, Fig. 3a).
Table II.
Whole‐brain regression analysis showing brain areas of positive and negative linear correlations with age for the successful and unsuccessful stop conditions
| Brain area (BA) | Tal. coord. (x, y, z) | N voxels | Correlation with SSRT, r (P) | Correlation with PI, r (P) |
|---|---|---|---|---|
| Successful stop–unsuccessful stop trials | ||||
| Positive correlations with age | ||||
| R inferior prefrontal (BA 45) | 43, 26, 1 | 24 | −0.3 (0.08) | 0.4 (0.008) |
| L inferior prefrontal (BA 46) | −40, 41, 9 | 96 | 0.4 (0.002) | |
| L medial frontal (BA 9) | −4, 37, 31 | 12 | ||
| L superior temporal (BA 22) | −58, 0, 4 | 22 | 0.4 (0.003) | |
| R thalamus/caudate/insula/temporal/parietal/ posterior cingulate (BA 22/40) | 43, −26, 31 | 332 | 0.3 (0.05) | |
| R thalamus/caudate | 22, −22, 15 | −0.4 (0.009) | ||
| L and R precuneus/posterior cingulate (BA 30/19) | −7, −44, −2 | |||
| R inferior parietal/superior temporal (BA 40/22) | 43, −26, 31 | |||
| L thalamus | −11, −30, 4 | 13 | −0.4 (0.01) | 0.4 (0.003) |
| L caudate | −15, 19, −2 | 10 | 0.4 (0.005) | 0.4 (0.003) |
| R cerebellum/lingual gyrus (BA 19/30) | 30, −70, −7 | 102 | 0.3 (0.04) | |
| M vermis of cerebellum | 0, −66, −24 | 39 | −0.3 (0.05) | 0.3 (0.04) |
| L cerebellum | −25, −63, −13 | 5 | ||
| L precuneus (BA7) | −11, −67, 31 | 36 | ||
| Negative correlations with age | ||||
| R insula/premotor (BA 6) | 40, −4, 4 | 34 | n.s. | |
| R superior temporal (BA 22) | 60, −4, −1 | 10 | n.s. | |
| L thalamus/medial temporal/ posterior cingulate (BA 22/39/30) | −28, −26, 9 | 73 | n.s. | 0.3 (0.04) |
| L putamen/thalamus/insula | −28, 0, 9 | 50 | n.s. | |
| R precuneus/posterior cingulate (BA 31) | 7, −70, 26 | 31 | n.s. | −0.4 (0.008) |
| R inferior parietal (BA 40) | 40, −52, 26 | 16 | n.s. | |
| L inferior parietal (BA 40) | −36, −33, 37 | 11 | n.s. | 0.4 (0.002) |
| Unsuccessful stop–go trials | ||||
| Positive correlations with age | ||||
| Frontal pole (BA 10) | 0, 56, 15 | 30 | ||
| Anterior cingulate (BA 32) | 0, 29, 26 | 22 | ||
| R premotor (BA 6) | 46, −3, 20 | 10 | ||
| R posterior cingulate (BA 31) | 3, −41, 31 | 14 | ||
| R occipital (BA 19) | 3, −66, −2 | 10 | ||
| R occipital (BA 19) | 39, −74, −7 | 40 | ||
| Negative correlations with age | ||||
| L thalamus/caudate/medial temporal/posterior cingulate (BA 29/30) | −26, −22, −7 | 492 | ||
| L caudate | −25, −22, −7 | |||
| L putamen | −22, −11, 9 | |||
| L thalamus | −22, −37, 4 | |||
| L posterior cingulate (BA 30) | −25, −56, 9 | |||
| R putamen | 21, −11, 3 | 18 | ||
| R caudate | 21, −15, 26 | 28 | ||
| R inferior parietal (BA 40) | 43, −29, 20 | 27 | ||
| R posterior cingulate (BA 29/31) | 22, −56, 9 | 18 | ||
Whole brain regression analyses with age as regression variable and IQ as covariate were conducted at P < 0.05 at voxel and P < 0.025 at cluster‐levels.
Tal. coord., Talairach coordinates, shown for the peak of the 3D activation cluster; BA, Brodman area; N voxels, number of voxels.
2D clusters are shown in italic for the larger 3D clusters.
Only cluster larger than 10 voxels are reported.
Pearson correlation coefficient r is reported for correlation between brain activation and inhibitory performance measures (SSRT, stop signal reaction time; PI, probability of inhibition).
Figure 3.

Linear positive and negative correlations with age are shown on horizontal slices for (a) Successful stop trials–unsuccessful stop trials and (b) unsuccessful stop trials–go trials. The z‐coordinate is indicated in distance (mm) from the anterior posterior commissure. Correlation maps are thresholded at P < 0.05 at voxel and at P < 0.025 at cluster levels. The left side of the brain corresponds to the left side of the image. [Color figure can be viewed in the online issue, which is available at www.interscience. wiley.com.]
Negative correlations with age were observed in bilateral insula and in predominantly left thalamus, putamen, and posterior cingulate gyrus. SSRT did not correlate with any of the activation clusters, but probability of inhibition correlated negatively with activation in posterior cingulate gyrus, left parietal lobe, and left thalamus (see Table II, Fig. 3a).
For the unsuccessful stop trials compared with go trials, positive correlations with age were observed mostly in frontal pole and anterior and posterior cingulate. Negative correlations with age were observed in predominantly left thalamus, basal ganglia, and posterior cingulate and parietal cortices (see Table II, Fig. 3b).
Correlation Between Areas of Linear Progressive Changes During Stop Trials
If brain areas of positive linear changes in right and left inferior prefrontal cortices, thalamus, caudate, and cerebellum constitute fronto‐strio‐thalamic and fronto‐cerebellar pathways, they should be intercorrelated. To test for this hypothesis, the mean values of the SSQ ratios for all voxels in the age‐correlated clusters were calculated for each subject, and Pearson correlations (corrected for multiple testing using the FDR) were then performed between these mean SSQ ratios for each subject for each cluster of interest. Figure 4 shows the inter‐regional intercorrelation findings between bilateral age‐correlated activation areas of inferior prefrontal cortex, caudate, thalamus, and cerebellum. Both right and left inferior prefrontal cortices correlated with bilateral caudate, thalamus, and lateral cerebellum. Right and left caudate and thalamus correlated with each other and with the vermis of the cerebellum (see Fig. 4).
Figure 4.
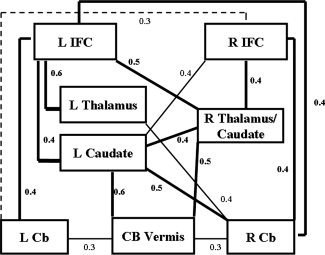
Inter‐regional correlations (Pearson's correlations r) between statistical BOLD response in age‐correlated brain activation clusters that also correlated with inhibitory performance. Bold lines represent correlations at P < 0.01, thin lines at P < 0.05, dashed lines significance at uncorrected P‐value. P‐values are corrected for multiple testing using the FDR.
Group Activation Differences in a Subgroup of Performance‐Matched Subjects
To rule out that subtle differences in performance strategies could have influenced the between‐group difference findings, the data were reanalyzed in more closely performance‐matched subgroups (excluding the three worst performers from the adolescent group). The group activation differences remained essentially unchanged.
Group Activation Differences in a Subgroup of IQ‐Matched Subjects
Although inhibitory dependent measures of the stop task have been shown to be unrelated to IQ [Rubia et al.,1998a,b,2007], the group comparison was reanalyzed in IQ‐matched subgroups, excluding seven participants with values at the extreme end of the distribution (IQ scores: Adults (SD): 113 (11), Adolescents: 109 (11), df = 38, P = n.s.). The group activation differences remained at a P‐value of P < 0.05 for voxel and P < 0.05 for cluster comparisons.
DISCUSSION
An individually adjusted tracking stop paradigm was used to compare brain activation between adults and children/adolescents during equal numbers of successful and failed stop trials and to investigate linear age effects. Despite comparable task performance, adults showed increased brain activation compared with children/adolescents in right inferior prefrontal cortex during successful inhibition and in rostral anterior cingulate gyrus during stop failures. The main findings remained when IQ‐matched and more tightly performance‐controlled subgroups were being compared, suggesting that neither IQ nor nonsignificant strategy differences accounted for the activation differences. Whole‐brain regression analysis with age between the age span of 10 and 42 years across all subjects showed linear progressive changes during stop trials in bilateral inferior prefrontal cortex and in bilateral, but predominantly right thalamus, caudate, and cerebellum. These areas of positive linear changes correlated with each other and with measures of inhibitory task performance, suggesting that they form fronto‐striato‐thalamic [Alexander et al.,1986] and fronto‐thalamo‐cerebellar pathways [Middleton and Strick,2000] mediating inhibitory control. Linear progressive changes during inhibition failures were observed in predominantly anterior and posterior cingulate gyri and medial frontal lobe. Linear regressive changes during both conditions were observed in predominantly left hemispheric temporo‐parietal and subcortical brain regions. The findings show age‐related development of the integrated function of inferior prefrontal cortex, basal ganglia, thalamus, and cerebellum during inhibitory control and of a midline attentional network comprising anterior and posterior cingulate gyrus during error‐related processes in a task design that controls for differences in difficulty levels.
The increased activation in adults in right inferior prefrontal cortex and the linear age correlation in this area during stop trials was hypothesized. Right inferior prefrontal cortex has consistently been implicated in motor response inhibition in functional imaging studies during the stop [Aron and Poldrack,2006; Rubia et al.,2000,2001,2003] and go/no‐go tasks [Kawashima et al.,1996; Konishi et al.,1998; Menon et al.,2001], which has been confirmed by lesion [Aron et al.,2003] and transcranial magnetic stimulation studies [Chambers et al.,2006]. The direct comparison between adults and adolescents elicited right inferior prefrontal activation increase in adults, whereas the whole‐brain regression analysis showed progressive linear changes in bilateral inferior prefrontal cortex. The findings are in line with previous evidence for age‐related changes in right and left inferior prefrontal cortex during motor inhibition. Activation increase has been observed in bilateral [Bunge et al.,2002] and in right inferior prefrontal cortex [Durston et al.,2002b] in adults compared with children during event‐related go/no‐go tasks. The findings of linear age‐related changes in left inferior prefrontal cortex extend previous findings of linear age‐related changes in this brain region during block design go/no‐go [Tamm et al.,2002] and stop tasks [Rubia et al.,2000] between the age ranges of 8 and 20 and 12 and 40, respectively, whereas the findings of linear progressive changes in right inferior prefrontal activation in the age range of 10–42 years extends similar findings between the ages of 9 and 11 years in a combined longitudinal and cross‐sectional study [Durston et al.,2006].
The findings of progressive frontal changes with development in a task design that controls for differences in difficulty levels supports the evidence for frontal lobe increase [Bunge et al.,2002; Durston et al.,2006; Rubia et al.,2000; Tamm et al.,2002], rather than decrease with age during inhibition [Booth et al.,2003; Casey et al.,1997; Durston et al.,2002b]. Previous findings of increased activation in prefrontal brain regions in children compared with adults during motor response inhibition [Booth et al.,2003; Casey et al.,1997; Durston et al.,2002b] may reflect the need for greater effort in children to manage performance on tasks that are not adjusted for difficulty levels. This underlines the importance of adjusting for difficulty levels in developmental studies.
To our knowledge, the findings of progressive changes in subcortical brain regions including thalamus and cerebellum during motor inhibition are novel. Since the linear developmental activation changes in left and right thalamus and cerebellum correlated with each other, with the developmental changes in bilateral inferior prefrontal cortices and caudate, and with inhibitory performance measures, they are likely to form developing fronto‐striato‐thalamic and fronto‐thalamo‐cerebellar neural networks mediating inhibitory capacity. The findings extend previous evidence for post‐adolescent functional maturation of the frontal lobes during inhibitory control by showing postadolescent maturation of the subcortical parts of fronto‐stiato‐thalamic and fronto‐thalamo‐cerebellar pathways of motor inhibition.
Inhibitory motor response in go/no‐go and stop tasks has been suggested to be mediated by fronto‐striato‐thalamic pathways, based on evidence from lesion [Godefroy et al.,1996; Rieger et al.,2003] and imaging studies implicating the basal ganglia [Kelly et al.,2004; Rubia et al.,1999,2000,2006] and the thalamus [Garavan et al.,2002; Liddle et al.,2001] in motor inhibition tasks. In studies using the stop task in healthy adults, the basal ganglia [Vink et al.,2005] and the thalamus [Aron and Poldrack,2006] have been found to correlate with SSRT and to be more strongly activated in better performers. Although there is thus evidence from adult studies for the involvement of frontal, striatal, and thalamic brain regions for inhibitory control, the evidence for functional development of the striatal and thalamic parts of fronto‐striato‐thalamic networks for inhibitory control, however, has been inconclusive so far. Two previous studies have shown activation increase in left and right caudate, respectively, in adults compared with children during a go/no‐go task [Durston et al.,2002b; Rubia et al., in press‐a,b]. Other studies, however, found left caudate to be decreased in adults compared with adolescents during go/no‐go [Booth et al.,2003] and stop tasks [Rubia et al.,2000], or not to differ between children and adults during a go/no‐go task [Bunge et al.,2002]. The use of relatively small subject numbers in previous developmental imaging studies of inhibition may be responsible for these relatively inconsistent findings of caudate maturation, which may only be observable with larger detective power in fMRI. In this study, we observed progressive changes in predominantly right basal ganglia and thalamus with regressive changes in predominantly left hemispheric homologue areas. Shifts in laterality of basal ganglia activation from left to right with increasing age would reconcile apparent inconsistencies in previous findings. Although no previous studies have reported progressive changes in thalamus, the regressive changes in left thalamus are in line with findings of Booth et al. [2003] of increased activation in left thalamus in children. The progressive age‐related shift in right‐lateralization of basal ganglia and thalamus is also in line with evidence for a prominent role of right hemispheric fronto‐striato‐thalamic networks for inhibitory control in adults [Aron and Poldrack,2006; Aron et al.,2003; Durston et al.,2002a; Rieger et al.,2003; Rubia et al.,2001,2003,2006]. Shifts in laterality have previously been observed in developmental imaging studies of cognitive control in frontal brain regions [Bunge et al.,2002; Rubia et al.,2000] and may reflect progressive focalization of lateralized neural networks for task performance.
Developmental functional changes in fronto‐striato‐thalamic neural networks parallel structural developmental changes in striatal and thalamic brain regions alongside prefrontal lobe changes between childhood and midadulthood [Castellanos et al.,2002; Giedd et al.,1999; Sowell et al.,1999b; Sowell et al.,1999a]. They are also in line with recent evidence for progressive structural maturation of fronto‐striatal fiber tracts between the age range of 7–31 years, which correlated with inhibitory performance on a go/no‐go task [Liston et al.,2005].
The cerebellum has rarely been measured in older fMRI studies because of technical limitations of whole brain coverage. In more recent imaging studies, however, the cerebellum has been shown to be activated in adults during inhibitory control in the go/no‐go task [Bunge et al.,2002; Garavan et al.,2003; Liddle et al.,2001; Mostofski et al.,2003; Rubia et al.,2006]. In this study, the lateral cerebellum was activated in both children and adults during stop trials. The lateral cerebellum projects via the thalamus to motor, but also prefrontal cortical areas [Kim et al.,1994; Middleton and Strick,2000] and is likely to assist in both the preparation and inhibition of movement [Luna et al.,2001; Mostofski et al.,2003]. Related to our findings of progressive changes in cerebellum during motor response inhibition are findings of linear changes in left cerebellum between the ages of 8 and 30 during reflex inhibition in the antisaccade task [Luna et al.,2001]. The findings of age‐correlated progressive recruitment of the lateral cerebellum and vermis concomitantly and in correlation with right inferior prefrontal cortex and thalamus suggest a developmental functional enhancement, possibly reflecting fine‐tuning of the projections between frontal cortex, thalamus, basal ganglia, and cerebellum that mediate inhibitory control.
The finding of increased brain activation in adults in anterior cingulate gyrus and of progressive age‐related changes in this area and medial frontal cortex during inhibition failure is also in line with the apriori hypothesis. As far as we are aware, this is the first developmental fMRI study of error‐related brain activation. Subjects received implicit feedback when they made an error to stop trials by seeing the stop signal appear after they pressed the response button. Although enhanced in adults, anterior cingulate and medial frontal activation was observed in both age groups, in line with the postulated role of this brain region in error detection during no‐go [Garavan et al.,2002; Hester et al.,2004; Liddle et al.,2001; Menon et al.,2001] and stop trials [Rubia et al.,2003]. These first developmental fMRI findings of a positive age‐correlation in anterior cingulate are in line with EEG studies showing discrete and positive linear changes in the error‐related negative amplitudes—shown to be originating in anterior cingulate—between early childhood to late adolescence [Davies et al.,2004a; Ladouceur et al.,2004] and into midadulthood [Davies et al.,2004b].
It has been debated whether anterior cingulate activation, in particular the rostral part, in tasks of response conflict is specifically error‐related [Fiehler et al.,2004; Garavan et al.,2002,2003; Hester et al.,2004; Ridderinkhof et al.,2004; Ullsperger and von Cramon,2001,2004a,b) or whether it has a more general role of a conflict detector, independent of whether errors are being committed or not [Botvinick et al.,1999; Braver et al.,2001; Carter et al.,1998,1999,2000]. Our findings support the role of rostral anterior cingulate gyrus for error‐related processes since we did not observe anterior cingulate activation during the successful inhibition trials, which had the same load in response competition as the unsuccessful stop trials.
It is also possible that anterior cingulate activation is related to more general functions that are triggered after committing an error, such as autonomic arousal [Critchley et al.,2000; Fellows and Farah,2005] or generic motor attention functions [Mesulam et al.,2001; Rubia et al.,1998a,b,2000; Small et al.,2003]. In fact, developmental effects in rostral anterior cingulate activation have been observed during other cognitive functions that are not specifically error‐related, including performance on go/no‐go [Bunge et al.,2002; Rubia et al., in press‐a,b], Switch [Rubia et al.,2006], Stroop [Adleman et al.,2002], and motor timing tasks [Rubia et al.,2000]. Relatively context‐independent functions of executive attention, arousal, and performance‐monitoring mediated by anterior cingulate gyrus may thus be key functions underlying cognitive development that mature progressively into midadulthood.
Regressive changes were observed during both task conditions in predominantly left hemispheric thalamo‐striatal, temporo‐parietal, and posterior cingulate regions. Regressive changes are likely to reflect more immature brain activation patterns, possibly compensating for the decreased activation in more focalized right fronto‐striato‐thalamic and fronto‐thalamo‐cerebellar networks for inhibitory control. This is supported by the negative correlation between probability of inhibition and negative age‐correlated brain regions during stop trials in left thalamus, posterior cingulate, and posterior parietal lobe, suggesting that poorer inhibitory capacity is related to increased posterior brain activation.
The findings of postadolescent linear regressive changes in posterior brain regions during stop task performance extend previous imaging studies that found increased activation in younger subjects compared with older ones in posterior brain regions, including temporal, parietal, and posterior cingulate cortices during go/no‐go tasks [Booth et al.,2003; Durston et al.,2002b,2006; Rubia et al.,2006]. Our findings largely support the evidence‐based suggestion that development is characterized by a shift from more diffuse to more focal, task‐relevant activation patterns as well as shifts in laterality [Durston and Casey,2006].
These findings of progressive functional maturation between childhood and adulthood of fronto‐strio‐cerebellar networks for inhibition may elucidate the neural substrates of impulsive adolescent behavior. They also have implications for childhood pathologies of impulsiveness that are thought to be caused by a maturational delay such as children with ADHD [Castellanos et al.,2002; Rubia et al.,2000] or preterm birth [Petersen et al.,2002]. Both pathologies show reduced brain activation compared with age‐matched controls during inhibition tasks in similar foci of inferior prefrontal [Nosarti et al.,2006; Rubia et al.,1999,2005, b), caudate, thalamus, and cerebellar regions [Nosarti et al.,2006; Rubia et al.,1999,2000] that were age‐correlated in this study, which is in support of the maturational delay hypothesis of these pathologies.
CONCLUSIONS
The findings of this study show that during an individually adjusted stop task that controlled for group differences in task difficulty and performance, adults compared with children/adolescents show increased activation in right inferior prefrontal cortex during inhibition and in anterior cingulate gyrus during inhibition failures. Whole‐brain regression analysis with age confirmed linear progressive changes in these brain regions between the ages of 10 and 42, and in addition showed progressive changes in bilateral inferior prefrontal, striato‐thalamic, and cerebellar brain regions. Areas of progressive changes correlated with each other and with inhibitory performance, suggesting they form developing fronto‐striato‐thalamic and fronto‐cerebellar networks that mediate efficient response inhibition. The study gives evidence for neurocognitive specialization and age related development of the integrated function of prefrontal, striato‐thalamic, and cerebellar brain regions in relation to inhibitory capacity and of cingulate regions in relation to performance‐monitoring skills in the transition from childhood to adulthood.
REFERENCES
- Adleman NE, Menon V, Blasey CM, White CD, Warsofsky IS, Glover GH, Reiss AL( 2002): A developmental fMRI study of the stroop color‐word task. Neuroimage 16: 61–75. [DOI] [PubMed] [Google Scholar]
- Alexander GE, DeLong MR, Strick PL( 1986): Parallel organization of functionally segregated circuits linking basal ganglia and cortex. Annu Rev Neurosci 9: 357–381. [DOI] [PubMed] [Google Scholar]
- Aron AR, Poldrack RA( 2006): Cortical and subcortical contributions to stop signal response inhibition: Role of the subthalamic nucleus. J Neurosci 26: 2424–2433. [DOI] [PMC free article] [PubMed] [Google Scholar]
- Aron AR, Fletcher PC, Bullmore ET, Sahakian BJ, Robbins TW( 2003): Stop‐signal inhibition disrupted by damage to right inferior frontal gyrus in humans (Vol. 6, pp 115, 2003). Nat Neurosci 6: 1329–1329. [DOI] [PubMed] [Google Scholar]
- Benjamini Y, Hochberg Y( 1995): Controlling the false discovery rate—A practical and powerful approach to multiple testing. J R Stat Soc B Met 57: 289–300. [Google Scholar]
- Bjorklund DF, Harnishfeger KK( 1990): The resources construct in cognitive‐development—Diverse sources of evidence and a theory of inefficient inhibition. Dev Rev 10: 48–71. [Google Scholar]
- Booth JR, Burman DD, Meyer JR, Lei Z, Trommer BL, Davenport ND, Li W, Parrish TB, Gitelman DR, Mesulam MM( 2003): Neural development of selective attention and response inhibition. Neuroimage 20: 737–751. [DOI] [PubMed] [Google Scholar]
- Botvinick M, Nystrom LE, Fissell K, Carter CS, Cohen JD( 1999): Conflict monitoring versus selection‐for‐action in anterior cingulate cortex. Nature 402: 179–181. [DOI] [PubMed] [Google Scholar]
- Brammer MJ, Bullmore ET, Simmons A, Williams SC, Grasby PM, Howard RJ, Woodruff PW, Rabe‐Hesketh S( 1997): Generic brain activation mapping in functional magnetic resonance imaging: A nonparametric approach. Magn Reson Imaging 15: 763–770. [DOI] [PubMed] [Google Scholar]
- Braver TS, Barch DM, Gray JR, Molfese DL, Snyder A( 2001): Anterior cingulate cortex and response conflict: Effects of frequency, inhibition and errors. Cereb Cortex 11: 825–836. [DOI] [PubMed] [Google Scholar]
- Brown TT, Lugar HM, Coalson RS, Miezin FM, Petersen SE, Schlaggar BL( 2005): Developmental changes in human cerebral functional organization for word generation. Cereb Cortex 15: 275–290. [DOI] [PubMed] [Google Scholar]
- Bullmore ET, Suckling J, Overmeyer S, Rabe‐Hesketh S, Taylor E, Brammer MJ( 1999): Global, voxel, and cluster tests, by theory and permutation, for a difference between two groups of structural MR images of the brain. IEEE Trans Med Imaging 18: 32–42. [DOI] [PubMed] [Google Scholar]
- Bullmore E, Long C, Suckling J, Fadili J, Calvert G, Zelaya F, Carpenter TA, Brammer M( 2001): Colored noise and computational inference in neurophysiological (fMRI) time series analysis: Resampling methods in time and wavelet domains. Hum Brain Mapp 12: 61–78. [DOI] [PMC free article] [PubMed] [Google Scholar]
- Bunge SA, Dudukovic NM, Thomason ME, Vaidya CJ, Gabrieli JDE( 2002): Immature frontal lobe contributions to cognitive control in children: Evidence from fMRI. Neuron 33: 301–311. [DOI] [PMC free article] [PubMed] [Google Scholar]
- Burrock MA, Buckner RL, Woldorff MG, Rosen BR, Dale A( 1998): Randomised event‐related experimental designs allow for extremely rapid presentation rates using functional MRI. Neuroreport 9: 3735–3739. [DOI] [PubMed] [Google Scholar]
- Carter C, Braver TS, Barch DM, Botvinick MM, Noll D, Cohen JD( 1998): Anterior cingulate cortex, error detection and the on‐line monitoring of performance. Science 280: 747–749. [DOI] [PubMed] [Google Scholar]
- Carter CS, Botvinick MM, Cohen JD( 1999): The contribution of the anterior cingulate cortex to executive processes in cognition. Rev Neurosci 10: 49–57. [DOI] [PubMed] [Google Scholar]
- Carter CS, Macdonald AM, Botvinick M, Ross LL, Stenger VA, Noll D, Cohen JD( 2000): Parsing executive processes: Strategic vs. evaluative functions of the anterior cingulate cortex. Proc Natl Acad Sci USA 97: 1944–1948. [DOI] [PMC free article] [PubMed] [Google Scholar]
- Casey BJ, Trainor RJ, Orendi JL, Schubert AB, Nystrom LE, Giedd JN, Castellanos FX, Haxby JV, Noll DC, Cohen JD, Forman SD, Dahl RE, Rapoport JL ( 1997): A developmental functional MRI study of prefrontal activation during performance of a Go‐No‐Go task. J Cogn Neurosci 9: 835–847. [DOI] [PubMed] [Google Scholar]
- Casey BJ, Thomas KM, Davidson MC, Kunz K, Franzen PL( 2002): Dissociating striatal and hippocampal function developmentally with a stimulus‐response compatibility task. J Neurosci 22: 8647–8652. [DOI] [PMC free article] [PubMed] [Google Scholar]
- Castellanos FX, Lee PP, Sharp W, Jeffries NO, Greenstein DK, Clasen LS, Blumenthal JD, James RS, Ebens CL, Walter JM, Zijdenbos A, Evans AC, Giedd JN, Rapoport JL ( 2002): Developmental trajectories of brain volume abnormalities in children and adolescents with attention‐deficit/hyperactivity disorder. JAMA 288: 1740–1748. [DOI] [PubMed] [Google Scholar]
- Chambers CD, Bellgrove MA, Stokes MG, Henderson TR, Garavan H, Robertson IH, Morris AP, Mattingley JB( 2006): Executive ‘brake failure’ following deactivation of human frontal lobe. J Cogn Neurosc 18: 444–455. [DOI] [PubMed] [Google Scholar]
- Changeux JP, Danchin A( 1976): Selective stabilization of developing synapses as a mechanism for specification of neuronal networks. Nature 264: 705–712. [DOI] [PubMed] [Google Scholar]
- Critchley H, Daly E, Phillips M, Brammer M, Bullmore E, Williams S, Van Amelsvoort T, Robertson D, David A, Murphy D( 2000): Explicit and implicit neural mechanisms for processing of social information from facial expressions: A functional magnetic resonance imaging study. Hum Brain Mapp 9: 93–105. [DOI] [PMC free article] [PubMed] [Google Scholar]
- Dale AM( 1999): Optimal design for event‐related fMRI. Hum Brain Mapp 8: 109–114. [DOI] [PMC free article] [PubMed] [Google Scholar]
- Dale AM, Buckner RL( 1997): Selected averaging of rapidly presented individual trials using fMRI. Hum Brain Mapp 5: 329–340. [DOI] [PubMed] [Google Scholar]
- Davies PL, Segalowitz SJ, Gavin WJ( 2004a): Development of error‐monitoring event‐related potentials in adolescents. Ann N Y Acad Sci 1021: 324–328. [DOI] [PubMed] [Google Scholar]
- Davies PL, Segalowitz SJ, Gavin WJ( 2004b): Development of response‐monitoring ERPs in 7‐to 25‐year‐olds. Dev Neuropsychol 25: 355–376. [DOI] [PubMed] [Google Scholar]
- Dempster FN( 1992): The rise and fall of the inhibitory mechanism—Toward a unified theory of cognitive‐development and aging. Dev Rev 12: 45–75. [Google Scholar]
- Durston S, Casey BJ( 2006): What have we learned about cognitive development from neuroimaging? Neuropsychologia 44: 2149–2157. [DOI] [PubMed] [Google Scholar]
- Durston S, Thomas KM, Yang YH, Ulug AM, Zimmerman RD, Casey BJ( 2002a): A neural basis for the development of inhibitory control. Dev Sci 5: F9–F16. [Google Scholar]
- Durston S, Thomas KM, Worden MS, Yang Y, Casey BJ( 2002b): The effect of preceding context on inhibition: An event‐related fMRI study. Neuroimage 16: 449–453. [DOI] [PubMed] [Google Scholar]
- Durston S, Davidson M, Tottenham N, Galvan A, Spicer J, Fossella JA, Casey BJ( 2006): A shift from diffuse to focal brain activation during development. Dev Sci 5: F9–F16. [DOI] [PubMed] [Google Scholar]
- Fellows LK, Farah MJ( 2005): Is anterior cingulate cortex necessary for cognitive control? Brain 128: 788–796. [DOI] [PubMed] [Google Scholar]
- Fiehler K, Ullsperger M, von Cramon DY( 2004): Neural correlates of error detection and error correction: Is there a common neuroanatomical substrate? Eur J Neurosci 19: 3081–3087. [DOI] [PubMed] [Google Scholar]
- Garavan H, Ross TJ, Stein EA( 1999): Right hemispheric dominance of inhibitory control: An event‐related functional MRI study. Proc Natl Acad Sci USA 96: 8301–8306. [DOI] [PMC free article] [PubMed] [Google Scholar]
- Garavan H, Ross TJ, Murphy K, Roche RAP, Stein EA( 2002): Dissociable executive functions in the dynamic control of behavior: Inhibition, error detection, and correction. Neuroimage 17: 1820–1829. [DOI] [PubMed] [Google Scholar]
- Garavan H, Ross TJ, Kaufman J, Stein EA( 2003): A midline dissociation between error‐processing and response‐conflict monitoring. Neuroimage 20: 1132–1139. [DOI] [PubMed] [Google Scholar]
- Giedd JN, Blumenthal J, Jeffries NO, Castellanos FX, Liu H, Zijdenbos A, Paus T, Evans AC, Rapoport JL( 1999): Brain development during childhood and adolescence: A longitudinal MRI study. Nat Neurosci 2: 861–863. [DOI] [PubMed] [Google Scholar]
- Godefroy O, Lhullier C, Rousseaux M( 1996): Non‐spatial attention disorders in patients with frontal or posterior brain damage. Brain 119: 191–202. [DOI] [PubMed] [Google Scholar]
- Gogtay N, Giedd JN, Lusk L, Hayashi KM, Greenstein D, Vaituzis AC, Nugent TF, Herman DH, Clasen LS, Toga AW, Rapoport JL, Thompson PM ( 2004): Dynamic mapping of human cortical development during childhood through early adulthood. Proc Natl Acad Sci USA 101: 8174–8179. [DOI] [PMC free article] [PubMed] [Google Scholar]
- Grossman M, Cooke A, DeVita C, Alsop D, Detre J, Chen W, Gee J( 2002): Age‐related changes in working memory during sentence comprehension: An fMRI study. Neuroimage 15: 302–317. [DOI] [PubMed] [Google Scholar]
- Hester R, Fassbender C, Garavan H( 2004): Individual differences in error processing: A review and reanalysis of three event‐related fMRI studies using the GO/NOGO task. Cereb Cortex 14: 986–994. [DOI] [PubMed] [Google Scholar]
- Huttenlocher PR, Dabholkar AS( 1997): Regional differences in synaptogenesis in human cerebral cortex. J Comp Neurol 387: 167–178. [DOI] [PubMed] [Google Scholar]
- Jones LB, Rothbart MK, Posner MI( 2003): Development of executive attention in preschool children. Dev Sci 6: 498–504. [Google Scholar]
- Kawashima R, Satoh K, Itoh H, Ono S, Furumoto S, Gotoh R, Koyama M, Yoshioka S, Takahashi T, Takahashi K, Yanagisawa T, Fukuda H ( 1996): Functional anatomy of go/no‐go discrimination and response selection—A pet study in man. Brain Res 728: 79–89. [PubMed] [Google Scholar]
- Kelly AMC, Hester R, Murphy K, Javitt DC, Foxe JJ, Garavan H( 2004): Prefrontal‐subcortical dissociations underlying inhibitory control revealed by event‐related fMRI. Eur J Neurosci 19: 3105–3112. [DOI] [PubMed] [Google Scholar]
- Kim SG, Ugurbil K, Strick PL( 1994): Activation of a cerebellar output nucleus during cognitive processing. Science 265: 949–951. [DOI] [PubMed] [Google Scholar]
- Konishi S, Nakajima K, Uchida I, Sekihara K, Miyashita Y( 1998): No‐go dominant brain activity in human inferior prefrontal cortex revealed by functional magnetic resonance imaging. Eur J Neurosci 10: 1209–1213. [DOI] [PubMed] [Google Scholar]
- Ladouceur CD, Dahl RE, Carter CS( 2004): ERP correlates of action monitoring in adolescence. Adolescent brain development: Vulnerabilities and opportunities. Ann N Y Acad Sci 1021: 329–336. [DOI] [PubMed] [Google Scholar]
- Levin HS, Culhane KA, Hartmann J, Evankovich K, Mattson AJ, Harward H, Ringholz G, Ewingcobbs L, Fletcher JM( 1991): Developmental‐changes in performance on tests of purported frontal‐lobe functioning. Dev Neuropsychol 7: 377–395. [Google Scholar]
- Liddle PF, Kiehl KA, Smith AM( 2001): Event‐related fMRI study of response inhibition. Hum Brain Mapp 12: 100–109. [DOI] [PMC free article] [PubMed] [Google Scholar]
- Liston C, Watts R, Tottenham N, Davidson MC, Niogi S, Ulug AM, Casey BJ( 2005): Fronto‐striatal microstructure modulates efficient recruitment of cognitive control. Cereb Cortex 16: 553–560. [DOI] [PubMed] [Google Scholar]
- Logan GD, Schachar RJ, Tannock R( 1997): Impulsivity and inhibitory control. Psychol Sci 8: 60–64. [Google Scholar]
- Luna B, Thulborn KR, Munoz DP, Merriam EP, Garver KE, Minshew NJ, Keshavan MS, Genovese CR, Eddy WF, Sweeney JA( 2001): Maturation of widely distributed brain function subserves cognitive development. Neuroimage 13: 786–793. [DOI] [PubMed] [Google Scholar]
- Menon V, Adleman NE, White CD, Glover GH, Reiss AL( 2001): Error‐related brain activation during a Go/NoGo response inhibition task. Hum Brain Mapp 12: 131–143. [DOI] [PMC free article] [PubMed] [Google Scholar]
- Mesulam MM, Nobre AC, Kim YH, Parrish TB, Gitelman DR( 2001): Heterogeneity of cingulate contributions to spatial attention. Neuroimage 13: 1065–1072. [DOI] [PubMed] [Google Scholar]
- Middleton FA, Strick PL( 2000): Basal ganglia and cerebellar loops: Motor and cognitive circuits. Brain Res Rev 31: 236–250. [DOI] [PubMed] [Google Scholar]
- Mostofsky SH, Schafer JGB, Abrams MT, Goldberg MC, Flower AA, Boyce A, Courtney SM, Calhoun VD, Kraut MA, Denckla MB, Pekar JJ( 2003): fMRI evidence that the neural basis of response inhibition is task‐dependent. Cogn Brain Res 17: 419–430. [DOI] [PubMed] [Google Scholar]
- Murphy K, Garavan H( 2004): An empirical investigation into the number of subjects required for an event‐related fMRI study. Neuroimage 22: 879–885. [DOI] [PubMed] [Google Scholar]
- Nosarti C, Rubia K, Smith A, Frearson S, Williams S, Rifkin L, Murray R( 2006): Altered functional neuroanatomy of response inhibition in adolescent boys who were born very preterm. Dev Med Child Neurol 48: 265–271. [DOI] [PubMed] [Google Scholar]
- Paus T, Zijdenbos A, Worsley K, Collins DL, Blumenthal J, Giedd JN, Rapoport JL, Evans AC( 1999): Structural maturation of neural pathways in children and adolescents: In vivo study. Science 283: 1908–1911. [DOI] [PubMed] [Google Scholar]
- Petersen B, Vohr B, Kane M, Whalen D, Schneider K, Katz K, Zhang H, Duncan C, Makuch R, Gore C, Ment L( 2002): A functional magnetic resonance imaging study of language processing and its cognitive correlates in prematurely born children. Pediatrics 110: 1153–1162. [DOI] [PubMed] [Google Scholar]
- Raven J 1960: Guide to the Standard Progressive Matrices. London: HK Lewis. [Google Scholar]
- Ridderinkhof KR, Ullsperger M, Crone EA, Nieuwenhuis S( 2004): The role of the medial frontal cortex in cognitive control. Science 15: 443–447. [DOI] [PubMed] [Google Scholar]
- Rieger M, Gauggel S, Burmeister K( 2003): Inhibition of ongoing responses following frontal, nonfrontal, and basal ganglia lesions. Neuropsychology 17: 272–282. [DOI] [PubMed] [Google Scholar]
- Rubia K( 2002): The dynamic approach to neurodevelopmental psychiatric disorders: Use of fMRI combined with neuropsychology to elucidate the dynamics of psychiatric disorders, exemplified in ADHD and schizophrenia. Behav Brain Res 130: 47–56. [DOI] [PubMed] [Google Scholar]
- Rubia K, Oosterlaan J, Sergeant JA, Brandeis D, von Leeuwen T( 1998a): Inhibitory dysfunction in hyperactive boys. Behav Brain Res 94: 25–32. [DOI] [PubMed] [Google Scholar]
- Rubia K, Overmeyer S, Taylor E, Brammer M, Williams S, Simmons A, Andrew C, Bullmore E( 1998b): Prefrontal involvement in “temporal bridging” and timing movement. Neuropsychologia 36: 1283–1293. [DOI] [PubMed] [Google Scholar]
- Rubia K, Overmeyer S, Taylor E, Brammer M, Williams SCR, Simmons A, Bullmore E( 1999): Hypofrontality in attention deficit hyperactivity disorder ADHD during higher‐order motor control: A study using fMRI. Am J Psychiatry 156: 891–896. [DOI] [PubMed] [Google Scholar]
- Rubia K, Overmeyer S, Taylor E, Brammer M, Williams S, Simmons A, Andrew C, Bullmore E( 2000): Functional frontalisation with age: Mapping neurodevelopmental trajectories with fMRI. Neurosci Biobehav Rev 24: 13–19. [DOI] [PubMed] [Google Scholar]
- Rubia K, Russell T, Overmeyer S, Brammer MJ, Bullmore ET, Sharma T, Simmons A, Williams SCR, Giampietro V, Andrew CM, et al. ( 2001): Mapping motor inhibition: Conjunctive brain activations across different versions of go/no‐go and stop tasks. Neuroimage 13: 250–261. [DOI] [PubMed] [Google Scholar]
- Rubia K, Smith AB, Brammer MJ, Taylor E( 2003): Right inferior prefrontal cortex mediates response inhibition while mesial prefrontal cortex is responsible for error detection. Neuroimage 20: 351–358. [DOI] [PubMed] [Google Scholar]
- Rubia K, Lee F, Cleare A, Tunstall N, Fu C, McGuire P( 2005a): Acute tryptophan depletion reduces right inferior prefrontal activation during response inhibition in fast, event related fMRI. Psychopharmacology 179: 791–801. [DOI] [PubMed] [Google Scholar]
- Rubia K, Smith AB, Brammer M, Toone B, Taylor E( 2005b): Medication‐naïve adolescents with attention‐deficit hyperactivity disorder show abnormal brain activation during inhibition and error detection. Am J Psychiatry 162: 1067–1075. [DOI] [PubMed] [Google Scholar]
- Rubia K, Smith A, Taylor E ( 2007): Performance of children with attention deficit hyperactivity disorder (ADHD) on a test battery for impulsiveness. Child Neuropsychology 13: 276–304. [DOI] [PubMed] [Google Scholar]
- Rubia K, Smith AB, Woolley J, Nosarti C, Heyman I, Taylor E, Brammer MJ( 2006): Progressive increase of fronto‐striatal brain activation from childhood to adulthood during event related tasks of cognitive control. Hum Brain Mapp 27: 973–993. [DOI] [PMC free article] [PubMed] [Google Scholar]
- Schlaggar BL, Brown TT, Lugar HM, Visscher KM, Miezin FM, Petersen SE( 2002): Functional neuroanatomical differences between adults and school‐age children in the processing of single words. Science 296: 1476–1479. [DOI] [PubMed] [Google Scholar]
- Small DM, Gitelman DR, Gregory MD, Nobre AC, Parrish TB, Mesulam MM( 2003): The posterior cingulate and medial prefrontal cortex mediate the anticipatory allocation of spatial attention. Neuroimage 18: 633–641. [DOI] [PubMed] [Google Scholar]
- Sowell ER, Thompson PM, Holmes CJ, Jernigan TL, Toga AW( 1999a): In vivo evidence for post‐adolescent brain maturation in frontal and striatal regions. Nat Neurosci 2: 859–861. [DOI] [PubMed] [Google Scholar]
- Sowell ER, Thompson PM, Holmes CJ, Batth R, Jernigan TL, Toga AW( 1999b): Localizing age‐related changes in brain structure between childhood and adolescence using statistical parametric mapping. Neuroimage 9: 587–597. [DOI] [PubMed] [Google Scholar]
- Sowell ER, Thompson PM, Toga AW( 2004): Mapping changes in the human cortex throughout the span of life. Neuroscientist 10: 372–392. [DOI] [PubMed] [Google Scholar]
- Talairach J, Tournoux P ( 1988): Co‐planar Stereotaxic Atlas of the Brain. New York: Thieme. [Google Scholar]
- Tamm L, Menon V, Reiss AL( 2002): Maturation of brain function associated with response inhibition. J Am Acad Child Adolesc Psychiatry 41: 1231–1238. [DOI] [PubMed] [Google Scholar]
- Thomas KM, Hunt RH, Vizueta N, Sommer T, Durston S, Yang YH, Worden MS( 2004): Evidence of developmental differences in implicit sequence learning: An fMRI study of children and adults. J Cogn Neurosci 16: 1339–1351. [DOI] [PubMed] [Google Scholar]
- Ullsperger M, von Cramon DY( 2001): Subprocesses of performance monitoring: A dissociation of error processing and response competition revealed by event‐related fMRI and ERPs. Neuroimage 14: 1387–1401. [DOI] [PubMed] [Google Scholar]
- Ullsperger M, von Cramon DY( 2004a): Decision making, performance and outcome monitoring in frontal cortical areas. Nat Neurosci 7: 1173–1174. [DOI] [PubMed] [Google Scholar]
- Ullsperger M, von Cramon DY( 2004b): Neuroimaging of performance monitoring: Error detection and beyond. Cortex 40: 593–604. [DOI] [PubMed] [Google Scholar]
- Vink M, Kahn RS, Raemakers M, van den Heuvel M, Boersma M, Ramsey NF( 2005): Function of striatum beyond inhibition and execution of motor responses. Hum Brain Mapp 25: 336–344. [DOI] [PMC free article] [PubMed] [Google Scholar]
- Williams BR, Ponesse JS, Schachar RJ, Logan GD, Tannock R( 1999): Development of inhibitory control across the life span. Dev Psychol 35: 205–213. [DOI] [PubMed] [Google Scholar]