

Abstract
Imaging techniques have been used to elucidate the neural correlates that underlie deception. The scientifically best understood paradigm for the detection of deception, however, the guilty knowledge test (GKT), was rarely used in imaging studies. By transferring a GKT‐paradigm to a functional magnetic resonance imaging (fMRI) study, while additionally quantifying reaction times and skin conductance responses (SCRs), this study aimed at identifying the neural correlates of the behavioral and electrodermal response pattern typically found in GKT examinations. Prior to MR scanning, subjects viewed two specific items (probes) and were instructed to hide their knowledge of these. Two other specific items were designated as targets and required a different behavioral response during the experiment and eight items served as irrelevant stimuli. Reaction times and SCR amplitudes differed significantly between all three item types. The neuroimaging data revealed that right inferior frontal and mid‐cingulate regions were more active for probe and target trials compared to irrelevants. Moreover, the differential activation in the right inferior frontal region was modulated by stimulus conflicts. These results were interpreted as an increased top‐down influence on the stimulus‐response‐mapping for concealed and task‐relevant items. Additionally, the influence of working memory and retrieval processes on this activation pattern is discussed. Using parametric analyses, reaction times and SCR amplitudes were found to be linearly related to activity in the cerebellum, the right inferior frontal cortex, and the supplementary motor area. This result provides a first link between behavioral measures, sympathetic arousal, and neural activation patterns during a GKT examination. Hum Brain Mapp 2007. © 2007 Wiley‐Liss, Inc.
Keywords: fMRI, deception, guilty knowledge test, concealed information, polygraph, response conflict, skin conductance
INTRODUCTION
Most researchers examining the potential of several techniques for the detection of deception are convinced that until now no specific lie response has been found and that it may indeed never be found [Lykken, 1998, p. 63 ff.]. It seems very unlikely that any verbal, behavioral, or psychophysiological cue will serve as a specific and unique indicator of deceptive behavior. As a consequence, several questioning techniques have been developed that allow a within subject comparison of the responses to different questions or test items [National Research Council, 2003].
One such technique is the differentiation of deception paradigm [e.g. Furedy et al., 1988, 1994] in which two conditions are realized within subjects, which should only differ with respect to deception and honesty. By quantitatively comparing the behavioral or psychophysiological responses to honest and deceptive trials, one could examine psychological and physiological mechanisms underlying this specific differentiation [e.g. Gödert et al., 2001].
Although the differentiation of deception paradigm is embedded in basic research, the guilty knowledge test (GKT, also referred to as Concealed Information Test, CIT) is a questioning technique that is also employed in the applied field, i.e. in forensic settings. The GKT consists of several multiple‐choice questions, each having one relevant item (i.e. a feature of the crime under investigation, also referred to as probe item), and several irrelevant alternatives (e.g. “What kind of jewelry was stolen last night? Was it (a) a ring, (b) a bracelet, (c) a wristwatch, (d) a necklace, (e) an earring?”). Typically, the suspect is instructed to deny each item. By comparing the psychophysiological responses to the two item types, it is attempted to detect if the suspect distinguishes between these categories. Given that the response pattern is similar for several multiple‐choice questions covering other aspects of the crime under investigation (e.g. stronger responses to the probes as compared to the irrelevant items), concealed crime‐related knowledge is assumed [Lykken, 1959, 1974]. A person unaware of the crime‐related details is supposed to show a nonsystematic response pattern, as all items are homogenous for him. It has to be emphasized that the GKT does not detect deception per se [Furedy, 1986]; therefore, it is not very important for the suspect to deny every item. Hit rates well above the chance level are similarly obtained, when the suspect remains silent [Ben‐Shakhar and Elaad, 2003]. In this aspect, the GKT is rather a test for recognition memory and it is actually used for this purpose as well [e.g. Verfaellie et al., 1991].
Traditionally, measures of the autonomic nervous system have been used to examine physiological effects of deception or concealed knowledge. In the GKT, the typical response pattern of a participant recognizing the relevant items consists of a larger skin conductance response (SCR), a greater respiratory suppression, and a more pronounced heart rate deceleration following probe items in comparison to irrelevant alternatives [e.g. Gamer et al., 2006]. This response profile was thought to rely primarily on the orienting response (OR), which comprises a complex of behavioral and physiological reactions evoked by novel, unexpected, or significant stimuli [Sokolov, 1963].
Since approximately two decades, researches have tried to track the processing of deception more directly, by measuring variables of the central nervous system. Primarily event‐related brain potentials have been used for this purpose. Probe items in a GKT‐like paradigm have been repeatedly shown to elicit larger P300‐responses compared to irrelevant alternatives [see Rosenfeld, 2002, for a review]. In most of these experiments, a third item type, named target items, was added to the examination protocol [i.e. Allen et al., 1992; Farwell and Donchin, 1991; Rosenfeld et al., 1988, 2004]. Typically, the participant is instructed to press a specific button in response to the target items and another button following all other items (i.e. probes and irrelevants). This modification of the original two item GKT‐protocol aimed at maintaining the subject's attention during the testing procedure [Rosenfeld et al., 1988] or at providing a standard for the classification of the responses to probe items. In studies conducted by Farwell and colleagues, probe and target items elicited a comparable response when the participant was concealing knowledge. Conversely, the responses to probes looked more like those to irrelevant items when he was not aware of the relevant details [Farwell and Donchin, 1991; Farwell and Smith, 2001]. In most of these studies, probes were shown to be consistently accompanied by larger response times compared to irrelevant items [Allen et al., 1992; Gamer et al., 2005; Rosenlfeld et al., 2004]. This behavioral correlate of deceptive responding was interpreted as a result of a response conflict. On a higher level, this conflict was thought to be represented by the decision between lie and truth; in the mentioned experiments, however, this conflict is more related to the specific experimental manipulation. If the participant knows the relevant details that are questioned in the GKT‐examination, the infrequent presentation of the probe items will capture his attention as do target items. Thus, both these item types are associated with reaction time costs. This interpretation reveals the close connection to the OR theory described above [see Gronau et al., 2005].
Recently, several functional imaging studies have investigated the neural mechanisms related to deceptive responding. Unfortunately the results of these studies differ largely, which is probably due to differences between the experimental paradigms used. Those included variations of the differentiation of deception approach using questions on daily activities [Spence et al., 2001], autobiographical or nonautobiographical knowledge [Nuñez et al., 2005], and on experienced vs. unexperienced instructed events [Abe et al., 2006]. In these studies, commonly stronger activated regions when comparing deceptively to honestly answering comprised the ventrolateral prefrontal cortex (VLPFC) with a slight dominance of the right side, medial prefrontal regions, the anterior cingulate cortex (ACC), and premotor areas.
Other imaging studies used a combination of the differentiation of deception approach and the GKT paradigm [Kozel et al., 2004a, b; Langleben et al., 2002, 2005; Phan et al., 2005]. Participants acquired knowledge of a specific detail during the experiment that they were instructed to conceal. Additionally, they were told to answer a question on another detail truthfully. For example, participants in the study by Langleben et al. [ 2005] were presented two playing cards (5 of clubs and 7 of spades) and they were told to deny knowledge of one card while acknowledging possession of the other one. During functional magnetic resonance imaging (fMRI), these two cards, designated lie and truth, were presented along with a recurrent distractor (2 of hearts) and a variant distractor (pictures of the other playing cards of the deck). The participants were required to press a specific button following the truth card and another button on all other cards. The comparison of lie and truth answers resembles a differentiation of deception approach. However, the contrast of lie responses to responses elicited by the recurrent distractor resembles a GKT paradigm.1 Unfortunately, most of the studies mentioned only focused on the lie versus truth contrast, thus revealing little insight in the physiological basis of the GKT. Stronger activations associated with deception as opposed to truthful responding comprised the ACC and the inferior and the middle frontal gyrus [Kozel et al., 2004a, b; Langleben et al., 2002, 2005; Phan et al., 2005]. Results for the contrast of lie responses compared to the repeated distractor were only available from one study [Langleben et al., 2005] and revealed stronger activations for the lie condition in inferior frontal regions with a right‐hemispheric dominance, medial frontal regions, the ACC, and the right supramarginal gyrus.
Because of the diversity of experimental paradigms and conditions [see Ganis et al., 2003; Lee et al., 2002, 2005, for other experimental variations] and because of the fact that imaging data have been rarely compared with autonomic measures, little is known on how these two response systems (central and autonomic nervous system) interact with respect to the generation of the typical response profile found in the GKT. This study aimed at providing a first link between these two research traditions, by applying the GKT paradigm to an imaging study while additionally quantifying reaction times and SCRs. This setup should allow us to identify brain regions that are differentially activated by the different item types and, in addition, to find systematic covariations between regional stimulus‐related brain activity and behavioral and skin conductance data, respectively.
METHOD
Participants
A total of 14 right‐handed male subjects with no report of neurologic or psychiatric disorders gave written informed consent to participate in the present experiment. The participants' mean age was 28.1 years (SD = 4.3 years) with a range of 23–39 years. Most of them were students.
Instruments
Skin conductance was measured by a constant voltage system (0.5 V) using a bipolar recording with two Ag/AgCl electrodes (0.8 cm diameter) filled with 0.05 M NaCl electrolyte. The electrodes were attached to the skin surface at the medial side of the right foot over the musculus abductor hallucis adjacent to the plantar surface and mid‐way between the first phalange and a point directly beneath the ankle [Edelberg, 1967]. Skin conductance was recorded at 10 Hz by a conventional personal computer outside the scanning room.
Behavioral data were acquired by a fiberoptic response keypad system (LumiTouch; Photon Control, Vancouver, Canada) attached to a personal computer. Reaction time and accuracy for each stimulus were acquired continuously during scanning and saved for offline analysis.
Design
A standard three item GKT design originating from research on the P300‐amplitude in the detection of concealed information was used in this study. The stimulus category and the item type were varied in a fully crossed within‐subject design. Playing cards and bank notes were used as stimulus categories. The item type consisted of three conditions: (a) Participants acquired knowledge of two items (probes: jack of spades and a 20 EUR bank note) and were instructed to hide it throughout the entire experiment. (b) They were asked to press a deviant key in response to two target items (king of spades and a 100 EUR bank note). (c) Several other playing cards (9, 10, queen, and ace of spades) and bank notes (5, 10, 50, 200 EUR) were used as irrelevant items. Each stimulus was presented 20 times in an event related design, resulting in a total of 40 probes, 40 targets, and 160 irrelevants.
In sum, the three item types differed with respect to their storage in episodic memory and their task relevance. Probes and targets were presented to the participant before the scanning session, i.e. he was able to recognize them as part of the experiment. Initially, the irrelevant items were new to him, at least with respect to the current experiment. Concerning the task relevance, only target items were associated with a deviant response. The two stimulus categories should in principle lead to comparable responses, as a large number of different stimulus categories were shown to produce stable autonomic response differences between probes and irrelevant items in GKT‐examinations [Ben‐Shakhar and Elaad, 2003]. With respect to the current experiment, however, it might be expected that probe and target stimulus of the playing card set (jack and king of spades, respectively) would induce a larger response conflict because of their higher perceptual similarity as compared to the respective bank notes (20 and 100 EUR notes).
Procedure
Before the imaging session, participants were required to draw one of three envelopes. The participants were led to believe that each envelope contained different playing cards and bank notes. In fact, each contained a jack of spades and a 20 EUR note (probes). The participants were instructed to memorize the playing card and the bank note, to put these items into their pocket and to hide knowledge of these items throughout the entire experiment.
Afterwards, they were brought into the scanning room. The electrodes for the skin conductance measurement were attached and a written instruction explaining the responses required during the test was handed out to the participants. The target items (a king of spades or a 100 EUR bank note) were displayed as images on this instruction sheet and were required to be memorized to accomplish the behavioral task during the scanning. The participants were instructed to press one of two buttons on a response pad with their right hand as fast and as accurate as possible whenever a stimulus appeared on the screen. The left button press that had to be executed using the index finger would signify recognition of the respective stimulus, i.e. it had to be pressed whenever a king of spades or a 100 EUR bank note (targets) appeared on the screen. The right button press using the middle finger, however, would signify that the participant had not memorized the stimulus as being part of the experiment before the scanning session started, i.e. it had to be pressed on all other items including the probes whose recognition should be concealed. The experimenter made sure that the participant completely understood this instruction. Then a 45° angled mirror was attached to the head coil that allowed the presentation of the stimuli via rear projection on the window between the scanning and the control room. The viewing angle for the stimuli approximately subtended 5°–8° in horizontal and vertical direction depending on the corresponding stimulus.
During image acquisition, a pseudorandom sequence of photographed playing cards and bank notes with four irrelevant stimuli on the first positions was presented with an intertrial interval of 5.2, 8.3, 11.4, 14.5, or 18.6 s and an additional jittering of 0–1 s relative to scan onset. The effective interstimulus interval ranged from 5.2 to 19.2 s (M = 7.7 s, SD = 2.1 s), stimuli were presented for 1 s each. Playing card and bank note stimuli were intermixed to prevent rapid habituation of the OR. During the intertrial interval, the screen was dark.
After the imaging session, the participants were requested to recall probe and target items to ensure comparability of their data. All participants correctly recalled all items.
Image Acquisition
All images were acquired using a standard clinical whole‐body MRI scanner (Magnetom Vision, Siemens Erlangen, Germany) at a magnetic field strength of 1.5 Tesla. With the standard circularly polarized head coil and a T2*‐weighted echo‐planar imaging (EPI) pulse sequence (TR = 3,100 ms, TE = 60 ms, FOV = 192 mm, 64 × 64 matrix, th = 5 mm without gap, voxel size = 3 × 3 × 5 mm3) suitable blood oxygen level dependent (BOLD) contrast could be achieved. The protocol included 610 volumes each of 28 transversal slices, oriented parallel to the anterior‐posterior commissural plane, covering the entire brain for all subjects.
Additional isotropic high resolution (1 × 1 × 1 mm3) structural images were acquired using a T1‐weighted sagittal oriented mprage sequence with 180 slices.
Data Preprocessing and Analysis
Behavioral data
The proportion of correct responses and the mean reaction times were calculated separately for each item type within the two item categories. For further statistical analyses, an arcsine transformation was applied to the percent correct data [Cohen, 1988, p. 179 ff.].
Skin conductance responses
In addition to the grand average of skin conductance changes in relation to the item onset, we measured the artifact free amplitude of the SCRs that began between 1 and 3 s after stimulus onset as change in μS. In case of overlapping responses, we used the inflection point between the two responses as baseline or response maximum, respectively, depending on the latency criterion. Overlapping SCRs occurred in only 2.4% (SD = 1.6%) of all trials. Subsequently the amplitudes were converted to log μS according to the formula provided by Venables and Christie [ 1980]. To test for habituation effects of the SCRs across the test, we partitioned the 240 trials into 4 temporal blocks that contained approximately the same number of probes, targets, and irrelevant items, respectively. Additionally, we separately calculated the average of the SCR amplitudes as a function of item category and item type for further analyses. As errors in behavioral responses were shown to substantially enhance autonomic responding [Hajcak et al., 2003], we used only the error free trials for all SCR analyses. Because only few errors were committed, between 231 and 240 trials could be included in the analyses (M = 237; SD = 3).
Imaging data
Data were preprocessed and analyzed using statistical parametric mapping (SPM2, Wellcome Department of Imaging Neuroscience, London, UK). Each participant's data were slice time‐corrected, motion‐corrected, and then coregistered with his corresponding high resolution T1 image. The T1 images were spatially normalized to the standard anatomical space (T1 MNI template) and transformation parameters were subsequently applied to all functional images within each participant. The spatially normalized functional images were smoothed with an 8 × 8 × 12 mm3 full width at half maximum Gaussian kernel and high pass filtered at 128 s. The correction for autocorrelation (AR(1) method) between scans was applied.
To find regions differentially activated by the different item types, we modeled the three item classes (probes, targets, and irrelevant items) as separate regressors that were convolved with the canonical hemodynamic response function using a general linear model (GLM) on an individual level. Erroneous trials were modeled separately as covariate of no interest. Simple contrast maps (each item type vs. baseline condition) were then entered into a random‐effects analysis (one way analysis of variance (ANOVA) within subjects) to identify regions that showed significant activation differences between item types (F‐contrast). Post hoc analyses were accomplished by separate comparisons of the average percentage signal change as a function of item category and item type in all regions of interest (ROI), functionally defined by the F‐contrast of the aforementioned random effects analysis. These values were obtained using the SPM‐toolbox MarsBaR [Brett et al., 2002; http://marsbar.sourceforge.net].
Separate analyses were conducted to identify regional brain activity systematically covariing with item‐wise reaction times and SCRs. Because trialwise reaction times and SCRs were positively correlated (average of within subject correlations r = 0.30) separate models were constructed for both parametric regressors. Each model contained one regressor specifying the stimulus presentation (irrespective of the corresponding item category and item type) for all trials that elicited SCRs and were associated with a correct behavioral response. Overall, between 82 and 232 trials met this precondition (M = 167; SD = 50).2 Subsequently, a parametric regressor, corresponding to the within‐subject z‐standardized values of the reaction times or the log‐transformed SCRs of these trials, was added to the design matrix. Trials that did not elicit an SCR and erroneous trials were modeled separately as covariates of no interest. SPM{t} maps reflecting the covariation between parametric regressors and item‐wise hemodynamic responses were calculated for both models and subsequently transformed to Fisher Z‐values to satisfy the normality assumption for the random effects analyses [see Anders et al., 2004]. The following formulas were used:
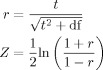 |
with r denominating the correlation between parametric regressors and fMRI responses and df depicting the degrees of freedom of the corresponding t‐statistic. These Fisher‐transformed correlation maps were then entered into a random‐effects group analysis (one sample t‐test) separately for the reaction time data and the SCRs.
For all random‐effects SPM‐analyses, P‐values were corrected for multiple comparisons using a false discovery rate of 0.01 [Genovese et al., 2002]. Additionally, activations were required to reach a spatial extend threshold of at least 20 contiguous voxels.
RESULTS
Behavioral Data
A 2 × 3 ANOVA on the accuracy of the participants' responses using the item category (playing cards vs. bank notes) and the item type (probes, targets, and irrelevant items) as within‐subject factors revealed a significant interaction of item category and item type, F(2, 26) = 3.65, P < 0.05, Huynh‐Feldt ϵ = 0.94, f = 0.27, as well as a significant main effect of item type, F(2, 26) = 7.67, P < 0.01, ϵ = 0.88, f = 0.41. As can be seen from Table I, responses to irrelevant items were nearly perfect for both item categories. Probes and targets led to the same proportion of errors for the playing cards, but differed with respect to the bank notes where only targets were accompanied by a substantial proportion of errors.
Table I.
Proportion of correct responses as a function of item category and item type
| Item type | Playing cards | Bank notes | Total | |||
|---|---|---|---|---|---|---|
| M (%) | SD (%) | M (%) | SD (%) | M (%) | SD (%) | |
| Irrelevant | 99.3 | 0.8 | 99.6 | 0.6 | 99.4 | 0.5 |
| Probe | 97.1 | 6.7 | 99.6 | 1.3 | 98.4 | 3.3 |
| Target | 97.1 | 3.8 | 93.6 | 6.9 | 95.4 | 4.4 |
Using a similar 2 × 3 ANOVA on the mean reaction times of valid responses, a significant interaction of item category and item type was revealed, F(2, 26) = 12.12, P < 0.001, ϵ = 0.92, f = 0.27. Furthermore, the main effects of item category, F(1, 13) = 9.94, P < 0.01, f = 0.20, and item type, F(2, 26) = 25.57, P < 0.001, ϵ = 0.80, f = 0.31, were found to be statistically significant. The obtained response pattern (Fig. 1A) closely corresponds to the accuracy data described above. The reaction times to irrelevant and target items were largely comparable for both item categories. The probe items, however, were associated with substantial reaction time costs only within the stimulus category of the playing cards.
Figure 1.
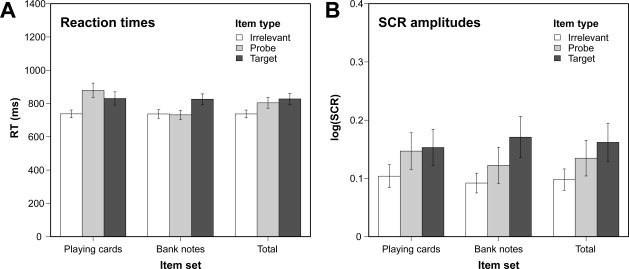
Reaction times (panel A) and log‐transformed skin conductance response (SCR) amplitudes (panel B) as a function of item category and item type. Additionally, mean values across item categories are displayed. Error bars indicate standard errors of the mean.
Skin Conductance Responses
To check for a differential habituation of the SCR amplitudes associated with the three item types, we computed a 4 × 3 ANOVA on the log‐transformed SCR amplitudes using the temporal block and the item type as within‐subject factors. Only the main effects of time, F(3, 39) = 10.72, P < 0.001, ϵ = 0.36, f = 0.57, and item type, F(2, 26) = 6.85, P < 0.01, ϵ = 0.99, f = 0.16, reached statistical significance. Thus, although habituation occurred, the response differences between the three item types remained stable across the whole test (Fig. 2A). This result enabled us to collapse the data from the whole test for further analyses.
Figure 2.
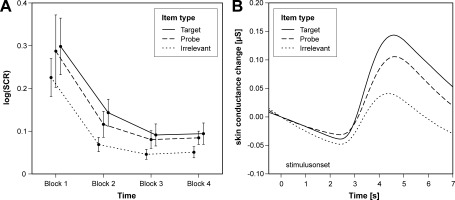
Skin conductance changes as a function of item type. Panel (A) shows the temporal course of the log‐transformed skin conductance response (SCR) amplitudes across the experiment. Panel (B) displays the grand average of the SCRs in microSiemens as a function of item type. The skin conductance changes were computed as differences to the corresponding value at stimulus onset.
Figure 2B displays the grand average of the SCRs in relation to the item onset. Obviously, all three item types elicited SCRs with comparable latency but different amplitudes. Using a 2 × 3 ANOVA on the log‐transformed SCR amplitudes with the item category and the item type serving as within‐subject factors, we obtained a significant main effect of the item type, F(2, 26) = 8.59, P < 0.01, ϵ = 0.94, f = 0.25, and a marginally significant interaction of item category and item type, F(2, 26) = 3.17, P < 0.1, ϵ = 0.84, f = 0.08. As can be seen from Figure 1B, the largest SCRs were elicited by targets, but also probes were accompanied by larger response amplitudes than irrelevant items. This pattern did not substantially differ between the item categories, although the response difference between probes and irrelevants seemed to be slightly larger for the playing cards.
Imaging Results
Differences between item categories
Regions differentially activated by the three item types included the right middle cingulate gyrus, the left inferior parietal lobule, and the insula and inferior frontal regions of the right hemisphere (see Table II, Fig. 3A). To analyze the contribution of the different item categories to this main effect, we calculated separate 2 × 3 ANOVAs on the percentage signal increase for each functionally defined ROI. The item category and the item type served as within subject factors.3 In inferior parietal regions of the left hemisphere, target items elicited a larger percentage signal increase than probe and irrelevant items irrespective of the item category (Fig. 4A). This pattern was supported by a missing interaction of item category and item type as well as by a missing main effect of item category.
Table II.
Regional brain activity differing between item types
| Regions contained within cluster | Peak voxel (MNI coordinates) | Cluster size (voxels) | F(2, 26) | Corrected P | ||
|---|---|---|---|---|---|---|
| x | y | z | ||||
| Left inferior parietal lobule | −48 | −42 | 50 | 109 | 21.84 | 0.006 |
| Left precentral gyrus | −36 | −21 | 60 | 21.23 | 0.006 | |
| Left postcentral gyrus | −48 | −33 | 60 | 20.34 | 0.006 | |
| Right middle cingulate gyrus | 3 | −27 | 35 | 30 | 33.99 | 0.002 |
| Right inferior frontal gyrus, orbital part | 45 | 24 | −10 | 74 | 23.64 | 0.006 |
| Right insula | 36 | 27 | −5 | 19.92 | 0.006 | |
| Right inferior frontal gyrus, opercular part | 45 | 18 | 0 | 19.81 | 0.006 | |
Regions included in a single cluster are listed together. Regions containing the peak voxel are printed in italic. The spatial extend of each cluster was >20 voxel and an FDR of 0.01 was used to correct for multiple comparisons.
Figure 3.
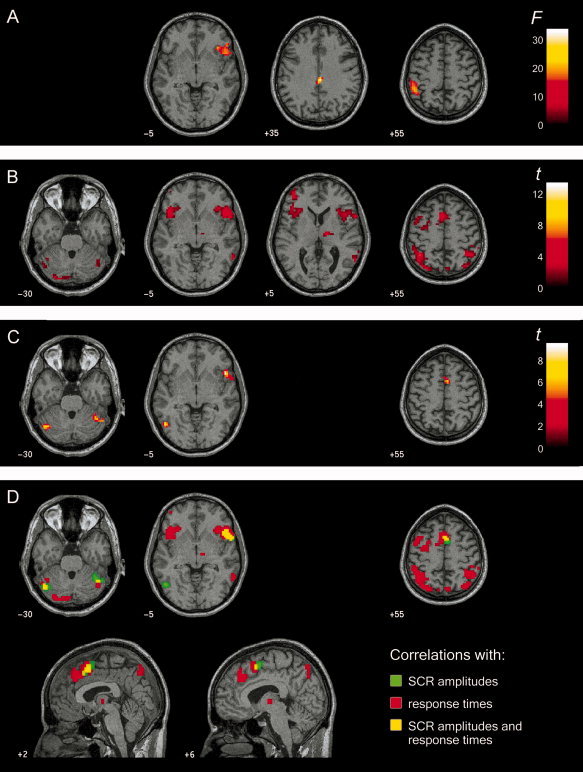
Brain areas showing significant effects of group analyses. Regions are displayed on single subject T1‐weighted structural image, which was spatially normalized to the standard anatomical space using the MNI template brain. Slice location is given by its respective MNI coordinate and images are shown in neurological convention (left side of image is left side of brain). Color scales represents F or t score values, respectively, for corresponding functional overlays. (A) Main effect of item type in a one way ANOVA within subjects. (B) Significant correlations between regional brain activity and z‐standardized reaction times irrespective of the corresponding item type. (C) Significant correlations between regional brain activity and z‐standardized skin conductance response (SCR) amplitudes irrespective of the corresponding item type. (D) Regional brain activity correlating with z‐standardized SCR amplitudes (green) and reaction times (red). Additionally, the overlap of both correlation maps is depicted in yellow.
Figure 4.
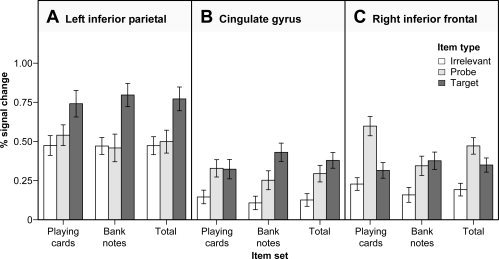
Mean percentage signal change in the left inferior parietal lobule (panel A), the cingulate gyrus (panel B) and the right inferior frontal gyrus (panel C) as a function of item category and item type. The regions of interest were functionally defined by the main effect of item type. Mean values across item categories are displayed on the right side of each panel. Error bars indicate standard errors of the mean.
However, the results were slightly different for the other two ROIs. In middle cingulate, F(2, 26) = 4.75, P < 0.05, ϵ = 0.81, f = 0.18, as well as in inferior frontal regions, F(2, 26) = 9.71, P < 0.001, ϵ = 1.00, f = 0.28, a significant interaction of item category and item type was obtained (Fig. 4B,C). In the cingulate gyrus, this effect was due to a larger percentage signal increase for target items as compared to probes in the stimulus set of the bank notes. For the playing cards, in contrast, both these item types were accompanied by similar responses. In the right inferior frontal region, this interactive effect of item category and item type was clearly due to a remarkable percentage signal increase elicited by the probe items in the playing card stimulus set. For bank notes, on the other hand, probe and target items were accompanied by comparable responses. Within the inferior frontal region, the main effect of item category also reached statistical significance, mainly because of the response differences of the respective probe items, F(1, 13) = 7.67, P < 0.05, f = 0.19.
Correlation analysis of imaging data and reaction times
Among the regions whose activity correlated with the z‐standardized reaction times were mainly middle frontal, inferior frontal, and inferior parietal regions in both hemispheres. Additionally, the activity of the right angular gyrus, the right middle and inferior temporal gyrus, the precuneus, the thalamus, and cerebellar regions was linearly related to the reaction times irrespective of the item type (Table III, Fig. 3B). All trialwise correlations were positive and comparably small but they occurred robustly across participants.
Table III.
Regional brain activity correlating with reaction times
| Regions contained within cluster | Peak voxel (MNI coordinates) | Cluster size (voxels) | t(13) | Corrected P | r | ||
|---|---|---|---|---|---|---|---|
| x | y | z | |||||
| Left inferior parietal lobule | −39 | −51 | 55 | 162 | 9.56 | 0.002 | 0.084 |
| Left superior parietal lobule | −30 | −72 | 55 | 7.11 | 0.002 | 0.084 | |
| Left middle frontal gyrus | −51 | 18 | 40 | 333 | 9.43 | 0.002 | 0.077 |
| Left inferior frontal gyrus, orbital part | −42 | 18 | −5 | 8.79 | 0.002 | 0.080 | |
| Left middle frontal gyrus | −42 | 51 | 10 | 55 | 9.07 | 0.002 | 0.064 |
| Left superior frontal gyrus | −30 | 45 | 40 | 23 | 8.40 | 0.002 | 0.062 |
| Left middle frontal gyrus | −33 | 36 | 45 | 5.43 | 0.006 | 0.035 | |
| Left superior frontal gyrus | −24 | −9 | 65 | 43 | 7.40 | 0.002 | 0.040 |
| Left precentral gyrus | −36 | −9 | 65 | 6.69 | 0.003 | 0.065 | |
| Left supplementary motor area | −3 | 12 | 55 | 157 | 8.82 | 0.002 | 0.086 |
| Left superior frontal gyrus, medial | −3 | 27 | 40 | 8.08 | 0.002 | 0.066 | |
| Right superior frontal gyrus, medial | 6 | 30 | 40 | 7.97 | 0.002 | 0.073 | |
| Right inferior parietal lobule | 51 | −48 | 45 | 165 | 13.56 | 0.000 | 0.061 |
| Right superior parietal lobule | 42 | −48 | 60 | 9.73 | 0.002 | 0.070 | |
| Right inferior frontal gyrus, orbital part | 51 | 24 | −5 | 275 | 8.64 | 0.002 | 0.093 |
| Right insula | 45 | 18 | 0 | 8.37 | 0.002 | 0.082 | |
| Right inferior frontal gyrus, triangular part | 48 | 33 | 25 | 67 | 7.61 | 0.002 | 0.055 |
| Right middle frontal gyrus | 39 | 39 | 35 | 6.74 | 0.003 | 0.055 | |
| Right angular gyrus | 36 | −69 | 55 | 47 | 7.94 | 0.002 | 0.073 |
| Right inferior temporal gyrus | 60 | −54 | −5 | 38 | 7.91 | 0.002 | 0.058 |
| Right middle temporal gyrus | 66 | −42 | 5 | 4.93 | 0.009 | 0.043 | |
| Left precuneus | −9 | −72 | 45 | 55 | 7.01 | 0.002 | 0.094 |
| Right precuneus | 6 | −75 | 55 | 5.55 | 0.005 | 0.064 | |
| Right thalamus | 15 | −12 | 5 | 23 | 7.50 | 0.002 | 0.041 |
| Left cerebellum, crus 1 | −39 | −54 | −30 | 75 | 5.88 | 0.004 | 0.069 |
| Left cerebellum, crus 2 | −36 | −60 | −40 | 5.77 | 0.005 | 0.050 | |
| Right cerebellum, crus 1 | 39 | −54 | −40 | 37 | 6.67 | 0.003 | 0.053 |
Regions included in a single cluster are listed together. Regions containing the peak voxel are printed in italic. The spatial extend of each cluster was >20 voxel and an FDR of 0.01 was used to correct for multiple comparisons.
Correlation analysis of imaging data and SCRs
Significant covariations of the BOLD signal and trialwise SCR amplitudes were obtained for inferior occipital regions and the fusiform gyrus, for the supplementary motor area (SMA) and the right insula. Additionally, regional activity of both cerebellar hemispheres was linearly related to the amplitude of the SCRs (Table IV, Fig. 3C). Comparable to the correlations with the reaction time data, all covariations between regional brain activity and the amplitudes of the SCRs were small and positive, and no negative correlations were observed.
Table IV.
Regional brain activity correlating with the amplitude of the skin conductance responses
| Regions contained within cluster | Peak voxel (MNI coordinates) | Cluster size (voxels) | t(13) | Corrected P | r | ||
|---|---|---|---|---|---|---|---|
| x | y | z | |||||
| Left inferior occipital gyrus | −51 | −66 | −10 | 40 | 9.62 | 0.005 | 0.063 |
| Left fusiform gyrus | −39 | −75 | −15 | 6.76 | 0.007 | 0.067 | |
| Left supplementary motor area | −3 | 15 | 45 | 33 | 7.93 | 0.006 | 0.058 |
| Right supplementary motor area | 6 | 6 | 55 | 7.84 | 0.006 | 0.058 | |
| Right insula | 48 | 18 | −5 | 35 | 9.25 | 0.005 | 0.083 |
| Right temporal pole | 57 | 9 | −5 | 6.44 | 0.007 | 0.062 | |
| Left cerebellum, crus 1 | −45 | −66 | −30 | 68 | 8.63 | 0.005 | 0.076 |
| Right cerebellum, crus 1 | 42 | −54 | −30 | 29 | 8.12 | 0.006 | 0.069 |
Regions included in a single cluster are listed together. Regions containing the peak voxel are printed in italic. The spatial extend of each cluster was >20 voxel and an FDR of 0.01 was used to correct for multiple comparisons.
Besides cerebellar activity, there were only two brain regions, whose activity was linearly related to the reaction time data and the amplitude of the SCRs. One of these region contained parts of the right inferior frontal gyrus and the right insula, respectively, and the other region incorporated the SMA. Figure 3D shows the overlap of the correlation maps of the reaction time and the skin conductance data. Within the SMA, more caudally located regions predicted the SCR amplitudes, whereas rostral regions that extended into the superior frontal gyrus were associated with trialwise response times.
DISCUSSION
The present study aimed at investigating the neural basis of differential responding in a three‐item GKT and additionally relating these results to behavioral and skin conductance data. In general, the behavioral data closely corresponded to studies using the P300 as dependent variable or to those solely relying on behavioral data in a comparable paradigm [Allen et al., 1992; Farwell and Donchin, 1991; Gamer et al., 2005; Rosenfeld et al., 2004, 2006; Seymour et al., 2000]. Overall, targets were associated with a larger error rate and higher reaction times as compared to irrelevant items. Differences between probes and irrelevants, on the other hand, were primarily determined by the item category. Although substantial reaction time costs were observed for probes within the set of playing cards, no such effect could be found for the bank notes. These differences might be interpreted as resulting from a response conflict between probes and targets with both these trials requiring a different behavioral response. The larger perceptual similarity of these items in the stimulus set of the playing cards obviously amplified this response conflict and led to pronounced reaction time costs for trials requesting a concealment of previously acquired information. With respect to the stable differences between targets and irrelevant items, comparable behavioral data were typically obtained in experiments, where rare stimuli required a different response than frequent stimuli (response selection).
The design of the current study was also based on a response selection paradigm. Probes and targets, which appeared with a lower frequency than irrelevant items, were known to the participants, but only targets required a deviant response compared to all other stimuli. It seems likely that probes triggered involuntary attentional processes by popping out of the stimulus stream just as targets did, but they had to be treated like irrelevant items. Thus, they required the inhibition of a response only correctly associated to targets. The cortical resources required to accomplish such a discrimination of probes and targets and to allow for an inhibition of an inadequate response should in principle vary as a function of stimulus conflict. Thus, with respect to the current experiment, correct responses to probes in the item category of the playing cards should demand larger resources than comparable responses to bank notes. Targets, on the other hand, appeared infrequently, too, and required a comparable inhibition of the frequent response. Consequently, the reaction times clearly followed this pattern and, moreover, the activity of a region in the right inferior frontal cortex that is known to be relevant for the inhibition of inadequate responses was more active for these rare events (probes and targets) when contrasted to irrelevant items. In line with the aforementioned reasoning, especially probes in the set of the playing cards elicited a substantial percentage signal change in the right inferior frontal cortex, thus corroborating its potential involvement in response monitoring and inhibition in the present GKT examination. A large body of studies utilizing different paradigms that required infrequent responses or an infrequent response alternation found a comparable activation of the right inferior frontal cortex for rare and deviant responses [e.g. Braver et al., 2001; Konishi et al., 1998, 1999; Liddle et al., 2001].
Inferior frontal regions, especially those of the right hemisphere, possibly play an important role for the top‐down influence on the stimulus‐response‐mapping [see Aron et al., 2004, for a review]. In line with this reasoning, several studies related to deception also reported an increased activation in the VLPFC or the inferior frontal gyrus on trials that were answered deceptively in contrast to honest responding [Abe et al., 2006; Kozel et al., 2004a, b; Langleben et al., 2005; Phan et al., 2005; Spence, 2001]. Most importantly, Langleben et al. [ 2005] found a very similar pattern of activation in the lateral prefrontal cortex of both hemispheres for the contrast of deceptively answered trials compared to a repeated distractor. Although this differential activation in lateral prefrontal regions could be interpreted as a result of a response conflict, it should be noted that similar regions have been found to be activated during episodic memory retrieval and working memory tasks. Especially the maintenance of information in working memory and the selection of responses including the potential inhibition of inappropriate responses have been supposed to be related to the VLPFC activation [D'Esposito et al., 2000]. For episodic memory retrieval, right‐lateralized prefrontal activation was found in a large body of studies, leading to the hemispheric encoding/retrieval asymmetry hypothesis [Habib et al., 2003; Tulving et al., 1994]. The involvement of memory‐related processes in the detection of deception or concealed information has been largely disregarded in previous imaging studies, although its close investigation may provide a more direct support for the original hypothesis of Lykken [ 1959] that the GKT is a test of recognition instead of a test of deception. In the current study, previously learned material (probes and targets) were accompanied by larger increases of activity in the right inferior frontal cortex as compared to novel and irrelevant information. Unfortunately, the processes related to episodic memory retrieval and interferences during response selection could not be differentiated in the current study, because the task required all subjects to select or inhibit responses to previously acquired information. Both processes might be disentangled in future research.
Unlike other neuroimaging studies on deception [Abe et al., 2006; Kozel et al., 2004a, b; Langleben et al., 2002, 2005; Nuñez et al., 2005], we did not find a differential activation of the ACC for the different item types. Similarly, others failed to corroborate this involvement of the ACC in deception [Phan et al., 2005; Spence et al., 2001]. This might be due to several reasons: First, the ACC was shown to be involved in processing conflicting information, especially when those occurred with a low frequency [Braver et al., 2001; de Zubicaray et al., 2000]. The number of trials that required a response monitoring in the current experiment (probes and targets) summed up to one third of all trials. Possibly, the differential response of the ACC was thus weakened because of this higher proportion of conflicting trials. Second, the ACC seems to be related to motivational conditions of decision making and monitoring [Bush et al., 2002; Rogers et al., 2004]. In contrast to other studies [e.g. Kozel et al., 2004b; Langleben et al., 2002, 2005], we did not use (monetary) incentives to heighten the participant's motivation of successfully concealing the relevant information. Thus, strictly speaking, there was no need for our subjects to keep track of their responses during the experiment. This possibly led to a lower activation of areas known to be involved in response monitoring like the ACC. Third, increased ACC activity seems to be related to task difficulty [see Paus et al., 1998 for a review] and error monitoring [Mathalon et al., 2003]. Our task was comparably easy as verified by the low rate of errors committed by the participants, thus potentially accounting for the absent differences in the ACC activation.
By contrast, a differential response of the middle cingulate gyrus was observed in this study. Kozel et al. [ 2004a] reported a similar difference in activation for the contrast of deceptively answered trials compared to honest responding. This region seems to be involved in the detection of infrequent events [Braver et al., 2001], which fits to the observed difference in activity to probes and targets compared to irrelevant items. For this region, the difference between the signal change to probes and targets was larger in the stimulus set of the bank notes as compared to the playing cards. Although this difference was comparatively small, it might be related to previous experiences with the stimulus material. Our sample mainly consisted of students that presumably have less experience with 100 EUR bank notes that served as target than with 20 EUR bank notes that were used as probe items. Thus, potentially, the bank note of higher value subjectively appeared less frequently than the 20 EUR bank note and led to the small difference in the activation of the mid‐cingulate region.
Using a typical P300‐oddball‐paradigm where participants had to silently count the number of infrequent targets also led to an activation of the middle cingulate gyrus following targets [McCarthy et al., 1997]. This possibly provides a first link of the data presented here to other experiments using event‐related brain potentials as dependent variable in a comparable paradigm. Typically, a larger P300 is observed in such studies in trials that contain previously acquired information or task relevant stimuli [Allen et al., 1992; Farwell and Donchin, 1991; Rosenfeld et al., 1988, 2004, 2006; van Hooff et al., 1996].
The fourth cluster of differential activation elicited by the three item types in the current study was located in the left inferior parietal lobule extending into areas of the precentral and postcentral gyrus. Although comparable activation differences between deceptive and honest trials have been frequently reported for the primary motor cortex and postcentral regions in a controlled setup [e.g. Langleben et al., 2005; Spence et al., 2001], it could not be ruled out that the differential activation observed in the current study was simply due to the different fingers that were used for the responses to targets as compared to probe and irrelevant items. Only targets were accompanied by a heightened response in this cluster and this pattern did not differ between item categories. Thus, the inferior parietal activation was obviously unrelated to stimulus or response conflicts and was most likely due to the different response demands.
Taken together, probe and target items elicited a surprisingly similar pattern of activation in the brain. Some differences were observed as a function of stimulus conflicts and, potentially, previous experiences with the stimulus material, but in sum, our findings suggest that the response pattern of the three item GKT largely relies on the differentiation of rare and meaningful information (probes and targets) from irrelevant items. This result fits very well to studies using event‐related brain potentials in the GKT [Rosenfeld et al., 1988, 2004, 2006; van Hooff et al., 1996] and furthermore substantiates the inference logic that has frequently been applied to identify concealed information on a single‐subject basis [Allen et al., 1992; Farwell and Donchin, 1991; Farwell and Smith, 2001]. This pattern might however change, when probes are associated with strong emotions and when the risk of failing the test becomes a high motivational incentive. This situation is likely to occur in forensic applications where the GKT is used to reveal crime related knowledge from alleged criminals [Nakayama, 2002].
Regarding the skin conductance data, probes were associated with larger response amplitudes compared to irrelevant items [Ben‐Shakhar and Elaad, 2003]. Additionally, however, the responses to the task relevant items (targets) were larger than those to both other item types at least when there were only small stimulus conflicts between probes and targets (as in the set of bank notes). Thus, items requiring a deviant response did attract the participant's attention and produced a pattern closely corresponding to an OR [Ben‐Shakhar et al., 1999; Gamer et al., 2005]. According to the notion of Lykken [ 1974], the probe items embedded in the GKT questions presentation, have a special sort of significance or “signal value” for guilty subjects; thus, they evoke a stronger OR that is more resistant to habituation compared to irrelevant items [see also Ben‐Shakhar and Furedy, 1990, p. 111 ff.]. Apparently, target items had a comparable or even higher “signal value” than probe items in the three item GKT employed in the present study. Future research might help to answer the question whether this was primarily due to their task relevance or their maintenance in working memory.
Irrespective of the presented item type, phasic skin conductance changes were found to be related to the activity of several cortical regions. In line with other studies using different research paradigms [Critchley et al., 2000; Nagai et al., 2004; Patterson et al., 2002; Williams et al., 2000], those included supplementary motor regions, the cerebellum, inferior frontal regions, and the insula but surprisingly also the inferior occipital and fusiform gyri in the left hemisphere. Comparable correlations of extrastriate visual areas and phasic skin conductance activity were found in several studies and may represent a modulatory effect of sympathetic arousal on sensory processing [Critchley et al., 2000; Patterson et al., 2002; Williams et al., 2000].
Mainly on the basis of animal studies, Dawson et al. [ 2000] described several pathways that were thought to be related to the elicitation and the modulation of phasic skin conductance activity. One of these pathways, mainly involved in situations requiring fine motor control, incorporated contralateral premotor and motor‐regions. In the current study where participants were required to respond behaviorally to visually presented stimuli, phasic skin conductance changes were linearly related to SMA activity, thus potentially indicating the relevance of this pathway for our experimental paradigm. The observed cerebellar activity might also be related to this interpretation. A second pathway, originating from prefrontal regions, was thought to be involved in phasic skin conductance modulation during orientation and selective attention. In the current study, the activity of inferior frontal regions and the right anterior insula was linearly related to phasic skin conductance changes. Similar results were obtained by Critchley et al. [ 2000], Patterson et al. [ 2002], and Nagai et al. [ 2004]. In all these studies, this significant covariation was observed only for the right hemisphere or was at least strongly right lateralized. The same was true for a study by Kozel et al. [ 2004b], who correlated the time course of the electrodermal data averaged within successive 3 s windows, thus representing a mixture between tonic and phasic skin conductance data, with the BOLD signal changes in a combination of the differentiation of deception approach and the GKT paradigm. Significant correlations were almost exclusively observed for the right hemisphere, in particular for inferior frontal and insular regions.
Irrespective of the item type, significant covariations of reaction times and cortical activity were found bilaterally for a widespread fronto‐parietal network including the SMA but also subcortical and cerebellar regions. Parts of this network have been found to be related to response planning, selection, and inhibition [Aron et al., 2004; Braver et al., 2001; Wager et al., 2005]. For the whole network, only positive correlations were observed; thus, larger cortical activity within these regions led to pronounced reaction time costs. In sum, far more significant correlations of regional brain activity and reaction times were observed than comparable covariations with SCR amplitudes. Two potential reasons that may be intertwined can be considered to explain this discrepancy. First, although behavioral and skin conductance data were correlated across trials, the absolute size of this correlation was only moderate. Therefore, both measures may reflect processes that are partly independent and thus share only some parts of a larger network in the brain that is involved in processing the different stimuli of the GKT. Second, this discrepancy might, at least in part, be due to habituation of the SCR amplitudes across the test that led to a reduced variability of this measure as compared to the reaction times.
When comparing the specific results of the parametric analyses described above, it turned out that response times and SCR amplitudes were positively correlated with regional brain activity in the cerebellum, the SMA, and the right inferior frontal cortex incorporating parts of the anterior insula. In contrast to Critchley et al. [ 2005] who found rostral regions of the ACC predicting sympathetic arousal as indexed by pupil dilatation, we found a more caudally located region of the SMA predicting phasic skin conductance changes. Furthermore, the activity of an adjacent rostral region incorporating parts of the SMA and the superior frontal gyrus was linearly related to trialwise response times. This discrepance to the study by Critchley et al. [ 2005] might be related to the different measures that were used to index autonomic arousal or to differences in the respective task which was apparently easier in the current experiment. Taken together, the GKT obviously accentuates the involvement of premotor regions like the SMA in the modulations of phasic skin conductance activity instead of revealing the contribution of rostral ACC regions that were previously shown to influence sympathetic arousal [e.g. Critchley et al., 2001, 2003, 2005].
Interestingly, most studies using a differentiation of deception approach did find differential activations in either the SMA or inferior frontal regions or even in both areas for deceptive compared to truthful responses [Abe et al., 2006; Nuñez et al., 2005; Spence et al., 2001]. The same is true for studies combining a differentiation of deception and a GKT approach [Kozel et al., 2004a; Langleben et al., 2002, 2005; Phan et al., 2005] and for studies where participants were instructed to feign memory impairment [Lee et al., 2002, 2005]. When analyzing the effects of the several item types on cortical activity, a differential activation for the right inferior frontal cortex was observed in the current study, too. Thus, it can be concluded that the activity of medial and ventrolateral frontal regions seems to be coupled to behavioral and autonomic measures that were traditionally used in GKT examinations [see Ben‐Shakhar and Elaad, 2003, for a review, or Seymour et al., 2000]. On the one hand, this link might provide insights into information processing during a GKT examination; on the other hand, it may have consequences for the application of imaging techniques aiming to obtain individual diagnoses concerning potentially deceptive responses. Currently, such methods are emerging [Davatzikos et al., 2005; Kozel et al., 2005] and future research might help answering the question, whether their validity will prove to be superior to traditional GKT techniques based on autonomic measures [see Wolpe et al., 2005, for a discussion of this issue].
Acknowledgements
We are indebted to Susanne Schertz for her help and support during data collection and analysis and to Simone Vossel for her valuable comments during preparation of this manuscript. Additionally, we thank two anonymous reviewers for commenting on an earlier version of this manuscript.
Footnotes
It has to be mentioned that the use of only one specific irrelevant item is unusual for the GKT. In principle, the quantity of irrelevant items is inversely related to the possibility that an uninformed participant would show more pronounced physiological responses to the probe item by chance [MacLaren, 2001]. Therefore, typically three to five irrelevant items are used for each category defined by the corresponding probe item.
Approximately the same proportion of trials with probe (M = 73%; SD = 26%), target (M = 79%; SD = 18%), and irrelevant items (M = 66%; SD = 21%) elicited an SCR and was accompanied by a valid behavioral response.
As a matter of course, the main effect of item type was significant for each ROI because they were functionally defined by this effect. Therefore, we focused on the interaction of item category and item type as well as on the main effect of item category in the ROI‐specific analyses.
REFERENCES
- Abe N,Suzuki M,Tsukiura T,Mori E,Yamaguchi K,Itoh M,Fujii T ( 2006): Dissociable roles of prefrontal and anterior cingulate cortices in deception. Cereb Cortex 16: 192–199. [DOI] [PubMed] [Google Scholar]
- Allen JJ,Iacono WG,Danielson KD ( 1992): The identification of concealed memories using the event‐related potential and implicit behavioral measures: A methodology for prediction in the face of individual differences. Psychophysiology 29: 504–522. [DOI] [PubMed] [Google Scholar]
- Anders S,Lotze M,Erb M,Grodd W,Birbaumer N ( 2004): Brain activity underlying emotional valence and arousal: A response‐related fMRI study. Hum Brain Mapp 23: 200–209. [DOI] [PMC free article] [PubMed] [Google Scholar]
- Aron AR,Robbins TW,Poldrack RA ( 2004): Inhibition and the right inferior frontal cortex. Trends Cogn Sci 8: 170–177. [DOI] [PubMed] [Google Scholar]
- Ben‐Shakhar G,Elaad E ( 2003): The validity of psychophysiological detection of information with the guilty knowledge test: A meta‐analytic review. J Appl Psychol 88: 131–151. [DOI] [PubMed] [Google Scholar]
- Ben‐Shakhar G,Furedy JJ ( 1990): Theories and Applications in the Detection of Deception: A Psychophysiological and International Perspective. New York: Springer. [Google Scholar]
- Ben‐Shakhar G,Gronau N,Elaad E ( 1999): Leakage of relevant information to innocent examinees in the GKT: An attempt to reduce false positive outcomes by introducing target stimuli. J Appl Psychol 84: 651–660. [Google Scholar]
- Braver TS,Barch DM,Gray JR,Molfese DL,Snyder A ( 2001): Anterior cingulate cortex and response conflict: Effects of frequency, inhibition and errors. Cereb Cortex 11: 825–836. [DOI] [PubMed] [Google Scholar]
- Brett M,Anton JL,Valabregue R,Poline JB ( 2002): Region of interest analysis using an SPM toolbox. Presented at the 8th International Conference on Functional Mapping of the Human Brain, June 2–6, 2002, Sendai, Japan. Available on CD‐ROM in NeuroImage 16. Abstract.
- Bush G,Vogt BA,Holmes J,Dale AM,Greve D,Jenike MA,Rosen BR ( 2002): Dorsal anterior cingulate cortex: A role in reward‐based decision making. Proc Natl Acad Sci USA 99: 523–528. [DOI] [PMC free article] [PubMed] [Google Scholar]
- Cohen JD ( 1988): Statistical Power Analysis for the Behavioral Sciences,2nd ed. Hillsdale: Lawrence Erlbaum. [Google Scholar]
- Critchley HD,Elliott R,Mathias CJ,Dolan RJ ( 2000): Neural activity relating to generation and representation of galvanic skin conductance responses: A functional magnetic resonance imaging study. J Neurosci 20: 3033–3040. [DOI] [PMC free article] [PubMed] [Google Scholar]
- Critchley HD,Mathias CJ,Dolan RJ ( 2001): Neural activity in the human brain relating to uncertainty and arousal during anticipation. Neuron 29: 537–545. [DOI] [PubMed] [Google Scholar]
- Critchley HD,Mathias CJ,Josephs O,O'Doherty J,Zanini S,Dewar BK,Cipolotti L,Shallice T,Dolan RJ ( 2003): Human cingulate cortex and autonomic control: Converging neuroimaging and clinical evidence. Brain 126: 2139–2152. [DOI] [PubMed] [Google Scholar]
- Critchley HD,Tang J,Glaser D,Butterworth B,Dolan RJ ( 2005): Anterior cingulate activity during error and autonomic response. NeuroImage 27: 885–895. [DOI] [PubMed] [Google Scholar]
- Davatzikos C,Ruparel K,Fan Y,Shen DG,Acharyya M,Loughead JW,Gur RC,Langleben DD ( 2005): Classifying spatial patterns of brain activity with machine learning methods: Application to lie detection. NeuroImage 28: 663–668. [DOI] [PubMed] [Google Scholar]
- Dawson ME,Schell AM,Filion DL ( 2000): The electrodermal system In: Cacioppo JT,Tassinary LG,Berntson GG, editors. Handbook of Psychophysiology,2nd ed. Cambridge: Cambridge University Press; pp 200–223. [Google Scholar]
- D'Esposito M,Postle BR,Rypma B ( 2000): Prefrontal cortical contributions to working memory: Evidence from event‐related fMRI studies. Exp Brain Res 133: 3–11. [DOI] [PubMed] [Google Scholar]
- de Zubicaray GI,Andrew C,Zelaya FO,Williams SC,Dumanoir C ( 2000): Motor response suppression and the prepotent tendency to respond: A parametric fMRI study. Neuropsychologia 38: 1280–1291. [DOI] [PubMed] [Google Scholar]
- Edelberg R ( 1967): Electrical properties of the skin In: Brown CC, editor. Methods in Psychophysiology. Baltimore: Williams and Wilkins; pp 1–53. [Google Scholar]
- Farwell LA,Donchin E ( 1991): The truth will out: Interrogative polygraphy (“lie detection”) with event‐related potentials. Psychophysiology 28: 531–547. [DOI] [PubMed] [Google Scholar]
- Farwell LA,Smith SS ( 2001): Using brain MERMER testing to detect knowledge despite efforts to conceal. J Forensic Sci 46: 135–143. [PubMed] [Google Scholar]
- Furedy JJ ( 1986): Lie detection as psychophysiological differentiation: Some fine lines In: Coles M,Donchin E,Porges S, editors. Psychophysiology: Systems, Processes, and Applications—A Handbook. New York: Guilford; pp 683–700. [Google Scholar]
- Furedy JJ,Davis C,Gurevich M ( 1988): Differentiation of deception as a psychological process: A psychophysiological approach. Psychophysiology 25: 683–688. [DOI] [PubMed] [Google Scholar]
- Furedy JJ,Gigliotti F,Ben‐Shakhar G ( 1994): Electrodermal differentiation of deception: The effect of choice versus no choice of deceptive items. Int J Psychophysiol 18: 13–22. [DOI] [PubMed] [Google Scholar]
- Gamer M,Vossel G,Berti S ( 2005): Parallel measurement and analysis of event‐related brain potentials and skin conductance responses during processing of concealed information. Psychophysiology 42(Suppl 1): 57. [Google Scholar]
- Gamer M,Rill HG,Vossel G,Gödert HW ( 2006): Psychophysiological and vocal measures in the detection of concealed knowledge. Int J Psychophysiol 60: 76–87. [DOI] [PubMed] [Google Scholar]
- Ganis G,Kosslyn SM,Stose S,Thompson WL,Yurgelun‐Todd DA ( 2003): Neural correlates of different types of deception: An fMRI investigation. Cereb Cortex 13: 830–836. [DOI] [PubMed] [Google Scholar]
- Genovese CR,Lazar NA,Nichols T ( 2002): Thresholding of statistical maps in functional neuroimaging using the false discovery rate. NeuroImage 15: 870–878. [DOI] [PubMed] [Google Scholar]
- Gödert HW,Rill HG,Vossel G ( 2001): Psychophysiological differentiation of deception: The effects of electrodermal lability and mode of responding on skin conductance and heart rate. Int J Psychophysiol 40: 61–75. [DOI] [PubMed] [Google Scholar]
- Gronau N,Ben‐Shakhar G,Cohen A ( 2005): Behavioral and physiological measures in the detection of concealed information. J Appl Psychol 90: 147–158. [DOI] [PubMed] [Google Scholar]
- Habib R,Nyberg L,Tulving E ( 2003): Hemispheric asymmetries of memory: The HERA model revisited. Trends Cogn Sci 7: 241–245. [DOI] [PubMed] [Google Scholar]
- Hajcak G,McDonald N,Simons RF ( 2003): To err is autonomic: Error‐related brain potentials, ANS activity, and post‐error compensatory behavior. Psychophysiology 40: 895–903. [DOI] [PubMed] [Google Scholar]
- Konishi S,Nakajima K,Uchida I,Sekihara K,Miyashita Y ( 1998): No‐go dominant brain activity in human inferior prefrontal cortex revealed by functional magnetic resonance imaging. Eur J Neurosci 10: 1209–1213. [DOI] [PubMed] [Google Scholar]
- Konishi S,Nakajima K,Uchida I,Kikyo H,Kameyama M,Miyashita Y ( 1999): Common inhibitory mechanism in human inferior prefrontal cortex revealed by event‐related functional MRI. Brain 122: 981–991. [DOI] [PubMed] [Google Scholar]
- Kozel FA,Padgett TM,George MS ( 2004a): A replication study of the neural correlates of deception. Behav Neurosci 118: 852–856. [DOI] [PubMed] [Google Scholar]
- Kozel FA,Revell LJ,Lorberbaum JP,Shastri A,Elhai JD,Horner MD,Smith A,Nahas Z,Bohning DE,George MS ( 2004b): A pilot study of functional magnetic resonance imaging brain correlates of deception in healthy young men. J Neuropsychiatry Clin Neurosci 16: 295–305. [DOI] [PubMed] [Google Scholar]
- Kozel FA,Johnson KA,Mu Q,Grenesko EL,Laken SJ,George MS ( 2005): Detecting deception using functional magnetic resonance imaging. Biol Psychiatry 58: 605–613. [DOI] [PubMed] [Google Scholar]
- Langleben DD,Schroeder L,Maldjian JA,Gur RC,McDonald S,Ragland JD,O'Brien CP,Childress AR ( 2002): Brain activity during simulated deception: An event‐related functional magnetic resonance study. NeuroImage 15: 727–732. [DOI] [PubMed] [Google Scholar]
- Langleben DD,Loughead JW,Bilker WB,Ruparel K,Childress AR,Busch SI,Gur RC ( 2005): Telling truth from lie in individual subjects with fast event‐related fMRI. Hum Brain Mapp 26: 262–272. [DOI] [PMC free article] [PubMed] [Google Scholar]
- Lee TM,Liu HL,Tan LH,Chan CC,Mahankali S,Feng CM,Hou J,Fox PT,Gao JH ( 2002): Lie detection by functional magnetic resonance imaging. Hum Brain Mapp 15: 157–164. [DOI] [PMC free article] [PubMed] [Google Scholar]
- Lee TM,Liu HL,Chan CC,Ng YB,Fox PT,Gao JH ( 2005): Neural correlates of feigned memory impairment. NeuroImage 28: 305–313. [DOI] [PubMed] [Google Scholar]
- Liddle PF,Kiehl KA,Smith AM ( 2001): Event‐related fMRI study of response inhibition. Hum Brain Mapp 12: 100–109. [DOI] [PMC free article] [PubMed] [Google Scholar]
- Lykken DT ( 1959): The GSR in the detection of guilt. J Appl Psychol 43: 385–388. [Google Scholar]
- Lykken DT ( 1974): Psychology and the lie detector industry. Am Psychol 29: 725–739. [DOI] [PubMed] [Google Scholar]
- Lykken DT ( 1998): A Tremor in the Blood: Uses and Abuses of the Lie Detector,2nd ed. New York: Plenum. [Google Scholar]
- MacLaren VV ( 2001): A quantitative review of the guilty knowledge test. J Appl Psychol 86: 674–683. [DOI] [PubMed] [Google Scholar]
- Mathalon DH,Whitfield SL,Ford JM ( 2003): Anatomy of an error: ERP and fMRI. Biol Psychol 64: 119–141. [DOI] [PubMed] [Google Scholar]
- McCarthy G,Luby M,Gore J,Goldman‐Rakic P ( 1997): Infrequent events transiently activate human prefrontal and parietal cortex as measured by functional MRI. J Neurophysiol 77: 1630–1634. [DOI] [PubMed] [Google Scholar]
- Nagai Y,Critchley HD,Featherstone E,Trimble MR,Dolan RJ ( 2004): Activity in ventromedial prefrontal cortex covaries with sympathetic skin conductance level: A physiological account ofa “default mode” of brain function. NeuroImage 22: 243–251. [DOI] [PubMed] [Google Scholar]
- Nakayama M ( 2002): Practical use of the concealed information test for criminal investigations in Japan In: Kleiner M,editor. Handbook of Polygraph Testing. San Diego: Academic Press; pp 49–86. [Google Scholar]
- National Research Council ( 2003): The Polygraph and Lie Detection. Committee to Review the Scientific Evidence on the Polygraph. Division of Behavioral and Social Sciences and Education. Washington, DC: The National Academies Press. [Google Scholar]
- Nuñez JM,Casey BJ,Egner T,Hare T,Hirsch J ( 2005): Intentional false responding shares neural substrates with response conflict and cognitive control. NeuroImage 25: 267–277. [DOI] [PubMed] [Google Scholar]
- Patterson JC 2nd,Ungerleider LG,Bandettini PA ( 2002): Task‐independent functional brain activity correlation with skin conductance changes: An fMRI study. NeuroImage 17: 1797–1806. [DOI] [PubMed] [Google Scholar]
- Paus T,Koski L,Caramanos Z,Westbury C ( 1998): Regional differences in the effects of task difficulty and motor output on blood flow response in the human anterior cingulate cortex: A review of 107 PET activation studies. Neuroreport 9: R37–R47. [DOI] [PubMed] [Google Scholar]
- Phan KL,Magalhaes A,Ziemlewicz TJ,Fitzgerald DA,Green C,Smith W ( 2005): Neural correlates of telling lies: A functional magnetic resonance imaging study at 4 Tesla. Acad Radiol 12: 164–172. [DOI] [PubMed] [Google Scholar]
- Rogers RD,Ramnani N,Mackay C,Wilson JL,Jezzard P,Carter CS,Smith SM ( 2004): Distinct portions of anterior cingulate cortex and medial prefrontal cortex are activated by reward processing in separable phases of decision‐making cognition. Biol Psychiatry 55: 594–602. [DOI] [PubMed] [Google Scholar]
- Rosenfeld JP ( 2002): Event‐related potentials in the detection of deception, malingering, and false memories In: Kleiner M, editor. Handbook of Polygraph Testing. San Diego: Academic Press; pp 265–286. [Google Scholar]
- Rosenfeld JP,Cantwell G,Nasman VT,Wojdac V,Ivanov S,Mazzeri L ( 1988): A modified, event‐related potential‐based guilty knowledge test. Int J Neurosci 24: 157–161. [DOI] [PubMed] [Google Scholar]
- Rosenfeld JP,Soskins M,Bosh G,Ryan A ( 2004): Simple effective countermeasures to P300‐based tests of detection of concealed information. Psychophysiology 41: 205–219. [DOI] [PubMed] [Google Scholar]
- Rosenfeld JP,Biroschak JR,Furedy JJ ( 2006): P300‐based detection of concealed autobiographical versus incidentally acquired information in target and non‐target paradigms. Int J Psychophysiol 60: 251–259. [DOI] [PubMed] [Google Scholar]
- Seymour TL,Seifert CM,Shafto MG,Mosmann AL ( 2000): Using response time measures to assess “guilty knowledge”. J Appl Psychol 85: 30–37. [DOI] [PubMed] [Google Scholar]
- Sokolov EN ( 1963): Perception and the Conditioned Reflex. Oxford: Pergamon Press. [Google Scholar]
- Spence SA,Farrow TFD,Herford AE,Wilkinson ID,Zheng Y,Woodruff PWR ( 2001): Behavioural and functional anatomical correlates of deception in humans. NeuroReport 12: 2849–2853. [DOI] [PubMed] [Google Scholar]
- Tulving E,Kapur S,Craik FI,Moscovitch M,Houle S ( 1994): Hemispheric encoding/retrieval asymmetry in episodic memory: Positron emission tomography findings. Proc Natl Acad Sci USA 91: 2016–2020. [DOI] [PMC free article] [PubMed] [Google Scholar]
- van Hooff JC,Brunia CH,Allen JJ ( 1996): Event‐related potentials as indirect measures of recognition memory. Int J Psychophysiol 21: 15–31. [DOI] [PubMed] [Google Scholar]
- Venables PH,Christie MJ ( 1980): Electrodermal activity In: Martin I,Venables PH, editors. Techniques in Psychophysiology. Chichester: Wiley; pp 3–67. [Google Scholar]
- Verfaellie M,Bauer RM,Bowers D ( 1991): Autonomic and behavioral evidence of “implicit” memory in amnesia. Brain Cogn 15: 10–25. [DOI] [PubMed] [Google Scholar]
- Wager TD,Sylvester CY,Lacey SC,Nee DE,Franklin M,Jonides J ( 2005): Common and unique components of response inhibition revealed by fMRI. NeuroImage 27: 323–340. [DOI] [PubMed] [Google Scholar]
- Williams LM,Brammer MJ,Skerrett D,Lagopolous J,Rennie C,Kozek K,Olivieri G,Peduto T,Gordon E ( 2000): The neural correlates of orienting: An integration of fMRI and skin conductance orienting. Neuroreport 11: 3011–3015. [DOI] [PubMed] [Google Scholar]
- Wolpe PR,Foster KR,Langleben DD ( 2005): Emerging neurotechnologies for lie‐detection: Promises and perils. Am J Bioeth 5: 39–49. [DOI] [PubMed] [Google Scholar]