

Abstract
Impaired cognitive, memory, or motor performance is a distinguishing characteristic of neurological diseases. Although these symptoms are frequently the most evident in human patients, additional markers of disease are critical for proper diagnosis and staging. Noninvasive neuroimaging methods have become essential in this capacity and provide means of evaluating disease and tracking progression. These imaging methods are also becoming available to scientists in the research laboratory for assessment of animal models of neurological disease. Imaging in mouse models of neurological disease is of particular interest, owing to the availability of inbred strains and genetic manipulation tools that permit detailed investigation of the roles of various genes and gene products in disease pathogenesis. However, the relative prevalence of neuroimaging abnormalities in mice exhibiting neurological symptoms has not been reported. This prevalence has both theoretical and practical value because it is influenced by both the sensitivity of macroscopic anatomical measures to underlying genetic and disease processes and by the efficiency of neuroimaging in detecting and characterizing these effects. In this paper, we describe a meta‐analysis of studies involving behavioral mouse mutants at our laboratory. In summary, we have evaluated 15 different mutant genotypes, of which 13 showed abnormal neuroimaging findings. This indicates a surprisingly high prevalence of neuroimaging abnormalities (87%) and suggests that disease processes affecting behavior generally alter neuroanatomy as well. As a consequence, neuroimaging provides a highly sensitive marker of neurological disease in mice exhibiting abnormal behavior. Hum Brain Mapp 2007. © 2007 Wiley‐Liss, Inc.
Keywords: neuroanatomy; diagnostic imaging; magnetic resonance imaging; imaging, three‐dimensional; phenotype; mice; mice, mutant strains; mice, transgenic
INTRODUCTION
Neurological diseases frequently manifest symptoms of abnormal behavior or impaired motor control. Clinically, these symptoms are of paramount concern—and often the first to be recognized—because they negatively influence social function and quality of life. However, observation of these symptoms rarely constitutes a definitive diagnosis and supplemental evaluations are routinely necessary. For suspected neurological diseases, additional examinations often include functional and behavioral tests as well as diagnostic imaging. In this manner, neuroimaging methods have come to play an essential role in clinical decision‐making.
In addition to highlighting unusual pathological features, neuroimaging results can demonstrate anatomical and morphological abnormalities or changes that also provide important diagnostic information relevant to neurological diseases. Conditions with a chronic or progressive time‐course or diseases affecting developmental changes are particularly likely to alter anatomical and morphological features. Large‐scale human studies of disease populations have revealed that imaging findings of this type are often characteristic of individual diseases or disease processes. Examples include schizophrenia [Gaser et al., 1999], Alzheimer disease [Jack et al., 1992, 1997], Huntington's disease [Aylward et al., 1997, 1998; Jernigan et al., 1991], and attention‐defecit hyperactivity disorder [Giedd et al., 1994; Hynd et al., 1991]. Furthermore, symptoms detected by neuroimaging can frequently be correlated with behavioral manifestations of disease [Backman et al., 1997; Kwon et al., 2003; Hohol et al., 1997; Zivadinov et al., 2001]. Importantly, this can provide researchers with insights into disease pathogenesis, particularly in the beginning stages of investigation.
Nevertheless, a detailed investigation of disease mechanisms inevitably requires analyses of metabolic, biochemical, and genetic abnormalities. Thus, the study of neurological disease mechanisms is frequently based in small animal models of human disease, where experimentation with these parameters is possible. For investigations focusing on the role of genes or gene products, mouse models are generally preferred owing to the extensive set of genetic manipulation tools already available for mice. The use of genetically‐modified mice allows observation of disease progression or development in a genetically‐controlled environment and provides a means of experimenting with novel treatment regimens. However, it is important that each new mouse model be thoroughly and objectively characterized in order to detect significant phenotypes and establish the course of disease progression as compared to corresponding human conditions. In cases where comparable measurement tools for both mouse and human exist, these processes are expedited. Consequently, neuroimaging technologies are being adapted for preclinical research in the mouse.
Mouse brain images can be acquired relatively quickly, and then analyzed for detection or characterization of abnormalities. Detected imaging phenotypes then serve both as independent measures of disease status and as guides for additional functional and histological tests. In a similar fashion to population‐based neuroimaging studies in humans, comparisons of genetically‐modified mouse images with appropriate control images permits characterization of anatomical and morphological differences, which can subsequently be attributed to genetic factors. Although some phenotypes are evident by simple visual inspection, more detailed, quantitative comparisons can be computer‐automated for detection of local changes in shape and size through image registration [Collins and Evans, 1997; Woods et al., 1998a, 1998b] and analysis of the resultant deformation fields [Cao and Worsley, 1999; Chen et al., 2006; Kovacevic et al., 2005; Nieman et al., 2006; Thompson et al., 1997]. In inbred mice, where genetic variability is tightly controlled, a relatively small number of subjects are expected to be representative of the population, thus these analyses are possible with fewer individuals. Like the clinical experience, it is anticipated that anatomical and morphological abnormalities will be particularly common in models of neurological disease where behavioral deficits are also apparent. However, the prevalence of neuroimaging findings in mice exhibiting behavioral impairments has never been established and, hence, the likelihood of obtaining imaging findings in these mice is not known. Establishing this prevalence would clearly be beneficial to investigators characterizing new behavioral mutants. Of more fundamental interest, it would also provide preliminary indications of the sensitivity of neuroanatomy to underlying changes in gene expression, metabolism, and biochemical status as well as the efficiency of neuroimaging in detecting neuroanatomical abnormalities.
With the aim of determining the relative frequency of neuroimaging correlates to neurological disease, we have performed a meta‐analysis of neuroimaging investigations performed at the Mouse Imaging Centre (Toronto, Canada). We included all studies in which the heritable mouse mutant was reported to have behavioral or motor symptoms suggestive of neurological disease‐ranging from subtle learning impairments to severe disability in daily activities. Each of these mutants was evaluated separately for imaging phenotypes.
MATERIALS AND METHODS
Mouse Models
In this investigation, we considered all neuroimaging studies that occurred between October 2003 and December 2005 at the Mouse Imaging Centre (Hospital for Sick Children, Toronto, Canada). Of these studies, we selected the subset that included all heritable mouse mutants reported to have behavioral symptoms suggestive of possible neurological disease. Mutant mice in which symptoms could be explained by non‐neurological abnormalities were excluded. Mutant mice were generated by various methods including random mutagenesis, targeted gene modification, transgenic gene expression, and spontaneous mutagenesis. In each case, studies were initiated collaboratively for the purpose of phenotype discovery or in the aim of evaluating neuroimaging sensitivity. A complete list of mice and their associated symptoms and genetic information is reported in Table I. In each case, a group of mutant mice of a particular genotype was compared against a similar group of littermate control mice in order to assess possible neuroimaging phenotypes; the numbers of mutant, and associated control mice are also indicated in Table I.
Table I.
Summary of neuroimaging findings in behavioral mouse mutants
| Mouse identification (implicated gene) | Mice (number, genotype and age) | Behavioral or motor phenotype | Image/analysis protocol(s)a | Neuroimaging protocol and findings |
|---|---|---|---|---|
| Bobbing head, curly tail | 4 +/+ | Repetitive bobbing or wobbling of head; similar to the loop‐tail (Kibar et al., 2001) phenotype | I/2,3 | Enlarged ventricles (variably penetrant imaging phenotype, 15–120% volume increase) |
| 6 +/bhct | ||||
| (∼ 20 wks) | ||||
| Shaky | 6 +/+ | Resting tremor | I,II | None detected |
| 8 +/shk | ||||
| 5 shk/shk | Strong resting tremor | I,II | None detected | |
| (∼ 15 wks) | ||||
| (Xie et al., 2007) | 5 +/+ | Unsteady wobbly gait, reduced locomotor activity | I/2,3 | Cerebellum size decrease (7% decrease in total cerebellum‐to‐brain–volume ratio) |
| 4 +/wob | ||||
| (∼ 20 wks) | ||||
| 8 wob/wob | Severe disability (ataxia) | I/2,3 | Cerebellum size decrease (17% decrease in total cerebellum‐to‐brain–volume ratio) | |
| (∼ 20 wks) | ||||
| Cerebellar deficient folia (Catna2) (Park et al., 2002; Bock et al., 2006) | 5 +/+ | Hind leg clasping, unsteady gait | I/2 | Decreased volume of cerebellum, inferior colliculus and olfactory bulb |
| 5 cdf/cdf | ||||
| (∼ 11 wks) | ||||
| Neural Wiskott‐Aldrich syndrome protein N‐WASP (Wasl) | 5 +/+ | Severe disability (including limited mobility and impaired day‐to‐day function) | I/1 | Gross morphological abnormalities, enlarged ventricles, failed development of normal brain anatomy (immature appearance) |
| 6 −/− | ||||
| (∼ 2–3 wks) | ||||
| Sonic hedgehog pathway mutation | 5 +/+ | Severe disability (including limited mobility and impaired day‐to‐day function) | I/1 | Decreased size of olfactory bulbs, massively enlarged ventricles with associated tissue deformation (notably at hippocampus) |
| 5 −/− | ||||
| (∼ 3–5 wks) | ||||
| EphA4 (Epha4) | 8 +/− | Hopping behavior | III/1,3 | Abnormal formation of the anterior commissure (variable presentation) |
| 8 −/− | ||||
| (∼ 8 wks) | ||||
| EphB2 (Ephb2) (Henkemeyer et al., 1996) | 6 +/− | Timidity in behavioral test | III/1,3 | Posterior portion of the anterior commissure appears mostly absent |
| 7 −/− | ||||
| (∼ 8 wks) | ||||
| Huntington's disease model (expression of human huntingtin with 120 CAG repeats) (Slow et al., 2003; Van Raamsdonk et al., 2005) | 9 wildtype | Hyper/hypo‐activity, progressive motor and cognitive deficits | IV/3 | Decreased volume of striatum (−5%) and cortex |
| 9 YAC128 | ||||
| (∼ 34 wks) | ||||
| Schizophrenia mouse model (Disc1, two alleles, with homo‐ and hetero‐zygotes grouped) (Clapcote et al., 2007) | 6 +/+ | Impaired prepulse inhibition, impaired latent inhibition | IV/3 | Decreased volume of cortex, hippocampus, thalamus and cerebellum |
| 6 +/mutA | ||||
| 6 mutA/mutA | ||||
| 6 +/mutB | Impaired prepulse inhibition, impaired latent inhibition | IV/3 | Decreased volume of cortex, hippocampus, thalamus and cerebellum | |
| 6 mutB/mutB | ||||
| (∼ 12wks) | ||||
| Autoimmune mouse model MRL/MpJ‐lpr (Hess et al., 1993; Sakic et al., 1994, 2005) | 5 MRL/MpJ +/+ | Cognitive and neurologic deficits, increased timidity | IV/3 | Decreased overall brain size |
| 5 MRL/MpJ‐lpr | ||||
| (male, ∼19 wks) | ||||
| Cerebral ischemic damage (spontaneous mutation) | 3 +/+ | Development of excitability, lethargy, and postural abnormalities | V/1 | Defect of brain vasculature perfusion |
| 6 cid/cid | ||||
| (∼ 21 wks) | ||||
| Neuroimaging Summary | 15 genotypes, 173 mice imaged | Findings in 13 mutants (87%) | ||
Roman numerals refer to the imaging protocol description in the materials and methods section. Analysis protocol numbers indicate the criterion or criteria that established significance (as indicated in the image and statistical analysis subheading).
Imaging Protocols
Several imaging protocols and preparation methods were used and are described in detail later. The four MRI protocols (I–IV) are listed in order of increasing preparation complexity. Associated with the increased preparation effort are improvements in image resolution and, typically, increased total imaging time. As a general rule, the in vivo protocol (I) is preferable for high throughput exploratory or screening studies, for longitudinal studies, as well as any case where particular mice are needed for additional tests or observation. When higher resolution is desired than can be achieved in vivo, one of the fixed specimen protocols is beneficial and can detect more subtle phenotypes or quantify phenotypes with greater precision. In these cases, we have come to prefer protocols II or IV, which limit fixation distortion by leaving the brain in the skull. The micro‐computed tomography protocol is listed last (V), but should be considered to have comparable preparation complexity to protocol III. This protocol is optimized for ex vivo visualization of brain vasculature [Bentley et al., 2002].
All MR imaging was performed with multiple mouse MRI [Bock et al., 2003, 2005] on a VarianINOVA console (Varian NMR Instruments, Palo Alto, CA). In this technique, several mice are imaged simultaneously in the same gradient set using multiple radiofrequency coils. This increases image throughput and reduces the overall scan time required for each individual study. Protocols I through III used a 290 mm inner bore diameter gradient set (Tesla Engineering, Storrington, Sussex, UK) with 120 mT/m maximum amplitude and 870 μs rise time. Protocol IV was implemented with a 60 mm inner bore diameter insert gradient (Magnex Scientific, Yarnton, Oxford, UK) with 1000 mT/m maximum amplitude and 150 μs rise time.
Imaging Protocol I
For in vivo brain images, mice were anesthetized with vaporized isoflurane (Baxter Corporation, Toronto, Canada) and then imaged with one of two 3D imaging sequences. In the first case, fast spin‐echo images were acquired on a cartesian matrix with image parameters: TE/TR = 12/900 ms, effective TE = 36 ms, 8 echoes, two averages, field‐of‐view 40 × 24 × 24 mm3 and matrix size 384 × 208 × 208 for a voxel resolution of 104 × 115 × 115 μm3, and an imaging time of 2 h 45 min. The excitation tip angle was set to 40° [Nieman et al., 2005]. In the second case, manganese‐enhanced MRI was used with a spin echo acquisition. Mice were injected intraperitoneally with 20 mg/kg of manganese chloride [Lin and Koretsky, 1997; Pautler and Koretsky, 2002] (Aldrich Chemical Company, Milwaukee, WI) 48 h prior to imaging. Image parameters included TE = 8–10 ms, TR = 300 ms, two averages, field‐of‐view 40 × 20 × 20 mm3, and matrix size 256 × 128 × 128 for a voxel resolution of 156 μm isotropic and an imaging time of 1 h 50 min.
Imaging Protocol II
For fixed mouse and specimen imaging, we used an ultrasound‐guided (VisualSonics, Toronto, Canada) fixation protocol described previously [Zhou et al., 2004]. Briefly, the mouse was anesthetized and an IV catheter (0.62 mm diameter) and needle were used to puncture the left ventricle. Perfusion of phosphate‐buffered saline (PBS) and heparin (10 units/mL) through the catheter was followed by 10% buffered formalin phosphate (Fisher Scientific, Nepean, Ont., Canada) with drainage via the femoral and jugular veins. Each perfusate included gadopentetate dimeglumine (Magnevist, Berlex Canada, Quebec, Canada) at a concentration of 10 and 1 mM, respectively.
For in situ fixed mouse imaging, a multiple‐mouse MRI three‐dimensional spin‐echo sequence was used to acquire images of the entire head. Sequence parameters included TE/TR = 36/550 ms, field‐of‐view 40 × 24 × 24 mm3, and matrix size 512 × 300 × 300 for a voxel resolution of 78 × 80 × 80 μm3 and an imaging time of 13 h 45 min. An excitation flip angle of 140° was used.
Imaging Protocol III
Higher resolution images (60 μm) were achieved by imaging of fixed brains ex vivo. In this protocol animals were anesthetized with an overdose of Avertin (2.5%) via intraperitoneal injection. Following mouse fixation as described earlier, the heads were removed and left at room temperature for 60 min. Brains were removed and fixed for an additional 24 h in 4% paraformaldehyde (PFA) in PBS at room temperature. Specimens were placed into glass tubes filled with a proton‐free susceptibility‐matching fluid (Fluorinert FC‐77, 3M Corp., St Paul, MN) for imaging. Two custom‐built, 12 mm solenoid coils were used to image brains in parallel. A three‐dimensional spin echo sequence was used with imaging parameters as follows: TR/TE = 1,600/35 ms, one average, field‐of‐view = 24 × 12 × 12 mm3, and matrix size = 400 × 200 × 200 for a 60 μm isotropic voxel resolution. The total imaging time was 18.5 h.
Imaging Protocol IV
An improvement to Protocol III was achieved with a custom built array of 14 mm diameter solenoid coils constructed to fit within an insert gradient. In addition to improved gradient performance, this configuration used a slightly increased coil size and allowed imaging of the brain within the skull, eliminating fixation distortions. In this protocol, animals were fixed as described earlier and then decapitated. Preparation proceeded as described elsewhere [Tyszka et al., 2006]. Briefly, flesh exterior to the skull was removed and then the skull and intact brain were soaked progressively through several solutions: a 4% PFA bath for 4–5 h at 4°C; PBS and 0.01% sodium azide for 7 days on a nutator; and PBS with 2 mM concentration of Prohance (Bracco Diagnostics, Princeton, NJ) for at least 7 days.
For the purposes of imaging, each skull was immersed in Fluorinert (FC‐77, 3M Corp.) within a plastic tube. Images were acquired using a fast spin‐echo sequence with parameters: TE/TR = 8/325 ms, TEeff = 32 ms, ETL = 6, four averages, field‐of‐view 25 × 14 × 14 mm3, and matrix size 780 × 432 × 432 for a 32 μm isotropic voxel resolution and a total imaging time of 11 h 15 min [Henkelman et al., 2006].
Imaging Protocol V
In one of the mutants, brain vasculature was of particular interest. In this case, imaging was achieved using a specimen micro‐computed tomography scanner (GE eXplore Locus SP Specimen Scanner, GE Medical Systems, London, Ontario). Mice were prepared in a manner similar to the description in Protocol II. However, in this protocol, no MR contrast agent was used. Instead, an initial perfusion with buffered formalin was followed by perfusion with a radiopaque silicone rubber (Microfil MV‐122, Flow‐Tech, Carver, MA). The rubber was allowed to set for 90 min and then the brain was removed and placed in a fixative for at least 24 h. Prior to imaging, brains were suspended in 1% agar. Three‐dimensional CT data sets were acquired with the X‐ray source at 80 kVp (mean energy of incident beam: 32.5 keV). Images were acquired in 2 h with 720 views and reconstructed on a 20 μm isotropic grid using the Feldkamp algorithm for cone beam CT geometry.
Image and Statistical Analysis
Data analysis for each mutant study was performed independently. Consequently, different and evolving methodologies were used. In some cases, severely abnormal findings were obvious by visual inspection and further analysis was considered unnecessary. For the rest of the mutants, however, a more detailed comparison was necessary or beneficial. In these cases, a control group of mice and a mutant group of mice were imaged and then used to create average image representations through a process of image registration [Kovacevic et al., 2005]. Deformation fields for each individual, representing the nonlinear voxel‐to‐voxel displacements necessary to transform the individual image to the average, were used for detailed analysis. Several image analysis methods were implemented on the basis of these deformation fields. In the first method, the deformation fields were used to transform manual segmentations of the average images to each of the individuals. This permitted volumetric comparisons of individual neuroanatomical features. The significance of volume changes were determined by a Student's t‐test of structure volumes [Bock et al., 2006]. In a second analysis method, direct voxel‐by‐voxel comparison of the deformation field magnitudes revealed differences in the mutant model of Huntington disease (as determined by a t‐test). In the third and most common case, statistical maps were derived to assess local changes in shape and size [Nieman et al., 2006]. Direct comparison of the deformation fields was achieved by calculation of Hotelling's T2‐fields, which permitted evaluation of shape differences. Local size differences were determined by calculation of the determinant of the Jacobian matrix and then significance established with a Student's t‐test with multiple comparison correction by the false discovery rate (Benjamini and Hochberg, 1995; Benjamini and Yekutieli, 2001; Genovese et al., 2002). Alternatively, a nonparametric Mann–Whitney U test of Jacobian data was implemented for the Disc1 data sets.
In all cases, neuroanatomy for a mutant group was declared abnormal only when one or more of the following criteria were satisfied:
-
1
Individual mutants could be reliably distinguished—either qualitatively or quantitatively—from controls based on abnormal neuroanatomy from image data. These assessments could be verified easily “by eye.”
-
2
Comparison of segmented mutant and control images revealed volumetric differences in a particular neuroanatomical feature that reached statistical significance.
-
3
Statistical maps, deformation field magnitudes, or Jacobian fields derived from the deformation fields showed significant differences between control and mutant groups and could further be identified as a change in shape or size of particular neuroanatomical features.
RESULTS
The neuroanatomical phenotyping results are summarized in the final column of Table I. Each mutant study is provided with a description of the behavioral abnormality, the imaging acquisition protocol, and any imaging findings. Overall, 15 different imaging studies of behavioral mutants were investigated and included in this evaluation. Of these, 13 were demonstrated to have an associated phenotype by imaging methods. In this set of mice, therefore, 87% of behavioral mutants showed correlated neuroimaging findings.
Imaging findings were established by several analysis methods. Overall, three mutant genotypes showed imaging phenotypes of sufficient severity that further analysis was of limited interest. Four mutant phenotypes were detected on the basis of segmented volumes. Of these, three were further evaluated by additional computational methods. Finally, nine imaging phenotypes were detected by use of Jacobian fields and statistical maps. The types of analysis used for each mutant mouse genotype are indicated in Table I.
Neuroimaging findings were localized to several different regions of the brain. Specific examples are highlighted in Figure 1. In most cases, imaging findings correlated in severity or identified brain region to a primary behavioral phenotype. As an example, the heterozygous wobbly mutants show abnormalities in the cerebellum and corresponding motor impairments. Both of these phenotypes increased in severity in homozygous mutants. Additionally, imaging findings in the Disc1 and Huntington's disease mutants, for instance, show abnormalities consistent with findings in human studies, notably including the cortex and striatum, respectively. Findings of this nature suggest a strong behavior–anatomy relationship.
Figure 1.
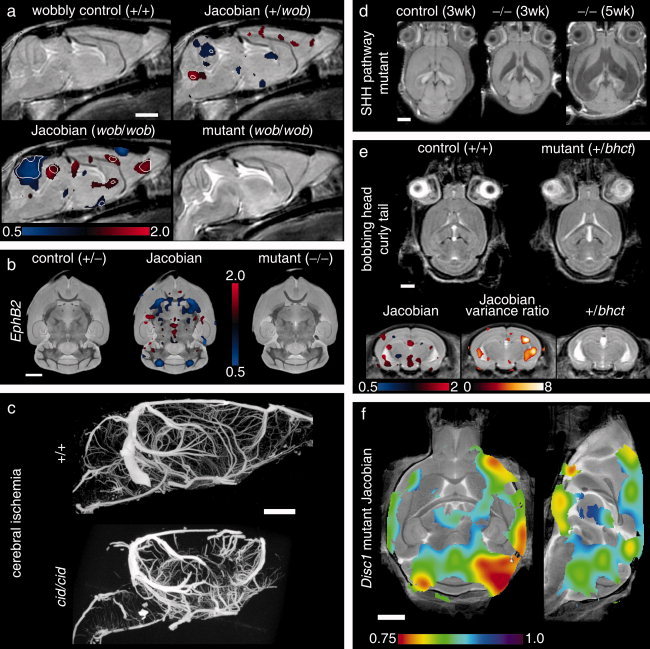
Neuroimaging findings in mouse mutants. Selected mouse mutants from Table I illustrate neuroimaging phenotypes and imaging protocols. In (a), an average control mouse image is shown with two Jacobian overlays indicating local volume changes in the heterozygous and homozygous wobbly mutants. Values greater or less than unity in the Jacobian field represent growth or shrinkage, respectively. Jacobian overlays in panel (a) are shown in regions where P < 0.05 with white contour lines indicating P = 0.002 (a false discovery rate of 5% in the homozygous mutant). The average homozygous wobbly mutant image is also shown for reference and exhibits a small cerebellum. In (b), data from the EphB2 knockout study indicates an abnormality at the anterior commissure (the posterior portion is absent). Jacobian data in the middle image indicate regions where P < 0.003 (5% false discovery rate). Panel (c) shows two sample micro‐CT data sets as maximum intensity projections. The cerebral ischemia mutant shows a striking defect in vascular perfusion as compared to the control. Panels (d) and (e) provide two examples of hydrocephalus. Three different individual images from the sonic hedgehog pathway mutation are shown (d) with massive expansion of the ventricles (shown as hypo‐intense regions). In panel (e), control and mutant averages from the bobbing head study show more subtle ventricle expansion (shown as hyper‐intense regions). In this case, statistical comparison of the mutant Jacobian values to a set of 20 control mice (four wildtype littermates supplemented with non‐littermate wildtypes) shows expanded ventricles (regions indicate a 5% false discovery rate) and increased variability at the lateral ventricles (Jacobian variance ratio is shown in regions where P < 0.05). In the final panel (f), regions of abnormality representative of the disrupted‐in‐schizophrenia‐1 mutants (Disc1) are shown as Jacobian data overlaid on an average image (regions indicate P < 0.05 by a Mann–Whitney U test). All white scale bars indicate 2 mm. Color scales are indicated in panels (a), (b), (e), and (f) for the respective overlays. Data were acquired with in vivo magnetic resonance imaging (MRI) (panels a, d, and e), ex vivo specimen computed tomography (c), ex vivo specimen MRI (d), and in situ specimen MRI (f). All MRI images are single slices from three‐dimensional isotropic data sets.
In some instances, anatomical imaging findings were identified that could not be directly related to a primary behavioral phenotype. For example, two of the mutants (the Cdf and sonic hedgehog pathway mutants) showed significant decreases in the size of the olfactory bulbs as compared to controls. Likewise, the Disc1 mutant showed an unexpected decrease in the size of the cerebellum. Similarly, some imaging findings were considered nonspecific in that they could not be associated with a region of the brain associated with any behavioral processes. These cases leave an ambiguous behavior–anatomy relationship. Hydrocephalus was the most noticeable of these findings, and was observed in several instances (the bobbing head curly tail, N‐WASP, and sonic hedgehog pathway mutants all exhibited hydrocephalus). These examples represent neuroanatomical findings that do not appear directly associated with existing behavioral phenotypes but are nevertheless correlated with them.
DISCUSSION
Interestingly, the 87% prevalence of neuroimaging abnormalities in behavioral mutants as described in this paper can be considered an underestimate. In this investigation, five different imaging protocols were used for the detection of possible abnormalities. The imaging protocols were, however, focused solely on characterization of neuroanatomy. While this provides an excellent starting point for analysis of mutant mice—particularly if no preliminary information or hypotheses are available, more specialized imaging methods may be better suited for detection of many types of phenotypes. Methods that are available or in development for the mouse permit angiography, molecular imaging, functional imaging, nerve fiber tracking, or other non‐invasive and quantitative tissue characterizations. These measurements can be achieved with various forms of MRI, X‐ray CT, positron emission tomography, single photon emission computed tomography, and ultrasound biomicroscopy. Since each imaging method is sensitive only to certain phenotypes, the combined contribution of these technologies would be expected to increase the number of neuroimaging findings. In addition, further improvements may also be possible by refinement of the analysis methods, which necessarily limit comparisons to select regions‐of‐interest in volume‐based analyses or make statistical assumptions about the data in deformation‐based analyses. Alternatively, increasing the number of imaging subjects would also increase the statistical power of image analyses and permit detection of more phenotypes. Hence, the prevalence of neuroimaging findings in behavioral mutants could be even higher than is suggested here.
Two mouse genotypes in this paper showed no neuroimaging findings. At present, other methods—including histological examination—have also failed to detect abnormalities that account for the behaviors of these mice. Consequently, it is not possible to predict whether an alternative imaging method would be more sensitive for detection of abnormalities in these mice. If there are subtle neuroanatomical abnormalities present, a larger number of mice may be sufficient to improve statistical power and enable detection of a neuroimaging phenotype. On the other hand, the prominent behavioral phenotype in these mice could be caused by abnormalities outside the brain, a case that should be considered relatively rare based on the results presented here.
It is likely that the high prevalence of neuroimaging abnormalities suggested by this data in mice is also present in other species and particularly in humans. Certainly the increased use of diagnostic imaging tools in the clinic indicates the growing value of anatomical visualization in clinical diagnostics. Already, characteristic neuroanatomical changes in several human diseases have been demonstrated (Aylward et al., 1997, 1998; Gaser et al., 1999; Giedd et al., 1994; Hynd et al., 1991; Jack et al., 1997). However, it is important to note that the genetic homogeneity in studies of inbred mice presents a unique advantage that greatly improves the statistical power of mouse studies. Results from a relatively small group of mice can be meaningfully averaged together and then compared with other groups. Limited anatomical variation in control groups permits detection of finer differences in mutant groups. Conversely, the ability to detect fine disease features in humans or even in other laboratory animals is hampered by a greater level of genetic—and corresponding phenotypic—heterogeneity. Hence hundreds of subjects may be necessary before subtle changes can be demonstrated. It is thus expected that results in mice can be achieved with fewer animals and increased efficiency, while maintaining a high level of comparability to the human disease case.
In the majority of cases we have observed, the nature of the neuroanatomical phenotype appears related to or indicative of a prominent behavioral phenotype. The presence of additional findings that were not anticipated from either genetic or behavioral observations underscores the importance of a systematic and objective assessment of mouse neuroanatomy. The discovery of these unexpected findings can be very significant; it may lead to the discovery of additional functional deficits or aid in the design of improved behavioral tests. On the other hand, these anatomical abnormalities may be indicative of co‐segregating traits or other incompletely understood genetic factors. In either case, neuroanatomical findings from the entire brain provide an important global and objective assessment for the comprehensive evaluation of behavioral mouse mutants.
To extract phenotypes from image data, it was necessary in most cases to use a computational means of image comparison. Simple inspection of image data was sufficient in only three of fifteen mutant genotypes. In the other cases, registration‐based methods were regularly able to highlight regions of change that were either not apparent by visual evaluation or required more detailed statistical comparison to establish differences. In the human situation, many of the “phenotypes” relevant to neurological disease are expected to be similar, where only small phenotypic differences from the normal population are present. As a result, large‐scale human screening studies and research labs performing imaging examinations of mouse models of human disease benefit greatly from registration‐based means of image comparison and analysis.
CONCLUSION
In this investigation, 13 of 15 different mutant mouse populations showing behavioral symptoms were found to have neuroanatomical abnormalities. The high prevalence (87%) of neuroimaging phenotypes in these mice indicates that disease processes producing abnormal behavior routinely result in neuroanatomical symptoms as well. Therefore, neuroanatomy represents an important marker of disease status and characterizations of new behavioral mouse mutants are greatly benefited by comprehensive neuroanatomical assessment. These assessments require efficient visualization of tissue over the whole brain. While histopathological methods will remain an essential component of mouse characterization, the survey of imaging studies in this paper suggests that many of the neuroanatomical manifestations of disease are apparent at a macroscopic scale. Differences between normal and mutant mice at this scale are especially well‐suited to detection by imaging methods, which offer improved three‐dimensional visualization and corresponding enhancements in the detection of complex shape, size, and volume differences. This suggests that imaging has the potential to play a prominent role in characterization of mouse mutants and screening of mouse populations.
NOTE ADDED IN PROOF
Since submission of this paper, we have finished the analysis of an additional 4 behavioral mutants, all of which have neuroanatomical abnormalities shown by imaging. This brings the prevalence to 17 out 19 which is 89%.
Acknowledgements
The authors gratefully acknowledge the support of collaborators in connection with the mouse studies summarized in this paper. In particular, we thank the following contributions: J. Rossant, S. L. Adamson and J. C. Roder of the Centre for Modeling Human Disease (Toronto, Ontario, Canada) for the bobbing head, shaky, Cacna1a, Nwasp and Disc1 mutants; S. L. Ackerman for the cdf mutants; C. C. Hui for the sonic hedgehog pathway mutants; J. T. Henderson for the EphA4 and EphB2 mutants; M. R. Hayden for the YAC128 HD mouse model; B. Sakic for the MRL/MpJ‐lpr mouse model; and R. W. Burgess for the cerebral ischemia mouse mutant.
REFERENCES
- Aylward EH,Anderson NB,Bylsma FW,Wagster MV,Barta PE,Sherr M,Feeney J,Davis A,Rosenblatt A,Pearlson GD,Ross CA( 1998): Frontal lobe volume in patients with Huntington's disease. Neurology 50: 252–258. [DOI] [PubMed] [Google Scholar]
- Aylward EH,Li Q,Stine OC,Ranen N,Sherr M,Barta PE,Bylsma FW,Pearlson GD,Ross CA( 1997): Longitudinal change in basal ganglia volume in patients with Huntington's disease. Neurology 48: 394–399. [DOI] [PubMed] [Google Scholar]
- Backman L,Robins‐Wahlin TB,Lundin A,Ginovart N,Farde L( 1997): Cognitive deficits in Huntington's disease are predicted by dopaminergic PET markers and brain volumes. Brain 120: 2207–2217. [DOI] [PubMed] [Google Scholar]
- Benjamini Y,Hochberg Y( 1995): Controlling the false discovery rate—a practical and powerful approach to multiple testing. J Roy Stat Soc B Met 57: 289–300. [Google Scholar]
- Benjamini Y,Yekutieli D( 2001): The control of the false discovery rate in multiple testing under dependency. Ann Stat 29: 1165–1188. [Google Scholar]
- Bentley MD,Ortiz MC,Ritman EL,Romero JC( 2002): The use of microcomputed tomography to study microvasculature in small rodents. Am J Physiol Regul Integr Comp Physiol 282: R1267–R1279. [DOI] [PubMed] [Google Scholar]
- Bock NA,Konyer NB,Henkelman RM( 2003): Multiple‐mouse MRI. Magn Reson Med 49: 158–167. [DOI] [PubMed] [Google Scholar]
- Bock NA,Kovacevic N,Lipina TV,Roder JC,Ackerman SL,Henkelman RM( 2006): In vivo magnetic resonance imaging and semiautomated image analysis extend the brain phenotype for cdf/cdf mice. J Neurosci 26: 4455–4459. [DOI] [PMC free article] [PubMed] [Google Scholar]
- Bock NA,Nieman BJ,Bishop JB,Henkelman RM( 2005): In vivo multiple‐mouse MRI at 7 Tesla. Magn Reson Med 54: 1311–1316. [DOI] [PubMed] [Google Scholar]
- Cao J,Worsley KJ( 1999): The detection of local shape changes via the geometry of Hotelling's T‐2 fields. Ann Stat 27: 925–942. [Google Scholar]
- Chen XJ,Kovacevic N,Lobaugh NJ,Sled JG,Henkelman RM,Henderson JT( 2006): Neuroanatomical differences between mouse strains as shown by high‐resolution 3D MRI. Neuroimage 29: 99–105. [DOI] [PubMed] [Google Scholar]
- Clapcote SJ,Lipina TV,Millar JK,Mackie S,Christie S,Ogawa F,Lerch JP,Trimble K,Uchiyama M,Sakuraba Y,Kaneda H,Shiroishi T,Houslay MD,Henkelman RM,Sled JG,Gondo Y,Porteous DJ,Roder JC( 2007): Behavioral phenotypes of Disc1 missense mutations in mice. Neuron (in press). [DOI] [PubMed] [Google Scholar]
- Collins DL,Evans AC( 1997): Animal: Validation and applications of nonlinear registration‐based segmentation. Intern J Pattern Recognit Artif Intell 11: 1271–1294. [Google Scholar]
- Gaser C,Volz HP,Kiebel S,Riehemann S,Sauer H( 1999): Detecting structural changes in whole brain based on nonlinear deformations‐application to schizophrenia research. Neuroimage 10: 107–113. [DOI] [PubMed] [Google Scholar]
- Genovese CR,Lazar NA,Nichols T( 2002): Thresholding of statistical maps in functional neuroimaging using the false discovery rate. Neuroimage 15: 870–878. [DOI] [PubMed] [Google Scholar]
- Giedd JN,Castellanos FX,Casey BJ,Kozuch P,King AC,Hamburger SD,Rapoport JL( 1994): Quantitative morphology of the corpus‐callosum in attention‐deficit hyperactivity disorder. Am J Psychiatry 151: 665–669. [DOI] [PubMed] [Google Scholar]
- Henkelman RM,Dazai J,Lifshitz N,Nieman BJ,Tsatskis S,Lerch J,Bishop J,Kale S,Sled JG,Chen XJ( 2006): High throughput microimaging of the mouse brain. Proc Intl Soc Mag Reson Med 14: 396(abstract 2010). At the International Society of Magnetic Resonance in Medicine 14th Scientific Meeting, Seattle, WA, May 2006. [Google Scholar]
- Henkemeyer M,Orioli D,Henderson JT,Saxton TM,Roder J,Pawson T,Klein R( 1996): Nuk controls pathfinding of commissural axons in the mammalian central nervous system. Cell 86: 35–46. [DOI] [PubMed] [Google Scholar]
- Hess DC,Taormina M,Thompson J,Sethi KD,Diamond B,Rao R,Chamberlain CR,Feldman DS( 1993): Cognitive and neurologic deficits in the MRL/lpr mouse: A clinicopathologic study. J Rheumatol 20: 610–617. [PubMed] [Google Scholar]
- Hohol MJ,Guttmann CR,Orav J,Mackin GA,Kikinis R,Khoury SJ,Jolesz FA,Weiner HL( 1997): Serial neuropsychological assessment and magnetic resonance imaging analysis in multiple sclerosis. Arch Neurol 54: 1018–1025. [DOI] [PubMed] [Google Scholar]
- Hynd GW,Semrudclikeman M,Lorys AR,Novey ES,Eliopulos D,Lyytinen H( 1991): Corpus‐callosum morphology in attention deficit‐hyperactivity disorder—Morphometric analysis of MRI. J Learn Disabil 24: 141–146. [DOI] [PubMed] [Google Scholar]
- Jack CR Jr,Petersen RC,O'Brien PC,Tangalos EG( 1992): MR‐based hippocampal volumetry in the diagnosis of Alzheimer's disease. Neurology 42: 183–188. [DOI] [PubMed] [Google Scholar]
- Jack CR Jr,Petersen RC,Xu YC,Waring SC,O'Brien PC,Tangalos EG,Smith GE,Ivnik RJ,Kokmen E( 1997): Medial temporal atrophy on MRI in normal aging and very mild Alzheimer's disease. Neurology 49: 786–794. [DOI] [PMC free article] [PubMed] [Google Scholar]
- Jernigan TL,Salmon DP,Butters N,Hesselink JR( 1991): Cerebral structure on MRI. 2. Specific changes in Alzheimers and Huntingtons diseases. Biol Psychiatry 29: 68–81. [DOI] [PubMed] [Google Scholar]
- Kibar Z,Vogan KJ,Groulx N,Justice MJ,Underhill DA,Gros P( 2001): Ltap, a mammalian homolog of Drosophila Strabismus/Van Gogh, is altered in the mouse neural tube mutant Loop‐tail. Nat Genet 28: 251–255. [DOI] [PubMed] [Google Scholar]
- Kovacevic N,Henderson JT,Chan E,Lifshitz N,Bishop J,Evans AC,Henkelman RM,Chen XJ( 2005): A three‐dimensional MRI atlas of the mouse brain with estimates of the average and variability. Cereb Cortex 15: 639–645. [DOI] [PubMed] [Google Scholar]
- Kwon JS,Kim JJ,Lee DW,Lee JS,Lee DS,Kim MS,Lyoo IK,Cho MJ,Lee MC( 2003): Neural correlates of clinical symptoms and cognitive dysfunctions in obsessive‐compulsive disorder. Psychiatry Res 122: 37–47. [DOI] [PubMed] [Google Scholar]
- Lin YJ,Koretsky AP( 1997): Manganese ion enhances T1‐weighted MRI during brain activation: An approach to direct imaging of brain function. Magn Reson Med 38: 378–388. [DOI] [PubMed] [Google Scholar]
- Nieman BJ,Bock NA,Bishop J,Sled JG,Chen XJ,Henkelman RM( 2005): Fast spin‐echo for multiple mouse magnetic resonance phenotyping. Magn Reson Med 54: 532–537. [DOI] [PubMed] [Google Scholar]
- Nieman BJ,Flenniken AM,Adamson SL,Henkelman RM,Sled JG( 2006): Anatomical phenotyping in the brain and skull of a mutant mouse by magnetic resonance imaging and computed tomography. Physiol Genomics 24: 154–162. [DOI] [PubMed] [Google Scholar]
- Park C,Falls W,Finger JH,Longo‐Guess CM,Ackerman SL( 2002): Deletion in Catna2, encoding alpha N‐catenin, causes cerebellar and hippocampal lamination defects and impaired startle modulation. Nat Genet 31: 279–284. [DOI] [PubMed] [Google Scholar]
- Pautler RG,Koretsky AP( 2002): Tracing odor‐induced activation in the olfactory bulbs of mice using manganese‐enhanced magnetic resonance imaging. Neuroimage 16: 441–448. [DOI] [PubMed] [Google Scholar]
- Sakic B,Hanna SE,Millward JM( 2005): Behavioral heterogeneity in an animal model of neuropsychiatric lupus. Biol Psychiatry 57: 679–687. [DOI] [PMC free article] [PubMed] [Google Scholar]
- Sakic B,Szechtman H,Talangbayan H,Denburg SD,Carbotte RM,Denburg JA( 1994): Disturbed emotionality in autoimmune MRL‐lpr mice. Physiol Behav 56: 609–617. [DOI] [PubMed] [Google Scholar]
- Slow EJ,van RJ,Rogers D,Coleman SH,Graham RK,Deng Y,Oh R,Bissada N,Hossain SM,Yang YZ,Li XJ,Simpson EM,Gutekunst CA,Leavitt BR,Hayden MR( 2003): Selective striatal neuronal loss in a YAC128 mouse model of Huntington disease. Hum Mol Genet 12: 1555–1567. [DOI] [PubMed] [Google Scholar]
- Thompson PM,MacDonald D,Mega MS,Holmes CJ,Evans AC,Toga AW( 1997): Detection and mapping of abnormal brain structure with a probabilistic atlas of cortical surfaces. J Comput Assist Tomogr 21: 567–581. [DOI] [PubMed] [Google Scholar]
- Tyszka JM,Readhead C,Bearer EL,Pautler RG,Jacobs RE( 2006): Statistical diffusion tensor histology reveals regional dysmyelination effects in the shiverer mouse mutant. Neuroimage 29: 1058–1065. [DOI] [PMC free article] [PubMed] [Google Scholar]
- Van Raamsdonk JM,Pearson J,Slow EJ,Hossain SM,Leavitt BR,Hayden MR( 2005): Cognitive dysfunction precedes neuropathology and motor abnormalities in the YAC128 mouse model of Huntington's disease. J Neurosci 25: 4169–4180. [DOI] [PMC free article] [PubMed] [Google Scholar]
- Woods RP,Grafton ST,Holmes CJ,Cherry SR,Mazziotta JC( 1998a): Automated image registration. I. General methods and intrasubject, intramodality validation. J Comput Assist Tomogr 22: 139–152. [DOI] [PubMed] [Google Scholar]
- Woods RP,Grafton ST,Watson JD,Sicotte NL,Mazziotta JC( 1998b): Automated image registration. II. Intersubject validation of linear and nonlinear models. J Comput Assist Tomogr 22: 153–165. [DOI] [PubMed] [Google Scholar]
- Xie G,Clapcote S,Nieman B,Tallerico T,Huang Y,Vukobradovic I,Cordes S,Osborne L,Rossant J,Sled JG,Henderson J,Roder JC( 2007): Forward genetics screen of mouse reveals dominant missense mutation in the P/Q‐type VDCC. Genes Brain BehavEpub ahead of print PMID 17376154. [DOI] [PubMed] [Google Scholar]
- Zhou YQ,Davidson L,Henkelman RM,Nieman BJ,Foster FS,Yu LX,Chen XJ( 2004): Ultrasound‐guided left‐ventricular catheterization: A novel method of whole mouse perfusion for microimaging. Lab Invest 84: 385–389. [DOI] [PubMed] [Google Scholar]
- Zivadinov R,Sepcic J,Nasuelli D,De Masi R,Bragadin LM,Tommasi MA,Zambito‐Marsala S,Moretti R,Bratina A,Ukmar M,Pozzi‐Mucelli RS,Grop A,Cazzato G,Zorzon M( 2001): A longitudinal study of brain atrophy and cognitive disturbances in the early phase of relapsing‐remitting multiple sclerosis. J Neurol Neurosurg Psychiatry 70: 773–780. [DOI] [PMC free article] [PubMed] [Google Scholar]