

Abstract
The purpose of the present study was to assess the retest reliability of cortical activation detected by event‐related functional near‐infrared spectroscopy (fNIRS) based on craniocerebral correlations. Isolated functional activation was evoked in the motor cortex by a periodically performed finger‐tapping task. During 44‐channel fNIRS recording, 12 subjects performed 30 trials of right and left index finger tapping in two sessions. The retest interval was set to 3 weeks. Simple correlations of the contrast t‐values supplemented by scatterplots, channel‐wise intraclass correlation coefficients (ICC), as well as reproducibility indices for the size and the location of the detected activation were calculated. The results at the group level showed sufficient single measure ICCs (up to 0.80) and excellent reproducibility of the size and the location (up to 89% were reproducible). Comparisons of the intersession group amplitudes demonstrate that the fNIRS signals were stable across time in a retest study design: the number of significant differences was less than randomly occurring false‐positive activated channels if an alpha level of 5% is chosen. Effect size analyses indicated that the intersession amplitude differences are small (mean < 0.25). For deoxyhemoglobin and oxyhemoglobin distinct statistical power profiles were revealed regarding the activation vs. baseline contrast as well as the intersession amplitude differences, indicating a higher sensitivity of deoxyhemoglobin for local hemodynamic changes. The results suggest that sensorimotor activation assessed by event‐related fNIRS based on craniocerebral correlations is sufficiently reproducible at the group level. Hum Brain Mapp, 2006. © 2006 Wiley‐Liss, Inc.
Keywords: multichannel functional near‐infrared spectroscopy (fNIRS), retest reliability, reproducibility, event‐related, motor task, oxyhemoglobin, deoxyhemoglobin
INTRODUCTION
Functional near‐infrared spectroscopy (fNIRS) is a hemodynamic‐based technique for the noninvasive assessment of human cortical brain activation [see, e.g., Hoshi, 2003; Obrig and Villringer, 2003, for detailed reviews]. fNIRS enables one to measure changes in the concentration of oxygenated (O2Hb) and deoxygenated (HHb) hemoglobin separately. Furthermore, changes of total hemoglobin can be calculated by the sum of O2Hb and HHb. The typical fNIRS signal of activation is a decrease of HHb accompanied by an increase of O2Hb comparable in time course and shape to the blood oxygenation level‐dependent (BOLD) signal of functional MRI (fMRI) [Logothetis and Wandell, 2004]. In contrast to other neuroimaging tools, fNIRS utilizes the optical, rather than radioactive (as positron emission tomography (PET)) or magnetic properties (fMRI) of the cerebral blood and consequently obviates the need of complex technical arrangements or the application of a contrast medium. This inherent advantage and others like no noise disturbance, minor movement restrictions, relatively high temporal resolution, and relatively low costs enabled fNIRS to emerge quickly as an alternative neuroimaging tool. In spite of the low spatial resolution (∼ 30 mm) and the limitation to cortical surface structures, fNIRS is a valuable tool, particularly for research interests wherein other neuroimaging tools are difficult to apply (e.g., neonates, anxiety disorders with claustrophobia, severe forms of psychiatric diseases, Parkinson's disease, neurofeedback, etc.).
In contrast to the growing number of fNIRS studies in psychological, psychiatric, and basic research [e.g., Ehlis et al., 2005; Fallgatter and Strik, 1998; Fujiwara et al., 2004; Herrmann et al., 2005; Kusaka et al., 2004; Matsuo et al., 2005; Safonova et al., 2004; Schroeter et al., 2004a; Shimada et al., 2005; Weber et al., 2005], little is known about the extent to which the different aspects of the detected activation (size, localization, amplitude) are reproducible. Only a few multichannel fNIRS retest studies exist [Sato et al., 2006; Watanabe et al., 2003]. Moreover, the existing studies are performed in a block‐wise manner. Meanwhile, event‐related fNIRS studies have been realized [e.g., Horovitz and Gore, 2004; Kennan et al., 2002; Schroeter et al., 2004a; Tsujimoto et al., 2004] that provide much greater flexibility in experimental designs. Only one event‐related retest study exists wherein a visual paradigm was tested [Plichta et al., 2006]. To our knowledge, no fNIRS retest reliability study has been published wherein an event‐related motor paradigm was examined. Therefore, the present study bridges this gap by investigating the reproducibility of cortical activation evoked by an event‐related finger‐tapping task detected with multichannel fNIRS.
In order to gain multifaceted insight, three different aspects of reproducibility were inspected at the single subject as well as on the group level: the magnitude of the activation, the spatial extent, and the position. Furthermore, consequences arising from conventionally positioning the fNIRS sensors according to probabilistic craniocerebral correlations (EEG or anatomical marks) are discussed.
MATERIALS AND METHODS
Subjects
Twelve healthy volunteers (seven female and five male, mean age 29.1 ± 6.0 years) participated in the present study twice. The retest interval was set to 3 weeks (mean interval 22.2 ± 2.3 days). All subjects were right‐handed. No subject had a history of any neurological or psychiatric disorder. All subjects were informed about the nature of the experiment, as well as the operating mode of the NIRS instrument, before giving written informed consent. A brief instruction to remain relaxed and to avoid any major body movement was given. The NIRS‐investigation of healthy participants was in accordance with the latest version of the Declaration of Helsinki and was approved by the Ethics Committee of the University of Wuerzburg as well as the research conference of the Department of Psychiatry and Psychotherapy.
Motor Task
Subjects were seated in a comfortable chair facing a 21″ monitor at a distance of ˜60 cm in a dimmed room. A visual cue indicated the start and the end of the tapping task by its appearance and its disappearance, respectively. The particular hand of the subject was laid on a thick terry towel to prevent auditory stimulation evoked by the tapping. The task was realized in an event‐related paradigm by performing brief index finger tapping for 1,200 ms followed by a 13.8‐s resting period. Subjects were asked to react as quickly as possible and to perform three taps per trial (resulting in a tapping frequency of ˜2.5 Hz). The number of trials was set to 30 for each hand. The order of right and left finger tapping was random across subjects. The uniformity of the tapping performance regarding the frequency and magnitude was emphasized by the instruction and trained in a session of three trials preceding the experimental trials. During the whole experiment the task performance was visually controlled by the experimenter.
Functional Near‐Infrared Spectroscopy
The fundamentals of NIRS are described in detail elsewhere [Hoshi, 2003; Obrig and Villringer, 2003]. Relative changes of O2Hb and HHb were recorded on a continuous wave system (ETG‐4000; Hitachi Medical, Japan) using two 3 × 5 optode probe sets (each consisting of seven photodetectors and eight light emitters) resulting in 22 channels per hemisphere (see Fig. 1). The emitted light was of two different wavelengths (695 nm for HHb and 830 nm for O2Hb) and its frequency was modulated in wavelengths and channels to prevent crosstalk. Reflected light leaving the tissue was received by the photodetectors and transmitted into a set of lock‐in amplifiers that are limited to the particular frequencies of interest. Measurements performed at both wavelengths were used to solve the modified Beer–Lambert equation for scattering media, which resulted in the relative quantification of O2Hb and HHb, respectively. The unit of measurement was mmol × mm because the path length is not assessed by continuous wave systems [Hoshi, 2003] and a specific value for the path length was not adopted from the literature [e.g., Duncan, 1996].
Figure 1.
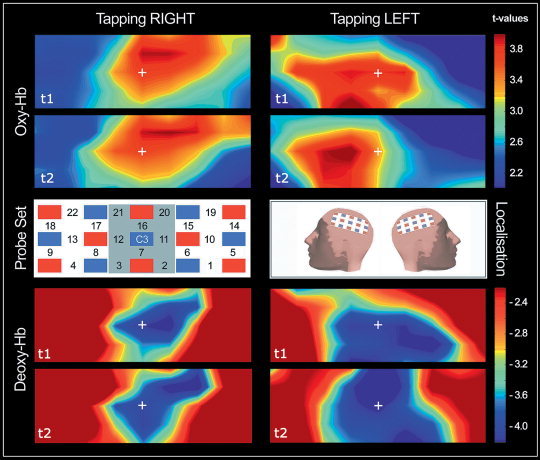
The channel scheme of the probe sets is shown in the middle row/left. Note that only one probe set is displayed (localized over the left hemisphere). Note that the channel numbering of the second probe set over the right hemisphere (not shown) is horizontally mirror‐inverted. Red squares represent light emitters, whereas blue squares are detectors. The region of interest (ROI) is gray shaded. The middle row/center optode is placed over C3/C4 according to the international 10‐20 system as shown in the middle row/right (“localization”). The activation maps are color‐coded t‐values obtained from the group analyses. The measurement sessions are indicated by “t1” and “t2.” Results of O2Hb for right and left finger tapping are shown in the upper panel (“Oxy‐Hb”). The HHb (“Deoxy‐Hb”) results are displayed in the lower panel. Note that the maps are second‐level group maps and based on interpolations from single channels.
The two probe sets were placed on the scalp with their middle‐row center optode at positions C3 and C4 according to the international 10‐20 system (for the craniocerebral correspondence, see Okamoto et al. [2004]). According to Singh et al. [2005] the chosen localization of the center optode ensures the least amount of expected anatomical variability across subjects. The interoptode distance was 30 mm, which results in measuring ˜30 mm beneath the scalp. The sampling rate was set to 10 Hz. A region of interest (ROI) was defined comprising the channels shown in Figure 1.
Data Analysis
The data were analyzed with custom software programmed in Matlab (MathWorks, Natick, MA). The functional image time‐series were preprocessed by applying a bandpass filter (cut‐off frequencies of 0.02 Hz and 0.7 Hz) to remove baseline drifts and pulsation due to heartbeat.
The preprocessed data were analyzed with the two‐stage ordinary least squares (OLS) estimation methodology [e.g., Bullmore et al., 1996; Marchini and Smith, 2003]. A two‐parameter gamma hemodynamic response function (HRF) was used as a predictor for the O2Hb and the HHb time series (for the rationale of using the HRF for both fNIRS parameters, see below). We included its first and second temporal derivative in order to modulate the onset as well as the dispersion of the HRF. A delta function (=“stick function”) indicating the onset of the motor task was convolved with the predictors. After the first‐stage OLS estimation the resulting residuals were inspected for model conformity. We corrected our analyses for serial correlated errors by fitting a first‐order autoregressive process to the error term by the Cochrane–Orcutt procedure [Cochrane and Orcutt, 1949]. Finally, the beta weights, which represent the amplitudes of the hemodynamic response, were reestimated (second stage) and tested for statistical significance by one‐sided t‐tests (single‐subject level). For the group analyses a random‐effects model was used taking the beta‐weights of each subject as the dataset. The statistical inferences on the second level were done using simple t‐tests. For both levels (single subject and group level) significant cortical activation is indicated by positive t‐values for [O2Hb] and by negative t‐values for [HHb], respectively. We used Bonferroni correction and included the spatial correlation among the channels by calculating the Dubey/Armitage‐Parmar alpha boundary [e.g., Sankoh et al., 1997]. The alpha level was corrected on the basis of the first session. Effect sizes d of the activation vs. baseline contrast were calculated according to Cohen [1988].
Tests for Reproducibility
Reproducibility was examined at three different levels. At the single‐subject level linear correlation coefficients of the individual t‐values (Sessions 1 and 2) were calculated to assess the amount of similarity in the measured activation of each subject. Second, channel‐wise examinations were performed on the group level by using the ICC (one‐way random effects) for quantifying the reliability of the fitted hemodynamic response over the two measurements. In order to draw conclusions for single measures as well as for the accuracy of the derived mean value over both sessions, we report the single measure ICC and the average measure ICC.
In order to investigate the reproducibility of mean signal changes across the two sessions, channel‐wise paired t‐tests were calculated (the alpha‐level of 5% was not adjusted, because of the interest in confirming the null hypothesis). To quantify the difference of the amplitudes, effect size parameters for dependent measurements d′ as well as an estimation of the effect size for independent measurements are reported [Cohen, 1988]. The third aspect of assessing reproducibility was a global comparison of the two complete activation maps (map‐wise view). Therefore, scatterplots and linear correlations of the t‐values obtained from both sessions were used.
Additionally, the size and location of the two acquired activation patterns were compared. According to Rombouts et al. [1997], RSIZE and ROVERLAP were calculated:
where A1 and A2 represent the size of the activated area (operationalized by counting significantly activated channels) of the first and second session, respectively. AOVERLAP is the quantity of identical channels that shared significant activation in both sessions. Both indices range from 0 (worst) to 1 (best) or can be expressed as percent values. Reliability indices (i.e., the retest correlation coefficients, ICCs, ROVERLAP and RQUANTITY) of ≥0.80 are considered highly reliable, ≥0.60 as moderately reliable, and values of <0.60 as weakly reliable [Charter, 2003].
RESULTS AND DISCUSSION1
As shown in Figure 1, fNIRS enabled detection of significant activation in the contralateral motor cortex after periodically performed index finger tapping. Since the detected activation is near the center of the maps, the localization of the probe sets can be evaluated as adequate.
Single‐Subjects Level
Table I shows the mean reproducibility indices at the single‐subject level. The correlation coefficients as well as RSIZE and ROVERLAP do not exceed low to mediocre values (if values of >0.80 are considered as sufficiently high). By comparing the reported indices, the average size of the activation is the most consistent. In line with authors who evaluated HHb as the locally more specific fNIRS parameter [e.g., Obrig and Villringer, 2003], this effect is even more pronounced in [HHb] (74% and 70% compared to 68% and 55% in [O2Hb] of the size is reproducible).
Table I.
Mean reproducibility indices based on the obtained individual t‐values (the single‐subject level)
| Parameter | Tapping | R | RSIZE | ROVERLAP |
|---|---|---|---|---|
| O2Hb | Right | 0.54 | 0.68 | 0.61 |
| Left | 0.49 | 0.55 | 0.36 | |
| HHb | Right | 0.48 | 0.74 | 0.38 |
| Left | 0.52 | 0.70 | 0.52 | |
| Grand mean a | — | 0.50 (0.52/0.50) | 0.67(0.62/0.72) | 0.47 (0.49/0.45) |
Grand mean is the average value (bold) independent of the particular tapping task (right/left) and across both the fNIRS parameters (O2Hb and HHb). Values in parentheses are the average for O2Hb (first value) and HHb (second value), separately.
With respect to the absolute values of the indices and their rank order (RSIZE > ROVERLAP), our results are in line with single‐subject reliability assessed with fMRI [e.g., Machielsen et al., 2000; Miki et al., 2001; Rombouts et al., 1997, 1998]. The reason for the single‐subject variability is unclear. In fMRI studies movement artifacts, repositioning errors, and physiological factors are hypothesized to negatively influence the single‐subject reproducibility. With regard to fNIRS studies, it can be hypothesized that a slight displacement of the probe sets had occurred across the sessions. This would explain why RSIZE is the most reproducible (since the size remains constant independent of where it is localized), whereas the localization indices are lower (because the equally sized hot spots are at different localizations). Because the channels are in part highly correlated (r = 0.53 and r = 0.28, respectively), the correlation coefficients reported in Table I would be altered moderately and not decrease to zero (with a more pronounced decrement in HHb).
Second‐Level Analyses
Figure 1 shows the results of the second‐level analyses. Under the condition of right finger tapping, the second level analyses for O2Hb revealed six channels (#7, #11, #12, #14, #15, #16) with a significant activation in the first session and four channels in the second session (#7, #11, #15, #16). Regarding HHb, four channels (#7, #11, #12, #15) were significantly activated in the first session and five channels in the second session (#7, #11, #12, #15, #16) during right finger tapping. Left finger tapping led to the detection of five significantly activated channels (#3, #8, #11, #12, #13) in the first session and three activated channels in Session 2 (#3, #8, #12) for O2Hb. The HHb measurement revealed five channels to be significant in Session 1 (#3, #6, #7, #11, #12) and seven channels in Session 2 (#2, #6, #7, #11, #12, #16, #20). As has been shown before [Wolf et al., 2002], the two different fNIRS parameters were not redundant regarding their outcomes. Especially during left finger tapping there are considerable differences between the activation maps of O2Hb and HHb, as can be seen in Figure 1.
Results of the applied ICC analyses are shown in Table II. For both single and average measure ICCs it can be stated that within the ROI reliability is moderate to high (all calculated ICCs are >0.60), but not within the entire probe set (nine of the reported ICCs are <0.60). Therefore, the hemodynamic responses evoked by the motor task seem to be stable over a time period of 3 weeks regarding their amplitudes if a reasonable ROI is defined.
Table II.
Reproducibility of the detected activation expressed with intraclass correlation coefficients (ICC) based on the second level parameter set (beta weights)
| Single channels | Cluster levela | ||||
|---|---|---|---|---|---|
| ICCSINGLE | ICCAVERAGE | ICCSINGLE | ICCAVERAGE | ||
| O2HbOVERALL a | Left | 0.45 (0.03–0.72) | 0.60 (0.05–0.83) | 0.51 | 0.68 |
| Right | 0.46 (0.01–0.81) | 0.60 (0.06–0.89) | 0.58 | 0.73 | |
| HHbOVERALL | Left | 0.37 (0.00–0.80) | 0.51 (0.00–0.89) | 0.80 | 0.89 |
| Right | 0.33 (0.00–0.76) | 46 (0.00–0.87) | 0.43 | 0.61 | |
| O2HbROI b | Left | 0.67 (0.60–76) | 0.80 (0.75–0.86) | 0.70 | 0.83 |
| Right | 0.72 (0.58–0.86) | 0.83 (0.75–0.92) | 0.74 | 0.85 | |
| HHbROI | Left | 0.67 (0.38–0.80) | 0.78 (0.56–0.89) | 0.67 | 0.80 |
| Right | 0.75 (0.72–0.80) | 0.87 (0.84–0.89) | 0.77 | 0.87 | |
Overall = mean of the ICCs from all channels.
ROI = based on channels of the region of interest (compare Fig. 1).
Comparisons of the mean activation magnitudes (beta weights) with paired t‐tests revealed one channel associated with a significant difference (channel #1, t = –2.33, df = 11, P = 0.04) under the condition “tapping right” for O2Hb, one channel (#18, t = 2.41, df = 11, P = 0.03) under the condition “tapping right” for HHb, and one channel (#20, t = 3.10, df = 11, P = 0.01) under the condition “tapping left” for HHb. All the other channels show no significant differences. The number of channels with a significant difference does not exceed the expected number of false alarms by chance if 22 t‐tests for each side and each NIRS parameter were performed. An adequate alpha correction prevents false alarm detections.
The contrast indices (activation vs. baseline) and the effect size parameters are reported in Table III and Table IV. The corresponding effect sizes of the mean differences are reported in Table V. Given that no systematic differences across the measurement session existed, it can be stated for O2Hb that the null hypothesis is likely to be valid and that the nonsignificant intersession mean differences are not resulting from a low statistical power (compare Fig. 2B). For HHb, however, the intersession differences of the amplitudes are more pronounced. With a given sample size of n > 50 and no adequate alpha correction, these amplitude differences could be detected as significant. Interestingly, the largest effect size (d′ = 0.47) was associated with the HHB parameter inside the ROI. A possible explanation could be that HHb is less affected by systemic changes (particularly heart rate changes) leading to locally more focused activation detection [Franceschini et al., 2003]. This would be underpinned by the smaller spatial correlation of the channels associated with HHb (r = 0.28 vs. r = 0.58 in O2Hb) and the more favorable power profile regarding the activation vs. baseline contrast (Fig. 2A). Based on the power profile, a better distinction between activated and nonactivated channels is achieved if HHb is considered. O2Hb changes have to be considered as less distinct regarding the distance of ROI vs. non‐ROI channel effect sizes, which could be a result from superimposed systemic changes [Franceschini et al., 2003; Obrig and Villringer, 2003]. Thus, the power profile of O2Hb serves like a spatial filter across the probe set, alleviating the detection of significant activation across subjects. In opposition to that, the power profile of HHb indicates a more clear‐cut characteristic in the detection of activation. In turn, any differences in the activation amplitudes caused by repositioning the probe set across time is thus more likely to be detected in the HHb data [see also Plichta et al., 2006].
Table III.
Contrast indices (mean and standard deviation) for activation vs. baseline (region of interest, ROI)
| Tapping | O2Hb | HHb | ||
|---|---|---|---|---|
| Session 1 | Session 2 | Session 1 | Session 2 | |
| Right | 0.39 (0.39) | 0.42 (0.47) | 0.18 (0.19) | 0.17 (0.17) |
| Left | 0.39 (0.44) | 0.36 (0.48) | 0.16 (0.18) | 0.19 (0.18) |
Table IV.
Effect size parameters for the activation vs. baseline contrast within and outside the region of interest (ROI)
| Parameter | Tapping | ROI | Non‐ROI |
|---|---|---|---|
| O2Hb | Right | 0.86/1.07 | 0.54/0.58 |
| Left | 1.17/1.07 | 0.70/0.67 | |
| HHb | Right | 1.21/1.20 | 0.10/0.13 |
| Left | 1.14/1.45 | 0.33/0.16 |
First value = measurement session 1; second value = measurement session 2.
Table V.
Effect size parameters d′ for repeated measurements and the corresponding effect size for independent samples (d)
| Parameter | Tapping | OVERALL | ROI | ||
|---|---|---|---|---|---|
| d′ | d | d′ | d | ||
| O2Hb | Right | 0.22 | 0.14 | 0.17 | 0.13 |
| Left | 0.16 | 0.11 | 0.09 | 0.07 | |
| HHb | Right | 0.26 | 0.22 | 0.31 | 0.24 |
| Left | 0.35 | 0.27 | 0.47 | 0.34 | |
ROI, region of interest.
Figure 2.
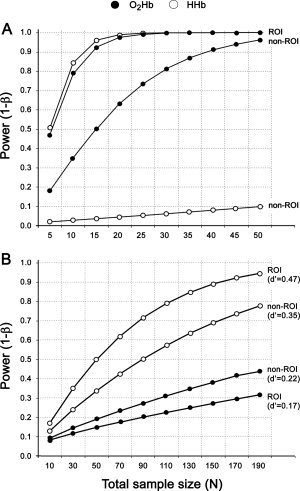
A posteriori power analysis of the activation vs. baseline contrasts for O2Hb and HHb (A). The analyses are separated by channels of the predefined ROI and channels outside the ROI (non‐ROI). Given the sample size of n = 12 both NIRS parameters show sufficient statistical power (power >0.80). Note that the alpha level is corrected. B: The effect sizes for the intersession amplitude differences. Statistical power is plotted vs. total sample size given the upper extreme effect size values at the ROI and the non‐ROI level due to randomly occurring intersession amplitude differences. Note that the power analyses for dependent samples are based on an uncorrected alpha level of 0.05.
Global Comparison (Map‐wise View)
Map‐wise comparison is performed by using linear correlations of the group t‐statistics of both sessions. Figure 3 shows the results for both fNIRS parameters and both conditions. The empirical correlation coefficients for [O2Hb] were 0.80 and 0.89 (the determination coefficients indicate that 64–79% of the variance is explainable by a retest). For the [HHb] the coefficients were 0.86 and 0.75 (indicating that 58–74% is explained by the retest). Regarding the size of the measured activation, 80–89% were reproducible. Slightly smaller values were obtained if the reproducibility of the location of activation is considered (67–89% were reproducible). Compared to the single‐subject level, the indices indicate high reproducibility: 10 of 12 indices are >0.80, whereas the single subjects' indices are all below 0.80 (cf. Table I). The presumed displacement effect of the probe sets, which is hypothesized to alter the reproducibility of the localization at the single‐subject level, is less crucial at the second level: 80–89% (O2Hb) and 67–88% (HHb) of the localization are identical across the two sessions.
Figure 3.
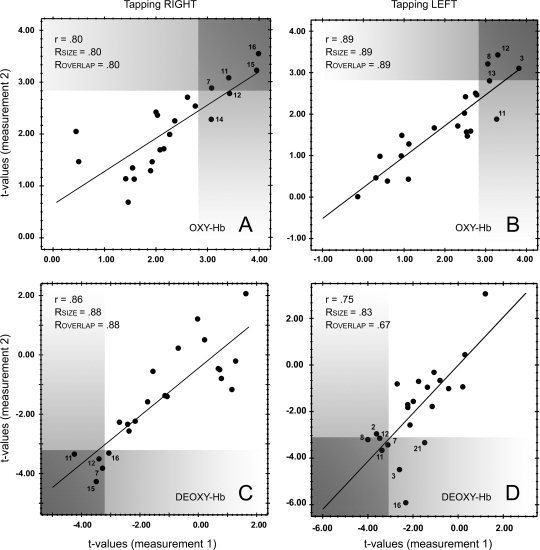
Scatterplots of the t‐values for O2Hb are shown in A (right finger tapping) and B (left finger tapping). Similarly, the HHb data is shown in C (right finger tapping) and D (left finger tapping). The gray shaded areas represent t‐value ranges of statistical significance. Reproducibility indices are shown in the upper left corner of each scatterplot. Channels that exhibit significant activation are labeled with the channel number (compare to Fig. 1 “probe set”).
Limitations of the Present Study
The reproducibility of fNIRS was examined without an anatomical coregistration and/or a (neuro‐)navigational tool. Probabilistic craniocerebral correlations (EEG or anatomical marks) are used for positioning the NIRS sensors over an area of interest, as is common in many fNIRS studies. Clearly, some variance of the data will be unavoidably attributable to the variability of defining the EEG or anatomical mark across two sessions [Sato et al., 2006]. Therefore, it can be argued that the reproducibility may improve (particularly at the single‐subject level) if MRI‐guided techniques [as described in Boas et al., 2004a] or navigational tools [Singh et al., 2005] are applied. Indeed, our conclusions are limited to nonnavigated fNIRS and further studies that examine the reproducibility of MRI‐guided or navigated fNIRS have to be performed. However, since stand‐alone fNIRS is and will be performed on subjects in which fMRI scans are deliberately avoided (e.g., neonates, some forms of psychiatric disorders, auditory and speech paradigms), it is highly relevant to know the extent of its reproducibility and amplitude stability.
Furthermore, the assumption that the signal changes of O2Hb and HHb were located midway between the source and detector can be criticized. Particularly the sophisticated works of Boas et al. [2004a, b] show that a linear reconstruction approach improves the quality of the obtained topographies. However, the problems of 1) positioning the probe set onto identical positions, and 2) the lack of a normalization procedure would remain the same. Additionally, the probe‐set geometry that we used results in nonoverlapping measurements. Overlapping measurements are required for diffuse optical methods to achieve significant improvements of image quality [Boas et al., 2004b]. Therefore, studies have to be conducted that examine the reliability of functional data obtained from the reconstruction approach with overlapping measurements and compare it to the midpoint‐approach.
Finally, the interindividual overlap of the anatomical structures could be very small and no normalization procedure has yet been established, as is commonly performed in fMRI analyses. Consequently, to average the different localizations across subjects leads to “blurred” group hot spots. This could lead to a loss of statistical power. However, the a posteriori power analysis indicated that our sample size was sufficiently large to detect the event‐related brain activation (see Fig. 2A). Also, the validity could be altered because the common practice is to average across and focus on specific channels above an area of interest, even if the individual task‐related activity is localized elsewhere. However, as Singh et al. [2005] reported, the anatomical variance is small near the center of an adequate positioned probe set. Since the craniocerebral correlations of the EEG marks C3/C4 are well described and variation across subjects is relatively low [Okamoto et al., 2004], we regard the problem of validity as minor for the present study.
CONCLUSIONS
fNIRS based on craniocerebral correlations is sensitive to detect significant activation in the contralateral cortex evoked by an event‐related motor task. Results obtained at the single‐subject level suggest that the localization of the probe sets according to anatomical or EEG marks may not be sufficiently exact in case studies. As shown by the reported results, the position of the hot spot is insufficiently reproducible compared to our criterion of 0.80. This, in turn, could lead to a seeming signal change if numerically identical channels are compared across multiple sessions at the single‐subject level. Since the use of large multichannel systems enables monitoring the positional shift of the activation center, a normalization procedure could be developed based on these observations.
At the group level the detected activation is highly reproducible across 3 weeks. Figure 3 and the reported reproducibility indices clearly show that both the size and the localization are sufficiently stable (up to 89% of the size and the localization are reproducible). Furthermore, the comparisons of the average amplitudes with paired t‐tests and the subsequently performed effect size analyses suggest that the group activation is also stable regarding the derived mean values. Effect size analyses in the ROI and outside the ROI revealed distinct statistical power profiles for O2Hb and HHb, indicating locally more specific characteristics of HHb.
Acknowledgements
The authors thank Hitachi Medical Corp. for the ETG‐4000 equipment and skilled technical support, and Inge Gröbner, Melanie Greutner, and Ireen Schaffrath for proficient technical assistance.
Footnotes
The mean spatial correlation among the channels was 0.53 (O2Hb) and 0.28 (HHb). Consequently, the alpha level of 0.05 was adjusted for O2Hb to 0.016 (critical t‐value of 2.85, df = 11) and for HHb to 0.008 (critical t‐value = 3.20, df = 11), respectively.
REFERENCES
- Boas DA, Dale AM, Franceschini MA ( 2004a): Diffuse optical imaging of brain activation: approaches to optimizing image sensitivity, resolution, and accuracy. Neuroimage 23( Suppl 1): S275–288. [DOI] [PubMed] [Google Scholar]
- Boas DA, Chen K, Grebert D, Franceschini MA ( 2004b): Improving the diffuse optical imaging spatial resolution of the cerebral hemodynamic response to brain activation in humans. Opt Lett 29: 1506–1508. [DOI] [PubMed] [Google Scholar]
- Bullmore E, Brammer M, Williams SC, Rabe Hesketh S, Janot N, David A, Mellers J, Howard R, Sham P ( 1996): Statistical methods of estimation and inference for functional MR image analysis. Magn Reson Med 35: 261–277. [DOI] [PubMed] [Google Scholar]
- Charter RA ( 2003): A breakdown of reliability coefficients by test type and reliability method, and the clinical implications of low reliability. J Gen Psychol 130: 290–304. [DOI] [PubMed] [Google Scholar]
- Cochrane D, Orcutt G ( 1949): Application of least squares regression to relationships containing autocorrelated error terms. J Am Stat Assoc 44: 32–61. [Google Scholar]
- Cohen J ( 1969): Statistical power analysis for the behavioral sciences. New York: Academic Press. [Google Scholar]
- Duncan A, Meek JH, Clemence M, Elwell CE, Fallon P, Tyszczuk L, Cope M, Delpy DT ( 1996): Measurement of cranial optical path length as a function of age using phase resolved near infrared spectroscopy. Pediatr Res 39: 889–894. [DOI] [PubMed] [Google Scholar]
- Ehlis AC, Herrmann MJ, Wagener A, Fallgatter AJ ( 2005): Multi‐channel near‐infrared spectroscopy detects specific inferior‐frontal activation during incongruent Stroop trials. Biol Psychol 69: 315–331. [DOI] [PubMed] [Google Scholar]
- Fallgatter AJ, Strik WK ( 1998): Frontal brain activation during the Wisconsin Card Sorting Test assessed with two‐channel near‐infrared spectroscopy. Eur Arch Psychiatry Clin Neurosci 248: 245–249. [DOI] [PubMed] [Google Scholar]
- Franceschini MA, Fantini S, Thompson JH, Culver JP, Boas DA ( 2003): Hemodynamic evoked response of the sensorimotor cortex measured noninvasively with near‐infrared optical imaging. Psychophysiology 40: 548–560. [DOI] [PMC free article] [PubMed] [Google Scholar]
- Fujiwara N, Sakatani K, Katayama Y, Murata Y, Hoshino T, Fukaya C, Yamamoto T ( 2004): Evoked‐cerebral blood oxygenation changes in false‐negative activations in BOLD contrast functional MRI of patients with brain tumors. Neuroimage 21: 1464–1471. [DOI] [PubMed] [Google Scholar]
- Herrmann MJ, Plichta MM, Ehlis AC, Fallgatter AJ ( 2005): Optical topography during a Go‐NoGo task assessed with multi‐channel near‐infrared spectroscopy. Behav Brain Res 160: 135–140. [DOI] [PubMed] [Google Scholar]
- Horovitz SG, Gore JC ( 2004): Simultaneous event‐related potential and near‐infrared spectroscopic studies of semantic processing. Hum Brain Mapp 22: 110–115. [DOI] [PMC free article] [PubMed] [Google Scholar]
- Hoshi Y ( 2003): Functional near‐infrared optical imaging: utility and limitations in human brain mapping. Psychophysiology 40: 511–520. [DOI] [PubMed] [Google Scholar]
- Kennan RP, Horovitz SG, Maki A, Yamashita Y, Koizumi H, Gore JC ( 2002): Simultaneous recording of event‐related auditory oddball response using transcranial near infrared optical topography and surface EEG. Neuroimage 16: 587–592. [DOI] [PubMed] [Google Scholar]
- Kusaka T, Kawada K, Okubo K, Nagano K, Namba M, Okada H, Imai T, Isobe K, Itoh S ( 2004): Noninvasive optical imaging in the visual cortex in young infants. Hum Brain Mapp 22: 122–132. [DOI] [PMC free article] [PubMed] [Google Scholar]
- Logothetis NK, Wandell BA ( 2004): Interpreting the BOLD signal. Annu Rev Physiol 66: 735–769. [DOI] [PubMed] [Google Scholar]
- Marchini JL, Smith SM ( 2003): On bias in the estimation of autocorrelations for fMRI voxel time‐series analysis. Neuroimage 18: 83–90. [DOI] [PubMed] [Google Scholar]
- Matsuo K, Onodera Y, Hamamoto T, Muraki K, Kato N, Kato T ( 2005): Hypofrontality and microvascular dysregulation in remitted late‐onset depression assessed by functional near‐infrared spectroscopy. Neuroimage 26: 234–242. [DOI] [PubMed] [Google Scholar]
- Obrig H, Villringer A ( 2003): Beyond the visible—imaging the human brain with light. J Cereb Blood Flow Metab 23: 1–18. [DOI] [PubMed] [Google Scholar]
- Okamoto M, Dan H, Sakamoto K, Takeo K, Shimizu K, Kohno S, Oda I, Isobe S, Suzuki T, Kohyama K, et al. ( 2004): Three‐dimensional probabilistic anatomical cranio‐cerebral correlation via the international 10–20 system oriented for transcranial functional brain mapping. Neuroimage 21: 99–111. [DOI] [PubMed] [Google Scholar]
- Plichta MM, Herrmann MJ, Baehne CG, Ehlis AC, Richter MM, Pauli P, Fallgatter AJ ( 2006): Event‐related functional near‐infrared spectroscopy (fNIRS): are the measurements reliable? Neuroimage 31: 116–124. [DOI] [PubMed] [Google Scholar]
- Rombouts SA, Barkhof F, Hoogenraad FG, Sprenger M, Valk J, Scheltens P ( 1997): Test‐retest analysis with functional MR of the activated area in the human visual cortex. AJNR Am J Neuroradiol 18: 1317–1322. [PMC free article] [PubMed] [Google Scholar]
- Safonova LP, Michalos A, Wolf U, Wolf M, Hueber DM, Choi JH, Gupta R, Polzonetti C, Mantulin WW, Gratton E ( 2004): Age‐correlated changes in cerebral hemodynamics assessed by near‐infrared spectroscopy. Arch Gerontol Geriatr 39: 207–225. [DOI] [PubMed] [Google Scholar]
- Sankoh AJ, Huque MF, Dubey SD ( 1997): Some comments on frequently used multiple endpoint adjustment methods in clinical trials. Stat Med 16: 2529–2542. [DOI] [PubMed] [Google Scholar]
- Sato H, Kiguchi M, Maki A, Fuchino Y, Obata A, Yoro T, Koizumi H ( 2006): Within‐subject reproducibility of near‐infrared spectroscopy signals in sensorimotor activation after 6 months. J Biomed Opt 11: 014021. [DOI] [PubMed] [Google Scholar]
- Schroeter ML, Zysset S, Kupka T, Kruggel F, Yves von Cramon DY ( 2002): Near‐infrared spectroscopy can detect brain activity during a color‐word matching Stroop task in an event‐related design. Hum Brain Mapp 17: 61–71. [DOI] [PMC free article] [PubMed] [Google Scholar]
- Schroeter ML, Zysset S, Yves von Cramon DY ( 2004a): Shortening intertrial intervals in event‐related cognitive studies with near‐infrared spectroscopy. Neuroimage 22: 341–346. [DOI] [PubMed] [Google Scholar]
- Schroeter ML, Bucheler MM, Muller K, Uludag K, Obrig H, Lohmann G, Tittgemeyer M, Villringer A, von Cramon DY ( 2004b): Towards a standard analysis for functional near‐infrared imaging. Neuroimage 21: 283–290. [DOI] [PubMed] [Google Scholar]
- Shimada S, Hiraki K, Oda I ( 2005): The parietal role in the sense of self‐ownership with temporal discrepancy between visual and proprioceptive feedbacks. Neuroimage 24: 1225–1232. [DOI] [PubMed] [Google Scholar]
- Singh AK, Okamoto M, Dan H, Jurcak V, Dan I ( 2005): Spatial registration of multichannel multi‐subject fNIRS data to MNI space without MRI. Neuroimage 27: 842–851. [DOI] [PubMed] [Google Scholar]
- Watanabe A, Matsuo K, Kato N, Kato T ( 2003): Cerebrovascular response to cognitive tasks and hyperventilation measured by multi‐channel near‐infrared spectroscopy. J Neuropsychiatry Clin Neurosci 15: 442–449. [DOI] [PubMed] [Google Scholar]
- Weber P, Lutschg J, Fahnenstich H ( 2005): Cerebral hemodynamic changes in response to an executive function task in children with attention‐deficit hyperactivity disorder measured by near‐infrared spectroscopy. J Dev Behav Pediatr 26: 105–111. [DOI] [PubMed] [Google Scholar]
- Wolf M, Wolf U, Toronov V, Michalos A, Paunescu LA, Choi JH, Gratton E ( 2002): Different time evolution of oxyhemoglobin and deoxyhemoglobin concentration changes in the visual and motor cortices during functional stimulation: a near‐infrared spectroscopy study. Neuroimage 16: 704–712. [DOI] [PubMed] [Google Scholar]