

Abstract
The purpose of the study was to assess the relationship between the P3a/P3b brain potentials, cortical thickness, and cognitive function in aging. Thirty‐five younger and 37 older healthy participants completed a visual three‐stimuli oddball ERP (event‐related potential)‐paradigm, a battery of neuropsychological tests, and MRI scans. Groups with short vs. long latency, and low vs. high amplitude, were compared on a point by point basis across the entire cortical mantle. In the young, thickness was only weakly related to P3. In the elderly, P3a amplitude effects were found in parietal areas, the temporoparietal junction, and parts of the posterior cingulate cortex. P3b latency was especially related to cortical thickness in large frontal regions. Path models with the whole sample pooled together were constructed, demonstrating that cortical thickness in the temporoparietal cortex predicted P3a amplitude, which in turn predicted executive function, and that thickness in orbitofrontal cortex predicted P3b latency, which in turn predicted fluid function. When age was included in the model, the relationship between P3 and cognitive function vanished, while the relationship between regional cortical thickness and P3 remained. It is concluded that thickness in specific cortical areas correlates with scalp recorded P3a/P3b in elderly, and that these relationships differentially mediate higher cognitive function. Hum Brain Mapp 2007. © 2007 Wiley‐Liss, Inc.
Keywords: cortical thickness, MR morphometry, ERP, P3a, P3b, neuropsychology, cognition, aging
INTRODUCTION
Event‐related potentials (ERPs) enable measurement of cerebral neural activity with a temporal resolution approximating the speed of mental processes. However, we have limited knowledge of the interplay among ERPs, brain volumetry, and cognitive function. The purpose of the present study was to investigate the relationship between the ERP components P3a/P3b and cortical thickness, and to test specific hypotheses about how P3a/P3b–cortical thickness relationships mediate executive and fluid cognitive function. This was done with an adult life‐span sample.
P300 (P3a/P3b)
The P300, or its subcomponents P3a and P3b, is arguably the most studied ERP component. The traditional P300, the P3b, is a positive‐going potential with parietal maximum amplitude, and a peak latency of about 300–600 ms in young adults. P3b is typically elicited in tasks wherein two types of stimuli of unequal probability are presented, and attention is to be paid to the infrequent ones. P3b latency is often regarded as a measure of the relative timing of the stimulus evaluation process (Coles and Rugg, 1995), and P3b amplitude is held to index resource allocation (Polich, 1996). In addition to the P3b, a P3a can be recorded to deviant nontarget stimuli (a distractor). In the novelty‐paradigm, the distractors are different novel patterns that are not repeated (Courchesne et al., 1975), while in the three‐stimulus paradigm, a third, infrequent type of highly deviant stimulus is inserted into the sequence of target and standard stimuli (Squires et al., 1975). The distractor stimulus has been found to elicit a P3a with maximum amplitude over the central/parietal rather than frontal/central areas (Courchesne, 1978; Courchesne et al., 1978), and the component has also been termed a “no‐go” P300 (Pfefferbaum et al., 1985). Such a paradigm produces P3a potentials similar to those obtained by using novel stimuli (Simons et al., 2001). Agreement has not been reached on the exact nature of the neurocognitive processes underlying the component, but it can be argued that P3a reflects involuntary, transient allocation of attention to salient stimuli changes and novel stimuli (Courchesne et al., 1975). P3a and P3b have been found to correlate with aging (Fjell and Walhovd, 2004; Polich, 1996) and cognitive function (Bazana and Stelmack, 2002; Fjell and Walhovd, 2001; Jausovec and Jausovec, 2000; McGarry‐Roberts et al., 1992; O'Donnell et al., 1992; Walhovd and Fjell, 2001, 2002; Walhovd et al., 2005a). In the following, P3a will refer to the activity related to the distractor/novel stimulus, P3b will refer to the activity related to the target, and P300 will be used for simplicity when aspects not specifically related to P3a or P3b are discussed.
Electrogenesis of P3a/P3b
By depth electrode studies, lesion studies, and source localization studies in combination with functional imaging techniques, it has been established that P3a and P3b are supported by widely distributed neural networks (for reviews, see Linden, 2005; Polich, 2003a). Linden (2005) argued that previous research on the neural generation of the P300 is partly conflicting, and that one should demand converging evidence about localization from at least two techniques to consider a brain region as a P300 generator. Following this criterion, Linden suggested that strong evidence exists that the following regions are involved in P3a generation: lateral prefrontal cortex, inferior parietal lobule/temporoparietal junction, and medial temporal lobe structures. Linden stated that there is somewhat weaker evidence for involvement of inferior frontal gyrus/insula and anterior cingulate cortex in P3a generation. For P3b, strong evidence exists for involvement of posterior cingulate cortex/superior parietal lobule, inferior parietal lobule/temporoparietal junction, inferior frontal gyrus/insula, and anterior cingulate cortex, while there is more limited evidence for medial temporal lobe involvement. Thus, there seems to be some overlap between localization of P3a and P3b generators, and also some generator areas unique to each component. For instance, Knight (1996) observed reduced amplitudes to novel task‐irrelevant stimuli (P3a), but not to target stimuli (P3b), in patients with unilateral damage to the posterior hippocampus. Further, prefrontal lesions have been found to have profound impact on P3a, but not affect P3b (Daffner et al., 2003; Knight, 1984, 1997). Lesions in the temporoparietal junction seem to affect the P3a across modalities (Knight and Scabini, 1998), while for P3b, this effect is larger for auditory stimuli than for visual ones (Verleger et al., 1994).
Results from functional Magnetic Resonance Imaging have yielded useful supplementary information about P300 generators. These studies show that even though P3b often is spared in patients with frontal lesions, frontal areas are often activated in target detection tasks, e.g. anterior cingulate gyrus (Kiehl et al., 2001a, b), insular cortex (Linden et al., 1999), middle frontal gyrus (Clark et al., 2000; Kiehl et al., 2001a, b; Kirino et al., 2000), and inferior frontal gyrus (Kiehl et al., 2001a, b). Bledowski et al. (2004) used a paradigm resembling the one in the present study in a combined ERP and fMRI experiment. It was found that distractor stimuli increased the activity in large parietal areas in both hemispheres, i.e. postcentral gyrus and superior parietal gyrus, and in especially left lateral prefrontal areas (the middle frontal gyrus). For targets, insular, temporoparietal, and parietal activations were found.
Polich (2003a) tried to incorporate recent findings on the different neural systems responsible for P300 generation, and suggests that P300 is produced by interactions between frontal lobe and hippocampal/temporal–parietal processes. He argues that P3a is related to activity in the anterior cingulate when working memory content is replaced by incoming stimuli, and communication of this representational change is transmitted to stimulus maintenance mechanisms in inferotemporal areas. P3b, on the other hand, reflects the operation of memory storage operations that are then initiated in the hippocampal formation, and the updated output transmitted to parietal cortical areas.
So far, most efforts have focused on localizing P300 generators. However, in a recent study, Cardenas et al. (2005) found that white matter (WM) volume was more related to the scalp‐recorded ERPs, especially P3b latency, than was the grey matter volumes. They concluded that the connections between the P3 generators seemed to matter more for the scalp‐recorded potentials than the size of the generators themselves. This result warrants a closer look also on WM effects on ERPs.
Neuroanatomical Volumetry, Cognition, and P300
Positive correlations between general cognitive abilities and gross measures of brain volume have been established (Deary and Caryl, 1997; Wicket et al., 2000). However, studies relating cortical thickness or volume to specific cognitive variables have been inconsistent (see, e.g., van Petten, 2004; van Petten et al., 2004). Still, recent results indicate that positive relationships do exist. For instance, Schretlen et al. (2000) found correlations between frontal lobe volume and fluid abilities in aging, while Fjell et al. (2006) demonstrated that elderly with high fluid abilities had thicker posterior cingulate than those with average fluid abilities. Such a positive relationship between cortical thickness and cognitive performance may be caused by a larger number of neurons or synaptic connections in thicker brains (Pakkenberg and Gundersen, 1997), which may benefit cognitive processing. The same reasoning can be applied to hypothesize a relationship between P300 and thickness: a thicker cortex may be able to process information in a faster and more efficient way because of a larger number of neurons and possibly synaptic connections, generating large and fast scalp‐recorded potentials. This general view is further supported by moderate correlations between P300 and cognitive functions, even though some discrepant results have been reported (e.g. Houlihan et al., 1998). P300 are largely generated in the cerebral cortex, and may therefore have the potential to detect subtle changes in regional cortical thickness. Thus, it is an important question whether ERPs may be more sensitive to thickness differences than behavioral cognitive or psychometric tests.
A few earlier studies have correlated volumetric brain measures with ERPs, but only with rather gross classifications of different structures and usually small samples. Ford et al. (1994) found correlations between auditory P3a and P3b and cortical volume in an age‐heterogeneous (21–60 years) male sample. The regional correlations (frontal, parietal, temporal lobes) showed that frontal lobe gray matter was significantly related to P3a amplitude, while parietal lobe volume was significantly related to P3b amplitude. These relationships were, however, attenuated when age was included in the regressions. Egan et al. (1994) used a total gray matter volume estimate in a sample of young, but did not find any significant correlations between gray or WM volume and the amplitude of the auditory P300. The discrepancies between this study and that of Ford et al. (1994) may be explained by a larger age‐range in the latter. Also, two previous studies with samples overlapping the present one have been published. Walhovd et al. (2005a) found that P3a latency was related to total cortical volume and fluid intelligence. Fjell and Walhovd (2005) found that both P3a and P3b topographical shifts with high age were related to the thickness of specific areas of the cerebral cortex.
Rationale for the Present Study
The present study is targeted at the relationship between P3a, P3b, neuroanatomical volume, and cognitive function across the adult life span. The general assumption is that cortical thickness in specific regions would predict P3a and P3b, which again would predict cognitive function. Based on results from the above‐reviewed literature on P300 generation, especially the review of Linden (2005) and the fMRI study of Bledowski et al. (2004), it is predicted that P3a is related to volumetric characteristics of the temporoparietal area, postcentral gyrus and superior parietal gyrus, left middle frontal gyrus, and hippocampus, and possibly to inferior frontal gyrus and anterior cingulate cortex. P3b is assumed to be related to volumetric characteristics of the posterior cingulate, inferior frontal gyrus and the insula, and anterior cingulate cortex. Generally, we expect positive amplitude–thickness correlations, and negative latency–thickness correlations. With regard to cognition, we expect P3a to be more related to executive cognitive function than general, fluid abilities, and the opposite to be true for P3b. Since we expect individual differences to be larger in older than in younger participants (e.g. Schaie, 1994), the relationships between P3 and cortical thickness may be stronger in groups of elderly.
MATERIALS AND METHODS
Sample
Table I summarizes the characteristics of the total sample and the sample split by the median age into two age groups. The sample consisted of 72 volunteers (40 F/32 M) between 20 and 88 years. Participants were recruited from a local hospital, or through charity organizations, activity centers for the elderly, and newspaper advertisements. They were required to have normal or corrected to normal vision and feel healthy to enter the study and were screened by interview for diseases and traumas known to affect CNS‐functioning. Criteria for exclusion were neurological conditions or use of medication known to influence central nervous system functioning. Participants were given a moderate sum of money to refund possible costs related to their participation. The Beck Depression Inventory (BDI; Beck and Steer, 1987) was used, but included at a later stage, and so we only have BDI data for 66 of the participants. Participants had to achieve a score <15 on the BDI to be included. All 72 participants were examined with the Norwegian version of the Wechsler Abbreviated Scale of Intelligence (WASI; Wechsler, 1999) and the Mini Mental State Examination (MMSE; Folstein et al., 1975), and participants had to achieve an IQ score of minimum 85 and a MMSE score of minimum 26 to be included.
Table I.
Sample characteristics
| Young (n = 35) | Elderly (n = 37) | Total (n = 72) | ||||
|---|---|---|---|---|---|---|
| M | SD | M | SD | M | SD | |
| Age | 33.7 | 11.4 | 69.5 | 8.1 | 52.1 | 20.5 |
| Education | 15.8 | 2.4 | 14.6 | 3.0 | 15.2 | 2.8 |
| IQ | 114.2 | 8.3 | 113.3 | 12.2 | 113.8 | 10.3 |
| Beck DI | 2.1 | 2.6 | 6.0 | 3.3 | 4.2 | 3.5 |
| MMS | 29.1 | 0.8 | 28.6 | 1.1 | 28.8 | 1.0 |
For the Beck Depression Inventory (Beck DI), we have data from only 66 of the 72 participants. t‐test showed that no significant differences between the groups existed for education (t = 1.862, n.s.) and IQ (t = 0.338, n.s.), while significant differences in mean score of MMS (t = 2.473, P < 0.05) and Beck DI (t = −5.13, P < 0.05) existed between the two age groups (the latter probably have to do with elevated scores for somatic complaints in the elderly).
Several papers have been published with samples overlapping with the present one. None of these have reported data on cortical thickness in relation to P300 amplitude or latency. Walhovd et al. (2005a) correlated a gross measure of total cortical volume with P3a latency, Fjell et al. (2006) tested the relationship between the frontal shift of the P300 in aging and cortical thickness, and Walhovd et al. (2005b, c) correlated hippocampal, cortical, and WM volume with age.
ERP Task and Recording Procedures
A three‐stimuli visual oddball task with a total of 210 stimuli, 0.10 target and 0.10 distractor probability, was used. The task is a variation of the one used by Comerchero and Polich (1999), shown to elicit both P3a and P3b (Polich, 2003b). In the present task, the standard stimuli are blue elliptic shapes with a height of 15 cm and a width of 12.5 cm. The targets, to which the participant is told to press a button, are blue elliptic shapes with height and width of 17.5 and 14.5 cm, respectively. The distractor stimuli, which the participant is told to ignore, are blue rectangles of 21 × 17 cm2. Viewing distance was 100 cm. The stimuli were presented on a 21‐in. computer screen with a black background color, with a visual field of about 9° × 7°, 10° × 8°, and 12° × 10° for the standard, target, and distractor stimuli, respectively. The small difference between targets and standards, and the large difference between targets and distractors, were chosen to maximize the P3a (Comerchero and Polich, 1999). Presentation time was 0.5 s and ISI was 1.5 s. Cut‐off criteria for task performance were set to 20% target misses, 20% responses to standards, or 25% responses to distractors. Before recording, an example task with 11 standard and target stimuli was presented to prime the participants for the task and to ascertain that all could discriminate targets from standards.
The task was administered while the participants sat in a reclining chair within a sound attenuating recording chamber. The electrodes were placed in accordance with the international 10–20 system. A total of 20 electrodes (Ag/AgCl) were used for recording: Fp1, Fp2, F7, F3, Fz, F8, F4, T3, C3, Cz, C4, T4, T5, P3, Pz, P4, T6, O1, Oz, and O2, referred to the left mastoide. A VEOG channel was obtained by placing one electrode above and one below the left eye, and ground was placed anteriorly on the right side. Interelectrode impedance was generally measured to be less than 10 kΩ. For the recording of EEG activity, A/D rate was 500 Hz, and filter setting was 0.10 Hz (high pass) and 70 Hz (low pass). In addition, a 50‐Hz notch filter was applied. The signals were amplified by a SynAmp DC amplifier (Neuroscan). Epochs were rejected from averaging if amplitude exceeded ±75 μV, and eye blinks were corrected for statistically in accordance with the recommendations of Semlitsch et al. (1986). Averaging was performed for targets and distractors separately. EEG was segmented in epochs of 900 ms duration (−100 to 800 ms relative to stimulus onset). All data average files were digitally filtered (15 Hz low pass) and baseline corrected before statistical measures of component latency or amplitude were made. Neuroscan software was used to present stimuli, record, and analyze EEG‐activity. EEG‐lab was used for graphic display of scalp voltage maps (Delorme and Makeig, 2004). P300 peaks were determined algorithmically, in accordance with Pfefferbaum et al.'s (1990) recommendations, defined as the most positive point constituting a peak within 250 and 650 ms poststimulus. Statistical analyses were done with Pz for target stimuli and Cz for distractor stimuli.
MRI Scanning and Volumetric Analyses
A Siemens Symphony Quantum 1.5 T MR scanner with a conventional head coil was used. The pulse sequences used for morphometric analysis were as follows: Two 3D magnetization prepared gradient echo (MP‐RAGE), T1‐weighted sequences in succession (TR/TE/TI/FA = 2730 ms/4 ms/1000 ms/7 deg, matrix = 192 × 256, FOV = 256 mm), with a scan time of 8.5 min per volume. Each volume consisted of 128 sagittal slices with a slice thickness of 1.33 mm, and in‐plane pixel size of 1 mm × 1 mm. The image files in DICOM format were transferred to a Linux workstation for morphometric analysis.
The automated procedures for volumetric measures of the different brain structures are described by Fischl et al. (2002). This procedure automatically assigns a neuroanatomical label to each voxel in an MRI volume based on probabilistic information automatically estimated from a manually labeled training set (Caviness et al., 1989; Goldstein et al., 1999; Kennedy et al., 1989; Seidman et al., 1999). The MR images were further used to calculate the thickness of the cerebral cortex throughout the cortical mantle (Dale et al., 1993; Dale and Sereno, 1999; Fischl and Dale, 2000; Fischl et al., 1999a, b, 2001), using validated automated procedures (Kuperberg et al., 2003; Rosas et al., 2002; Salat et al., 2004). The maps produced are not restricted to the voxel resolution of the original data and are capable of detecting submillimeter differences between groups (Fischl and Dale, 2000). Maps were smoothed using a circularly symmetric Gaussian kernel across the surface with a standard deviation (SD) of 12.6 mm and averaged across participants using a nonrigid highdimensional spherical averaging method to align cortical folding patterns (Fischl et al., 1999a, b).
Neuropsychological Tests
The frontal lobes, and circuits involving parts of the frontal cortex, support a number of human higher‐order cognitive functions, including regulation of behavior and cognition, response monitoring and inhibition, and working memory and attention (e.g. Balota et al., 2000; Damasio, 1994; Luria, 1980; West and Baylis, 1998), said to constitute executive functions. Evidence for the frontal basis of these abilities comes from behavioral patient studies (Bryan and Luszcz, 2000; Stuss et al., 2001) and brain imaging studies (Bush et al., 2000; Chao and Knight, 1997). In the present study, a battery of five tests related to executive function (Stroop, TMT, COWAT, Digit span backward, and Corsi Block tapping Test) was employed for analyses, in addition to two tests of fluid cognitive function (matrix reasoning and block design from WASI; Wechsler, 1999). The tests are well‐validated neuropsychological instruments, described in depth elsewhere, e.g. Lezak (1995) and Spreen and Strauss (1991). A brief description is provided in Table II.
Table II.
Description of the neuropsychological tests used
| Test | Brief description |
|---|---|
| Fluid function/performance ability | |
| Block design | Copying small geometric designs with four or nine plastic cubes while viewing a constructed model or a picture within a specified time limit |
| Matrix reasoning | The participant is required to complete logical arrangements of designs with missing parts; multiple‐choice |
| Executive function | |
| Stroop | The participant is required to name the ink color of rows of circles (Condition 1), to read color words (Condition 2), or (Condition 3) name the ink of words that are color‐incongruent (e.g. the word blue printed in yellow ink). Performance on the Stroop test is linked to function of the prefrontal cortex |
| TMT | TMT‐A consists of consecutively numbered circles arranged randomly on a sheet of paper, and the participant is required to draw a line between the circles in ascending order as quickly as possible. In TMT‐B half the numbers are replaced with letters and the task is to connect each number with a letter and each letter with a number (1‐A‐2‐B‐3‐C, etc.). TMT‐B is considered a measure of the ability to flexibly shift the course of an ongoing activity |
| Digit span backward | The participant is required to mentally reverse an orally presented string of digits. This involves double tracking in that both the memory and the reversing operations must proceed simultaneously. Performance depends upon working memory and cognitive regulation and manipulation to a stronger degree than in the forward span task |
| CBTT | Nine black 1½‐in. cubes are fastened in a random order to a black surface, and the participant is required to repeat a tapping pattern tapped by the examiner (tests nonverbal short‐term memory) |
| COWAT | A measure of a person's ability to make verbal associations to specified letters (here: F, A, and S) within a time limit of 1 min per letter. COWAT is regarded a measure of executive function, since frontal lesions generally result in reduced scores, and the task tends to involve bilateral frontal and temporal lobe activation |
TMT, Trail Making Test; CBTT, Corsi Block Tapping Test; COWAT, Controlled Word Association test; Block design and matrix reasoning are taken from Wechsler Abbreviated Scale of Intelligence (WASI). Digit span backward is taken from Wechsler Adult Intelligence Scale, Revised.
For Stroop 3 and TMT B, the influence from the simple conditions (Stroop1, TMT A) was regressed out, and all analyses were performed on the residuals, removing the effect of lower‐order cognitive functions such as motor speed, visual search, and color naming. Each participant's score on the five executive tests were then converted to z‐scores (mean of 0, SD of 1) based on the mean and the SD of the sample (i.e. not age‐corrected), and a composite score was calculated as the mean of the z‐scores. Inter‐item reliability analysis of the five measures yielded a Cronbach's α of 0.61, indicating substantial overlap, but also nonshared variance between the different variables. Since exclusion of any of the variables would not have lead to an increase in the α, all were included. This composite score will be referred to as “executive function.” Following the same procedure, a composite score based on the two WASI performance subtests (block design, matrix reasoning) was calculated, and this will be referred to as “fluid function.”
Statistical Analyses
ANOVA with two components (P3a, P3b) × 3 electrodes (Fz, Cz, Pz) were computed to test whether the topography of the P3a and the P3b components was different. To test the main effects of age on P300 amplitude and latency, interaction effects of age × electrode on amplitude, and to confirm that the amplitude and latency groups really were significantly different, four separate ANOVAs with two age groups (young, old) × 2 P3a/P3b amplitude/latency groups (low/short, high/long) × 3 electrodes (Fz, Cz, Pz) were computed. To test the relationship between P300 and cortical thickness, General Linear Models contrasting cortical thickness of participants with short vs. long latency, and participants with high vs. low amplitude, were constructed. These analyses were done within each age group separately, since age is assumed to correlate with all variables of interest, and the variance thus is very hard to assign. Corresponding P‐value maps were projected onto template brains for inspection of results. After these GLMs, mean thickness in two selected regions showing high correlations with P300 were calculated and entered into further ANOVA statistics and path analysis. Univariate ANOVAs were computed to test the relationship between selected morphometric variables (cortical thickness, hippocampal volume, WM volume), age group, and P300 latency/amplitude group. Finally, path analysis was used to test how neuroanatomy, P300, and cognitive function relate to each other. Path analysis is an extension of the regression model, which is used to decompose correlations for interpretation of effects, or to test the fit of the correlation matrix against causal models that are being compared. Regression weights predicted by the models are compared with the observed correlation matrix for the variables, and goodness‐of‐fit can be estimated. Specific models were designed and tested, and the content of the models were chosen based on previous research, theoretical knowledge, and the results from the previously computed GLMs and ANOVAs. Neuroanatomy was treated as the most basic level of causation, giving rise to electrophysiological activity that can be measured on the scalp. We further assumed that ERPs are more basic than cognition as observed behaviorally, i.e. the former may be involved in a causal mechanism for the latter. The first model included P3a amplitude, P3b latency, thickness in two cortical regions of interests, fluid and executive function. The second model included age as the only exogenous variable, while the third model was obtained by removing nonsignificant paths from Model 2 (see Results section for schematic overviews).
RESULTS
Sample Characteristics
First, the sample was split into halves by age. The rational for this was that age presumably is related to all variables of interest, and that this shared variance could introduce spurious relationships. Regressing out the effects of age is not an ideal solution in a life‐span sample, since the increased uncertainty may mask true effects. By splitting the sample in two age groups, the age variance within each group was greatly reduced, allowing us to study the relationships between the variables of interest. Each age group was further divided based on median splits of P3a/P3b latency and amplitude. Thus, all participants were either in the low or the high P3a amplitude group, and either in the short or long P3a latency group, and the same was done with regard to P3b. Latency and amplitude correlated −0.46 (P < 0.01) and −0.31 (n.s.) in the elderly group for P3a and P3b, respectively, and −0.01 and −0.17 (n.s.) in the young group. The different groups of participants were tested for differences in age or neuropsychological function by paired‐samples t‐tests. All showed nonsignificant results (P > 0.05), with the exception of the elderly amplitude groups, wherein the high amplitude group had a lower mean age (67.1 vs. 72.4, t = −2.111, df = 35, P = 0.042).
Behavioral Results
For the total sample, mean reaction time after cut‐off criteria were applied was 515 ms, mean rate of target hits was 96%, distractor responses (false alarms) 2.2%, and standard responses (false alarms) 1.1%, confirming that the participants were able to conduct the task as requested. t‐tests revealed that elderly participants had significantly more responses to standard (0.4 vs. 3.17 ms, t [53.00] = −2.51, P < 0.05) and distractor (0.17 vs. 0.69, t [36.40] = −2.54, P < 0.05) than younger ones. This was the only difference between the elderly and the young group. For the latency and amplitude groups, the young short‐latency P3b group had significantly shorter reaction times than did the long‐latency group (482 vs. 547 ms, t [33] = −2.74, P < 0.05). This was the only behavioral difference between the same‐age ERP groups.
Effects of Stimulus, Age, and Groups on P3a/P3b
Figure 1 shows the grand average ERP waveforms for the young and the elderly part of the sample, across the midline electrodes (Fz, Cz, Pz) and components (P3a, P3b). Figure 2 presents the grand average ERP waveforms split by the median amplitude or latency for Cz (P3a) and Pz (P3b). Table III shows the mean latency and amplitude values for the groups for P3a and P3b, and Figure 3 plots the single data points. In Figure 4, scalp voltage maps for the time point with largest topographic variance (that is, the epoch latency with maximum variance in the ERP), projected onto a semirealistic head model, are shown.
Figure 1.
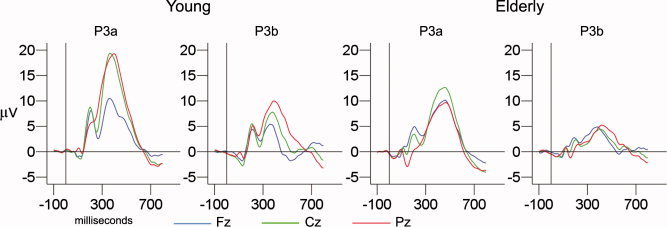
Grand average ERP curves for old and young. Grand average curves at the central electrodes (Fz, Cz, Pz), divided by age group (young: mean of 36 years; elderly: mean of 71 years) and component (P3a and P3b). Vertical reference lines indicate stimulus onset time (0 ms), and horizontal reference lines show baseline (0 μV).
Figure 2.
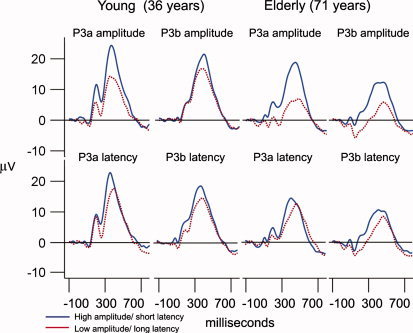
Grand average ERP curves for each latency/amplitude group. Grand average curves for the young and the elderly part of the sample, divided by median splits into groups with short (blue) vs. long (red) latency, and groups with high (blue) vs. low amplitude (red). P3a is measured at Cz, while P3b is measured at Pz.
Table III.
Mean P3a (at Cz) and P3b (at Pz) latency and amplitude values for the young and elderly groups of slow vs. fast latency and low vs. high amplitude
| Young | Old | |||||
|---|---|---|---|---|---|---|
| Slow/low | Fast/high | Diff/SD | Slow/low | Fast/high | Diff/SD | |
| P3a | ||||||
| Latency (ms) | 418 (29) | 352 (21) | 1.6 | 482 (28) | 416 (27) | 0.8 |
| Amplitude (μV) | 14.15 (4.78) | 27.77 (5.80) | 1.6 | 8.95 (2.87) | 20.06 (4.38) | 1.4 |
| P3b | ||||||
| Latency (ms) | 436 (43) | 346 (25) | 1.6 | 520 (59) | 385 (39) | 3.1 |
| Amplitude (μV) | 7.11 (3.54) | 16.44 (5.79) | 1.4 | 3.19 (3.41) | 12.32 (5.99) | 1.4 |
All same‐age group differences are statistically significant (P < 0.0001). Standard deviations are presented in parentheses. Diff/SD represents the difference between the slow/low and the fast/high groups, divided by the standard deviation of the groups combined (separately for the elderly and the young part of the sample), yielding an index of the difference between the groups.
Figure 3.
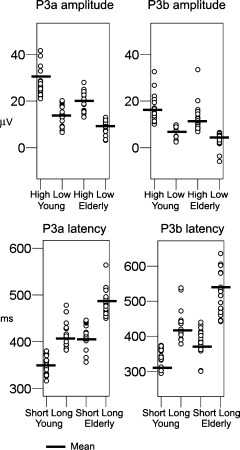
Individual data points in each group. Scatters showing the individual data points in each of the groups of participants, with the mean group value displayed.
Figure 4.
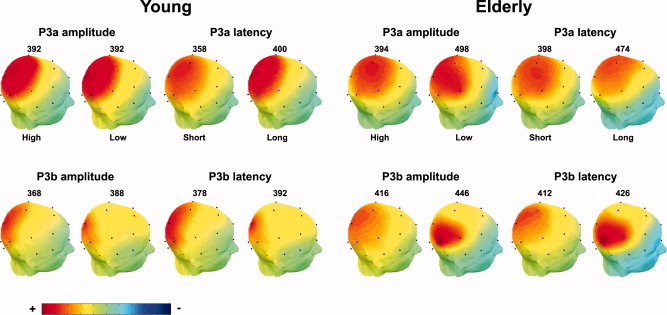
Scalp voltage maps for P3a and P3b for each of the different groups of participants, projected onto semirealistic head models. The activity is shown at the time point yielding the largest topographical variance (that is, the epoch latency with maximum variance in the ERP) for each particular group and each particular component. The latency of this time point is indicated in milliseconds above each image. The color bar scale represents the amplitude (in microvolts), but is rescaled for each image to yield the best possible topographical differentiation. Thus, the amplitudes cannot be directly compared between images.
ANOVA with two components (P3a, P3b) × 3 electrodes (Fz, Cz, Pz) were computed to test whether the topography of the two components was different, and a significant component × electrode interaction was found (F [1.53, 120.92] = 21.06, P < 0.0001). Figures 1 and 4 show that P3a is more frontocentral than the parietally distributed P3b, indicating that the paradigm yielded a valid P3a vs. P3b distinction.
To test the main effects of age on amplitude and latency, interaction effects of age × electrode on amplitude, and to confirm that the amplitude and latency groups really were significantly different, ANOVAs with two age groups (young, old) × 2 P3a or P3b amplitude or latency groups (low/high, short/long) × 3 electrodes (Fz, Cz, Pz) were computed. Table IV presents the main findings. In Table V, correlations between age and different ERP parameters are presented. For both P3a and P3b amplitude and latency, significant main effects of age and amplitude/latency group were found, as well as significant age × electrode interactions for both P3a and P3b amplitude. As can be seen from Figures 1 and 4, and from Table V, these results are caused by smaller amplitudes and longer latencies in the elderly, and a more frontal amplitude distribution for the elderly than for the young participants.
Table IV.
ANOVA statistics
| df | F | P | |
|---|---|---|---|
| P3a amplitude | |||
| Age groups | 1, 68 | 29.61 | <0.0001 |
| Amplitude groups | 1, 68 | 100.03 | <0.0001 |
| Age × electrodes | 1.26, 85.48 | 17.06 | <0.0001 |
| P3a latency | |||
| Age groups | 1, 68 | 36.41 | <0.0001 |
| Latency groups | 1, 68 | 81.48 | <0.0001 |
| P3b amplitude | |||
| Age groups | 1, 68 | 55.52 | <0.0001 |
| Amplitude groups | 1, 68 | 55.53 | <0.0001 |
| Age × electrodes | 1.76, 119.46 | 6.27 | <0.01 |
| P3b latency | |||
| Age groups | 1, 68 | 10.79 | <0.01 |
| Latency groups | 1, 68 | 33.53 | <0.0001 |
ANOVAs with two age groups (young, elderly) × two amplitude/latency groups (low/short, high/long) × 3 electrodes (Fz, Cz, Pz) were computed for both P3a and P3b. Main effects of age and amplitude/latency group, as well as age group × electrode interaction for the amplitude measures, are reported.
Table V.
Correlations with age
| Distractor | Target | |||
|---|---|---|---|---|
| Amplitude | Latency | Amplitude | Latency | |
| Fz | −0.07 | 0.56 | 0.03 | 0.03 |
| Cz | −0.41 | 0.52 | −0.25 | 0.29 |
| Pz | −0.55 | 0.39 | −0.27 | −0.42 |
Numbers printed in bold indicate P < 0.05.
To quantify the degree of variance in the young and the elderly part of the sample, the SD for each component and parameter was calculated, and the difference between the means of each of the same‐age groups was divided by the SD. As can be seen in Table III, the difference between the groups was generally around 1.5 SD, with the exception of the elderly latency groups. For P3a latency in the elderly groups, the difference was only 0.8 SD. The corresponding number for P3b latency was 3.2.
P3a and Cortical Thickness in the Young Groups
Cortical thickness was compared across the groups of different latency or amplitude. As Figure 5 illustrates, only very small effects were seen for the younger participants. There was a slight tendency for the short latency groups to have thicker cortex. For P3a amplitude, a tiny effect of group was seen in the anterior part of the inferior temporal gyrus in the right hemisphere, in addition to parts of the occipital pole in the left. For P3a latency, small effects were found in the middle temporal gyrus and the medial occipital sulcus in the right hemisphere, in gyrus rectus in the left, as well as a tiny area in the middle frontal gyrus in both hemispheres.
Figure 5.
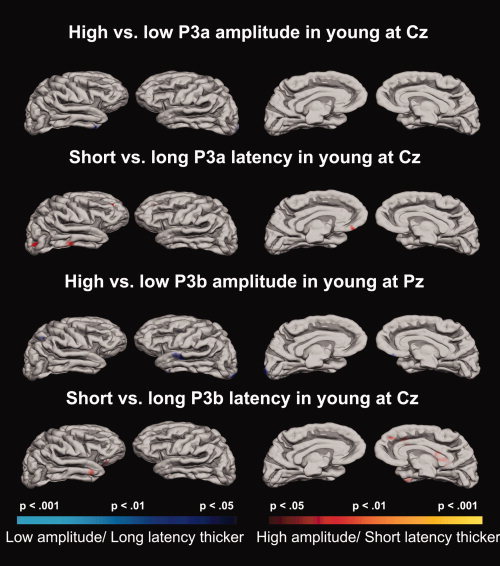
Relations between cortical thickness and P3 in young. P‐value maps of the comparisons of groups of younger participants with different latencies and amplitudes projected onto a template brain. Lateral and medial views of the brain are shown.
P3b and Cortical Thickness in the Young Groups
For the amplitude comparisons, all effects were in the negative direction, meaning that the low amplitude group showed slight tendencies to have thicker cortex. From the comparisons of the P3b amplitude groups, an effect was identified in the midsection of the superior temporal gyrus in the left hemisphere, in addition to a very small effect in the anterior part of the inferior temporal gyrus and the intersection between the occipital pole and gyrus cuneus in the same hemisphere. In the right hemisphere, small effects were found in gyrus rectus and in the superior parietal gyrus. P3b latency yielded effects in the anterior part of the middle temporal gyrus in the right hemisphere, in addition to an area in orbitofrontal cortex, superior frontal gyrus, and the lateral gyrus of the temporal pole, and a tendency in the anterior cingulate gyrus and sulcus. Still, even though some effects were identified comparing the young groups, these were generally weak and did not extend over large areas.
P3a and Cortical Thickness in the Elderly Groups
Figure 6 illustrates the results of the GLMs contrasting older participants with short and long P3a latency and high and low P3a amplitude. The high amplitude group had thicker cortex in large areas, located especially in posterior frontal and parietal areas, among these the pre‐ and postcentral gyri in both hemispheres, and the paracentral gyrus in the right and the subcentral gyrus in the left. Also, the groups differed in an area of the temporoparietal cortex in the left hemisphere. Some effects were also identified in more anterior frontal areas: inferior frontal gyrus in the right, middle frontal gyrus in the left hemisphere. Further, effects were found in the left hemisphere in the posterior cingulate and the cuneus.
Figure 6.
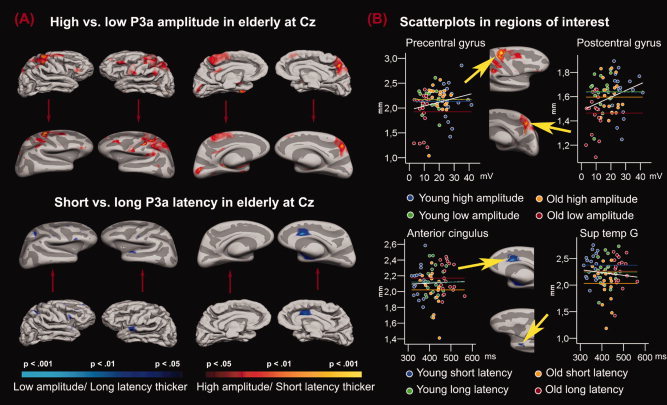
P3a amplitude and latency in older participants. Panel A: P‐value maps comparing groups of older participants with different P3a amplitudes and latencies are projected onto a template brain. In addition, the maps are projected onto an inflated brain with gyri (light grey) and sulci (dark grey) indicated. The inflated brain makes it possible to see inside the sulci, thus allowing the viewer the possibility of inspecting the entire brain surface. Note that the inflated brains have been downscaled to the same size as the normal brains. Areas where the groups differ significantly in cortical thickness are color coded, where red/yellow indicates that the groups of high amplitude or short latency have thicker cortex than the groups of low amplitude or long latency, and blue indicates the opposite relationship. As can be seen, the elderly with high P3a amplitude had thicker cortex in large areas, located especially in posterior frontal and parietal areas (i.e., pre‐ and postcentral gyri in both hemispheres, the paracentral gyrus in the right, the subcentral gyrus in the left), in addition to an area of the left temporoparietal cortex, and some smaller effects in more anterior frontal areas, and in left posterior cingulate and cuneus. The effects of latency were much smaller, and in the opposite direction of our expectations, with participants with long P3a latency showing thicker cortex in right anterior cingulate, in addition to some scattered areas across hemispheres. Panel B: Scatterplots in regions of interests showing the relationship between the P3 parameters and the mean thickness of the cerebral cortex in that specific region. The regions are defined by drawing around the outer edge of the cortical areas showing the most substantial difference between the P3 goups. The chosen regions are indicated by the arrowheads, and were found in right precentral gyrus, right postcentral gyrus, right anterior cingulus, and left superior temporal gyrus. Each group is color coded. The horizontal lines indicate the mean thickness in each group in the selected region, and the white lines indicate the regression line for the whole sample.
In the comparisons across latency groups, the effects were much smaller, and all were in the opposite direction of what was expected, with the long latency group having thicker cortex. The group differences were mainly concentrated around an area in the anterior cingulate gyrus in the right hemisphere. Further, some scattered areas of difference were identified in this hemisphere, including inferior and middle frontal gyrus, superior parietal gyrus, and the superior temporal gyrus. In the left hemisphere, the largest area of effect was found in the superior temporal gyrus.
P3b and Cortical Thickness in the Elderly Group
Figure 7 shows the cortical thickness comparisons for the elderly P3b groups. The thickness differences between the elderly with low vs. high P3b amplitude included only tiny and fragmented areas (in the subcallosal gyrus in the right hemisphere, and postcentral, middle frontal, and superior frontal gyrus on the left). However, the differences across the elderly with short vs. long P3b latency were large and in the expected direction. These effects were especially seen in frontal and temporal areas. The frontal cortical area included the insula, gyrus rectus, subcallosal gyrus, anterior cingulate, orbital, and frontomarginal gyri, as well as the superior and middle part of the frontal gyrus, and transverse frontopolar gyrus. Areas of different cortical thickness in the temporal lobe include middle and inferior parts of the temporal gyrus, and the temporal pole. Inspection of the results in Figure 7 projected onto an inflated template brain revealed that the areas of difference constituted large, continuous sections.
Figure 7.
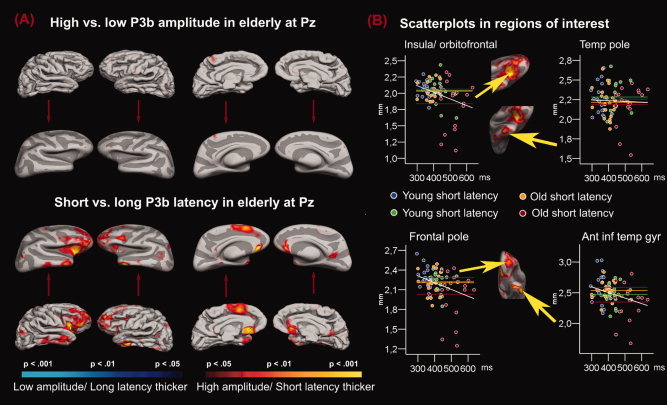
P3b amplitude and latency in older participants. Panel A: P‐value maps comparing groups of older participants with different P3b amplitudes and latencies are projected onto a template brain. Areas where the groups differ significantly in cortical thickness are color coded, where red/yellow indicates that the groups of high amplitude or short latency have thicker cortex than the groups of low amplitude or long latency. As can be seen, the elderly with high P3b amplitude had thicker cortex in tiny and fragmented areas (right hemisphere subcallosal gyrus, left postcentral, middle frontal, and superior frontal gyrus). The effects of latency were much larger. Elderly with short P3b latency had thicker cortex than the elderly with long P3b latency, especially in frontal (i.e., insula, gyrus rectus, subcallosal gyrus, anterior cingulate, orbital, and frontomarginal gyri, the superior and middle part of the frontal gyrus, transverse frontopolar gyrus) and temporal (middle and inferior parts of the temporal gyrus, the temporal pole) areas. Panel B: Scatterplots in regions of interests showing the relationship between the P3 parameters and the mean thickness of the cerebral cortex in that specific region. The regions are defined by drawing around the outer edge of the cortical areas showing the most substantial difference between the P3 goups. The chosen regions are indicated by the arrowheads, and were found in right insula/orbitofrontal cortex, right anterior inferior temporal gyrus, left frontal pole, and left anterior inferior temporal gyrus. Each group is color coded. The horizontal lines indicate the mean thickness in each group in the selected region, and the white lines indicate the regression line for the whole sample.
ANOVA Statistics: Age, P300, Morphometry, and Neuropsychology
Univariate ANOVAs were computed to test the relationship between selected morphometric variables (dependent variable), age group, and P3a or P3b latency or amplitude groups across age (between subject variables). On the basis of the statistics presented in Figures 6 and 7, two regions of interest were selected: an area in left temporoparietal cortex (related to P3a amplitude in the group of elderly) and an area in right orbitofrontal cortex (related to P3b latency in the group of elderly). In addition, the volume of hippocampus and the total WM volume were selected because these structures have been implied in previous research as important for P300 generation as mentioned earlier. Table VI presents the ANOVA results. Figure 8 presents scatterplots illustrating the individual data points. Age group and P3a amplitude both predicted thickness in left temporoparietal cortex, age group and P3b latency both predicted thickness in right orbitofrontal cortex, while WM and hippocampal volume were related to age group only. Figure 9 presents scatterplots showing the relationship between cognitive functions and age, P3a amplitude and P3b latency, and the different morphometric variables. Fluid function correlated with thickness of the temporoparietal cortex, hippocampal volume, WM, age, P3a amplitude, and P3b latency, while executive function correlated with hippocampal volume, WM, age, and P3a amplitude.
Table VI.
Univariate ANOVAs with morphometric variables as dependent and age group and P3a/P3b amplitude/latency groups as between subject factors
| Variable | df | F | P |
|---|---|---|---|
| P3a amplitude | |||
| Left temporoparietal | |||
| Age group | 1, 68 | 6.88 | <0.01 |
| P3a amplitude group | 1, 68 | 4.92 | <0.05 |
| Age × P3a amplitude | 1, 68 | 1.29 | n.s. |
| Hippocampus | |||
| Age group | 1, 67 | 18.76 | <0.0001 |
| P3a amplitude group | 1, 67 | 0.10 | n.s. |
| Age × P3a amplitude | 1, 67 | 7.15 | <0.01 |
| White matter | |||
| Age group | 1, 67 | 9.05 | <0.01 |
| P3a amplitude group | 1, 67 | 3.14 | n.s. |
| Age × P3a amplitude | 1, 67 | 3.76 | n.s. |
| P3b latency | |||
| Right orbitofrontal | |||
| Age group | 1, 68 | 4.84 | <0.05 |
| P3b latency group | 1, 68 | 4.22 | <0.05 |
| Age × P3b latency | 1, 68 | 2.64 | n.s. |
| Hippocampus | |||
| Age group | 1, 67 | 15.67 | <0.0001 |
| P3b latency group | 1, 67 | 1.51 | n.s. |
| Age × P3b latency | 1, 67 | 2.84 | n.s. |
| White Matter | |||
| Age group | 1, 67 | 7.62 | <0.01 |
| P3b latency group | 1, 67 | 0.07 | n.s. |
| Age × P3b latency | 1, 67 | 0.35 | n.s. |
Figure 8.
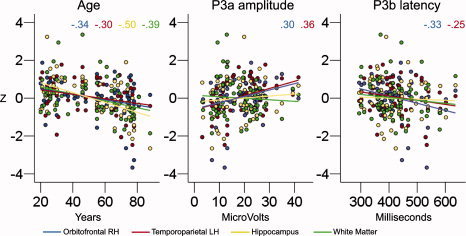
Scatterplots of the relationship between selected morphometric variables and age, P3a amplitude, and P3b latency. The scale on the y‐axis is z‐transformed scores for each of the four volumetric scores (mean = 0, SD = 1). The scale on the x‐axes represent age (years), P3a amplitude (in microvolts), and P3b latency (in milliseconds). The color lines represent the best linear fit between each of the volumetric variables and the independent variable. The colored numbers represent the r values for each of the comparisons. Only the correlations for significant relationships (P < 0.05) are presented.
Figure 9.
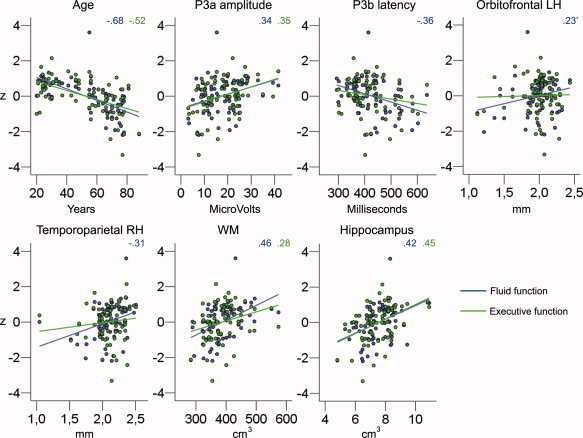
Scatterplots of the relationship between cognitive function and age, P3a amplitude, P3b latency, and morphometric variables. The scale on the y‐axis is z‐transformed scores for each of the four volumetric scores (mean = 0, SD = 1). The color lines represent the best linear fit between each of the cognitive variables (blue line: fluid function; green line: executive function) and the independent variable. The colored numbers represent the r values for each of the comparisons. Only the correlations for significant relationships (P < 0.05) are presented. RH, right hemisphere; LH, left hemisphere. The relationship between the thickness of orbitofrontal LH and fluid function was marginally significant (P = 0.058).
Structural Equation Modeling: Path Analyses
Based on previous research, theoretical reasoning, and the ANOVA results presented earlier, three path models were constructed. Figure 10 shows the path models, and the statistical results are presented in Table VII. In the first model, right orbitofrontal and left temporoparietal cortex were treated as exogenous variables, and paths were drawn from right orbitofrontal cortex to P3b latency and from P3b latency to fluid abilities. Further, paths were drawn from left temporoparietal cortex to P3a amplitude and from P3a amplitude to executive abilities. In this model, all paths were, as expected, significant. The relative χ 2 (cmin/df) was 4.48. According to Wheaton et al. (1977), a relative χ 2 of less than 5 is “beginning to be reasonable,” but others argue that 3 or less should be obtained for a reasonable fit (Carmines and McIvar, 1981). When paths from the two thickness measures were drawn directly to the neuropsychological variables, none of these even approximated significance (P > 0.36), also yielding a bad model fit (cmin/df = 6.90). When a path was drawn from P3b latency to executive abilities, this path was not significant (P > 0.30), while a path from P3a amplitude to fluid functions was significant. Still, this model yielded a slightly less good fit with the data (cmin/df = 4.73). Thus, the model depicted in the figure as Model 1 proved to be the best of the above models tested.
Figure 10.
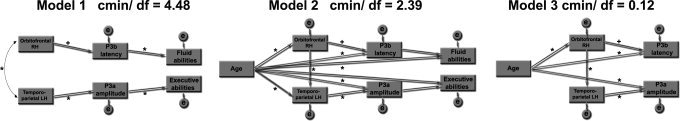
Path diagram of the relationship between regional cortical thickness, P3 parameters, and cognitive function. Three different models were constructed, where age was included as the only exogenous variable in the last two. Model 1 was constructed on the basis of previous research, theory, and ANOVA statistics. Model 3 was the result of removing nonsignificant paths from Model 2. *P < 0.05 +P < 0.06.
Table VII.
Regression weights from the path analyses of four different models
| Estimate | SE | CR | P | |||
|---|---|---|---|---|---|---|
| Model 1 | ||||||
| P3b latency | ← | Orbitofrontal RH | −0.33 | 36.232 | −2.897 | <0.01 |
| P3a amplitude | ← | Temporoparietal LH | 0.37 | 3.958 | 3.308 | <0.001 |
| Fluid | ← | P3b latency | −0.36 | 0.013 | −3.224 | <0.001 |
| Frontal | ← | P3a amplitude | 0.35 | 0.083 | 3.156 | <0.01 |
| Model 2 | ||||||
| Orbitofrontal RH | ← | Age | −0.34 | 0.001 | −3.004 | <0.01 |
| Temporoparietal LH | ← | Age | −0.11 | 0.001 | −1.091 | n.s. |
| Temporoparietal LH | ← | Orbitofrontal RH | 0.57 | 0.098 | 5.667 | <0.001 |
| P3b latency | ← | Orbitofrontal RH | −0.21 | 36.232 | −1.883 | <0.060 |
| P3a amplitude | ← | Temporoparietal LH | 0.27 | 3.908 | 2.446 | <0.05 |
| P3b latency | ← | Age | 0.34 | 0.420 | 2.994 | <0.01 |
| P3a amplitude | ← | Age | −0.33 | 0.044 | −3.002 | <0.01 |
| Fluid | ← | P3b latency | −0.10 | 0.011 | −1.050 | n.s. |
| Frontal | ← | P3a amplitude | 0.17 | 0.082 | 1.512 | n.s. |
| Fluid | ← | Age | −0.63 | 0.042 | −6.567 | <0.001 |
| Frontal | ← | Age | −0.45 | 0.033 | −4.213 | <0.001 |
| Model 3 | ||||||
| Orbitofrontal RH | ← | Age | −0.33 | 0.001 | −2.94 | <0.01 |
| Temporoparietal LH | ← | Orbitofrontal RH | 0.57 | 0.098 | 5.70 | <0.001 |
| P3b latency | ← | Orbitofrontal RH | −0.21 | 36.047 | −1.89 | <0.059 |
| P3a amplitude | ← | Temporoparietal LH | 0.27 | 3.00 | 2.506 | <0.05 |
| P3a amplitude | ← | Age | −0.33 | 0.044 | −3.016 | <0.01 |
| P3b latency | ← | Age | 0.34 | 0.418 | 3.001 | <0.01 |
RH, right hemisphere; LH, left hemisphere; Estimate, standardized partial regression weights; SE, standard error; CR, critical ratio.
Next, age was included as the only exogenous variable (Model 2). The relative χ 2 then dropped to 2.39, indicating a better fit with the data. This time, however, the paths between the P3 parameters and neuropsychological function were nonsignificant (P > 0.13), while the path between P3b latency and orbitofrontal cortex was marginally significant (P = 0.06). A final model (Model 3) was constructed, containing only the significant or marginally significant paths from Model 3. This time, the relative χ2 was as low as 0.12, indicating a very nice fit with the data (P = 0.95, indicating that the model was nonsignificantly different from a perfect fit to the data). Table VII presents the path weights.
DISCUSSION
General Findings
The present study is the first to demonstrate relationships between cortical thickness in specific areas and the amplitude and latency of scalp‐recorded P3s. Components (P3a and P3b) and parameters (latency and amplitude) showed different relationships with thickness, indicating that various functional networks have specific associations with cerebral characteristics. Finally, it was shown by path analyses how the variance is distributed across variables of brain morphometry, P300, age, and cognitive function. Still, the results do not give unequivocal support to all the hypotheses put forth. First, the P300‐cortical thickness relationships varied both in magnitude and in directionality. Second, even though larger effects in the elderly than in the young groups of participants were not surprising per se, the differences between the age groups were larger than expected. This can hardly be explained by increased interindividual variance in the older groups. Each of these issues is addressed in what follows.
P3a, P3b, and cortical thickness in young adulthood
The relationships between cortical thickness and P300 were generally weak in the young group. For latency, the few relationships that were identified were in the expected direction; short latency was associated with thicker cortex, both for P3a and P3b. For amplitude, the tendency was in the unexpected direction, in that higher P3a and P3b amplitude were associated with thinner cortex. However, all effects were topographically scattered and weak. It was expected that the variance in this group would be smaller than the variance in the elderly groups, reducing the possibility of finding confirming evidence. However, with the exception of P3b latency, the variance in the young group was not smaller than that in the older groups. It seems that P300 is sensitive to age‐dependent changes in the thickness of the cerebral cortex, but that this relationship depends on characteristics not yet observable in young adulthood. P300, then, is sensitive to changes in brain morphometry that comes with age, but does not reflect differences in regional cortical thickness in young participants. This further strengthens the potential of P300 as a sensitive measure of age‐changes. Further research should test whether the same is true in samples of children and adolescents.
P3a and cortical thickness in elderly
It was expected that differences between the P3a amplitude groups would be found in the temporoparietal area, postcentral gyrus and superior parietal gyrus, middle frontal gyrus, and hippocampus, and possibly in inferior frontal gyrus and anterior cingulate cortex. To what extent were such differences observed? Large effects were found in parietal areas (post‐ and precentral gyrus), extending down to the temporoparietal junction in the left hemisphere. Further, effects in middle frontal gyrus in right and inferior frontal gyrus in left hemisphere were identified, as were effects in an area in left posterior cingulate. The parietal effects are in correspondence with the hypotheses, and indicate overlap with areas shown to be involved in P3a generation. Also, the effects in middle and frontal gyrus show resemblance to what has been reported as areas for P3a generation. The results fit well with Bledowski et al. (2004), who found that distractor stimuli increased the BOLD response in large parietal areas in both hemispheres, i.e. postcentral gyrus and superior parietal gyrus. Further, Bledowski et al. found significant activation in lateral prefrontal areas (the middle frontal gyrus), also corresponding reasonably well to our findings. Thus, the present study shows correlations between cortical thickness and P3a parameters overlapping with areas in which this component is assumed to be generated. However, the results are less consistent with the earlier observation, by Ford et al. (1994), of a more specific frontal volumetric significance for the P3a. Also, contrary to our expectations, effects were not found for hippocampus and anterior cingulate cortex.
The effects for latency were much smaller than the effects for amplitude, and were in the opposite direction of what we had expected. Effects were found in the anterior cingulate in the right hemisphere and superior temporal gyrus in the left. The cingulate and the superior temporal gyrus have been implied in P3a generation (Opitz et al., 1999), but it was unexpected that longer latency was related to thicker cortex. It may be that thicker cortex in this part of the cingulate is responsible for introduction of more controlled, and hence slower, processing involved in the otherwise automated orienting response, i.e. P3a. It seems premature to assume that thicker cortex will uniformly create faster brain potentials. The effects may depend on both the specific cortical area and the specific nature of the ERP component. In any case, the findings indicate that speed of information processing and strength of the electrophysiological response are independent parameters of the same stimulus classification task, with different neuroanatomical correlates.
In sum, P3a amplitude correlated positively with cortical thickness in areas indicated by lesion studies and recent fMRI studies, establishing a connection between the strength of the electrophysiological responses and brain morphometry in cortical areas assumed to be involved in the generation of the potentials. Further, also P3a latency correlated with thickness in areas implied as generator sites. Still, the positive correlations showed that a straightforward relationship between speed of information processing and regional cortical thickness does not exist.
P3b and cortical thickness in elderly
We expected differences between the P3b groups in posterior cingulate, inferior frontal gyrus and the insula, and anterior cingulate cortex. It was found that P3b latency was related to cortical thickness in large, continuous areas of the cortical surface. As expected, areas in the lateral prefrontal cortex differed in thickness between the short and the long latency groups. The lateral prefrontal effect extended laterally into the insula, and medially to gyrus rectus, subcallosal gyrus and the most anterior part of the cingulate cortex in the right hemisphere. Further, some temporal effects were found, especially in the inferior and anterior parts, mostly lateral, in addition to some more scattered areas in the occipital lobe. Still, the effects had a markedly frontal focus, which corresponds well to several previous fMRI studies of target detection. Previous studies have found involvement of anterior cingulate gyrus (Kiehl et al., 2001a, b), insular cortex (Linden et al., 1999), middle (Clark et al., 2000; Kiehl et al., 2001a, b; Kirino et al., 2000) and inferior frontal gyrus (Kiehl et al., 2001a, b). This main trend is also in coherence with the recent review by Linden (2005). Further, Bledowski et al. (2004) found large bilateral insular activation, corresponding well especially to our right hemisphere findings. However, Bledowski et al. also found target processing to be accompanied by temporoparietal and parietal activation, areas where our P3b latency groups do not differ in cortical thickness.
The involvement of insula is not surprising, since it is important in cognitive control and executive function (Bunge et al., 2001; Dove et al., 2000), in addition to response (Garavan et al., 1999) and thought inhibition (Wyland et al., 2003). Insula is neuroanatmically connected to several important brain structures, including thalamus, cingulate cortex, and orbitofrontal cortex. Morris (2002) argues that because the insula is activated in very different types of tasks, it has a generalized role that is not specific to any particular emotion or behavioral context. The large number of reciprocal neural pathways to other structures supports this interpretation. The present data demonstrate the importance of the insula also at the morphometric level.
Differences in the inferior temporal areas between groups with short vs. long latency are not so easily interpreted. The temporal lobes are involved in several complex cognitive tasks (Cabeza and Nyberg, 2000). The inferior temporal gyrus has been implicated in visual perception (Herath et al., 2001; Ishai et al., 1999), while the middle temporal gyrus has been found to be related to endogenous orienting of visuospatial attention (Mayer et al., 2004). Adequate performance in the visual three‐stimulus task requires involvement of these cognitive processes. A post hoc explanation for the connection between P3b latency and thickness in these areas may be that they are involved in visuoperceptual cognition. For P3b amplitude, virtually no effects were observed. In conclusion, it seems to be the speed of target stimulus classification that is related to the thickness of the cerebral cortex, not the magnitude of the electrical signal generated. This means that for P3b, faster is better, while for P3a, stronger is better. It is, however, important to note that this is true within the group of elderly participants only.
Structural equation modeling: Path analyses
Path model 1 indicated that P3a and P3b are differentially related to neuropsychological performance in healthy participants. P3a was more related to executive function and P3b was more related to general, fluid function. This is in accordance with theoretical speculations about the cognitive significance of the two components. Further, it was shown that an area in left temporoparietal cortex predicted P3a amplitude, and that a large area in orbitofrontal cortex predicted P3b latency. These relationships survived introduction of direct paths from the neuroanatomical volumes to neuropsychological function, giving evidence that P3 explains variance in cognitive ability that is not explained by cortical thickness. Hippocampal and WM volume were not included in the path models, since the ANOVAs indicated that these volumes did not give unique contributions to the amount of explained variance. However, a more appropriate measure of WM contribution to scalp‐recorded ERPs would probably be to use diffusion weighted imaging (Haueisen et al., 2002).
Model 1 depended heavily on the common variance induced by age, and the conclusions drawn must apply to a healthy adult life‐span sample only. Additional models including age as the single exogenous variable were constructed. These models showed excellent fit with the data, but the common variance induced by age naturally rendered the relationship between P3 and cognitive function nonsignificant. An age‐homogenous sample is needed to see whether these relationships may be present independently of age. Still, testing the model gave evidence that cortical thickness in specific areas predict scalp recorded P300 also independently of age. The findings indicate that cortical thinning in parts of the frontal lobes underlies the commonly found P3b latency increases in aging. Friedman et al. (1997) have speculated that it may take older participants longer to form a stable representation of rarely occurring stimuli in working memory. This may again be caused by the observed age‐related atrophy in the frontal cortex. The efficiency of building stable representations of rarely occurring stimuli may constitute a theoretical connection between the cortical thickness in anterior parts of the brain and P300 latency. In sum, the results represent evidence for a relationship between thickness of the orbitofrontal cortex and fluid abilities, and between temporoparietal cortex and executive abilities, within an adult life‐span perspective.
CONCLUSION
We expected that P3 components should be related to differences in cortical thickness and cognitive function in aging. The results represent confirmatory evidence for such a relationship for P3a amplitude and P3b latency in the elderly age group. A reasonable correspondence was obtained between areas of effect in the present study and areas implied as involved in P3 generation from depth electrode, lesion, and fMRI studies. However, when young participants with different P3 amplitude and latency were compared, only minor differences in cortical thickness were found. It is concluded that P300 is sensitive to individual differences in brain morphometry created by normal aging, but not to differences in regional cortical thickness in young. Also, the large differences in effect between different parameters (latency vs. amplitude) were surprising, and need to be further investigated in other samples. Still, the present report is the first to establish connections among cortical thickness, scalp‐recorded ERPs, and cognitive function.
REFERENCES
- Balota DA,Dolan PO,Duchek JM ( 2000): Memory changes in healthy older adults In: Tulving E,Craik F. (eds): The Oxford Handbook of Memory. Oxford: Oxford University Press; pp. 395–409. [Google Scholar]
- Bazana PG,Stelmack RM ( 2002): Intelligence and information processing during an auditory discrimination task with backward masking: An event‐related potential analysis. J Pers Soc Psychol 84: 998–1008. [DOI] [PubMed] [Google Scholar]
- Beck AT,Steer R ( 1987): Beck Depression Inventory Scoring Manual. New York: The Psychological Corporation. [Google Scholar]
- Bledowski C,Prvulovic D,Hoechstetter K,Scherg M,Wibral M,Goebel R,Linden DEJ ( 2004): Localizing P300 generators in visual target and distractor processing: A combined event‐related potential and functional magnetic resonance imaging study. J Neurosci 24: 9353–9360. [DOI] [PMC free article] [PubMed] [Google Scholar]
- Bunge SA,Ochsner KN,Desmond JE,Glover GH,Gabrieli JDE ( 2001): Prefrontal regions involved in keeping information in and out of mind. Brain 124: 2074–2086. [DOI] [PubMed] [Google Scholar]
- Cabeza R,Nyberg L ( 2000): Imaging cognition. II. An empirical review of 275 PET and fMRI studies. J Cogn Neurosci 2: 1–47. [DOI] [PubMed] [Google Scholar]
- Cardenas VA,Chao LL,Blumenfeld R,Song E,Meyerhoff DJ,Weiner MW,Studholme C ( 2005): Using automated morphometry to detect associations between ERP latency and structural brain MRI in normal adults. Hum Brain Mapp 25: 317–327. [DOI] [PMC free article] [PubMed] [Google Scholar]
- Carmines EG,McIvar JP ( 1981): Analyzing models with unobserved variables In: Bohrnstedt GW,Borgatta EF, editors. Social Measurement: Current Issues. Beverly Hills: Sage. [Google Scholar]
- Caviness VS Jr,Filipek PA,Kennedy DN ( 1989): Magnetic resonance technology in human brain science: blueprint for a program based upon morphometry. Brain Dev 11: 1–13. [DOI] [PubMed] [Google Scholar]
- Clark VP,Fannon S,Lai S,Benson R,Bauer L ( 2000): Responses to rare visual target and distractor stimuli using event related fMRI. J Neurophysiol 83: 3133–3139. [DOI] [PubMed] [Google Scholar]
- Coles MGH,Rugg MD ( 1995): Event‐related brain potentials: An introduction In: Rugg MD,Coles MD. (eds): Electrophysiology of Mind. New York: Oxford University Press; pp. 1–26. [Google Scholar]
- Comerchero MD,Polich J ( 1999): P3a and P3b from typical auditory and visual stimuli. Clin Neurophysiol 110: 24–30. [DOI] [PubMed] [Google Scholar]
- Courchesne E. ( 1978): Changes in P3 waves with event repetition: Long‐term effects on scalp distribution and amplitude. Electroenceph Clin Neurophysiol 45: 754–766. [DOI] [PubMed] [Google Scholar]
- Courchesne E,Hillyard SA,Galambos R ( 1975): Stimulus novelty, task relevance, and the visual evoked potential in man. Electroencephalogr Clin Neurophysiol 39: 131–143. [DOI] [PubMed] [Google Scholar]
- Courchesne E,Hillyard SA,Galambos R ( 1978): The effect of stimulus deviation on P3 waves to easily recognized stimuli. Neuropsychologia 16: 189–199. [DOI] [PubMed] [Google Scholar]
- Daffner KR,Scinto1 LFM,Weitzman AM,Faust R,Rentz DM,Budson AE,Holcomb PJ ( 2003): Frontal and parietal components of a cerebral network mediating voluntary attention to novel events. J Cogn Neurosci 15: 294–313. [DOI] [PubMed] [Google Scholar]
- Dale AM,Sereno MI ( 1999): Improved localization of cortical activity by combining EEG and MEG with MRI cortical surface reconstruction: A linear approach. J Cogn Neurosci 5: 162–176. [DOI] [PubMed] [Google Scholar]
- Dale AM,Fischl B,Sereno MI ( 1993): Cortical surface‐based analysis. I. Segmentation and surface reconstruction. Neuroimage 9: 179–194. [DOI] [PubMed] [Google Scholar]
- Damasio AR ( 1994): Descartes' error. Emotion, Reason, and the Human Brain. Avon Books, New York. [Google Scholar]
- Deary IJ,Caryl PG ( 1997): Neuroscience and human intelligence differences. Trends Neurosci 20: 365–371. [DOI] [PubMed] [Google Scholar]
- Delorme A,Makeig S ( 2004): EEGLAB: An open source toolbox for analysis of single‐trial EEG dynamics. J Neurosci Methods 134: 9–21. [DOI] [PubMed] [Google Scholar]
- Dove A,Pollman S,Schubert T,Wiggins C,von Cramon DY ( 2000): Prefrontal cortex activation in task switching: An event‐related fMRI study. Cogn Brain Res 9: 103–109. [DOI] [PubMed] [Google Scholar]
- Egan V,Chiswick A,Santosh C,Naidu K,Rimmington JE,Best JK ( 1994): Size isn't everything: A study of brain volume, intelligence and auditory evoked potentials. Pers Ind Diff 17: 357–367. [Google Scholar]
- Fischl B,Dale AM ( 2000): Measuring the thickness of the human cerebral cortex from magnetic resonance images. Proc Natl Acad Sci USA 97: 11050–11055. [DOI] [PMC free article] [PubMed] [Google Scholar]
- Fischl B,Sereno MI,Dale AM ( 1999a): Cortical surface‐based analysis. II. Inflation, flattening, and a surface‐based coordinate system. Neuroimage 9: 195–207. [DOI] [PubMed] [Google Scholar]
- Fischl B,Sereno MI,Tootell RB,Dale AM ( 1999b): High‐resolution intersubject averaging and a coordinate system for the cortical surface. Hum Brain Mapp 8: 272–284. [DOI] [PMC free article] [PubMed] [Google Scholar]
- Fischl B,Liu A,Dale AM ( 2001): Automated manifold surgery: Constructing geometrically accurate and topologically correct models of the human cerebral cortex. IEEE Trans Med Imaging 20: 70–80. [DOI] [PubMed] [Google Scholar]
- Fischl B,Salat DH,Busa E,Albert M,Dieterich M,Haselgrove C,van der Kouwe A,Killiany R,Kennedy D,Klaveness S,Montillo A,Makris N,Rosen B,Dale AM ( 2002): Whole brain segmentation: automated labeling of neuroanatomical structures in the human brain. Neuron 31: 341–355. [DOI] [PubMed] [Google Scholar]
- Fjell AM,Walhovd KB ( 2001): P300 and neuropsychological tests as measures of aging: Scalp topography and cognitive changes. Brain Topogr 14: 25–40. [DOI] [PubMed] [Google Scholar]
- Fjell AM,Walhovd KB ( 2003a): Effects of auditory stimulus intensity and hearing threshold on the relationship among P300, age, and cognitive function. Clin Neurophysiol 114: 799–807. [DOI] [PubMed] [Google Scholar]
- Fjell AM,Walhovd KB ( 2003b): On the topography of P3a and P3b—A factor‐analytic study with orthogonal Procrustes rotation to maximize congruence. Brain Topogr 15: 153–164. [DOI] [PubMed] [Google Scholar]
- Fjell AM,Walhovd KB ( 2003c): P3a and neuropsychological ‘Frontal’ tests in aging. Aging Neuropsychol Cogn 10: 169–181. [Google Scholar]
- Fjell AM,Walhovd KB ( 2004): Life‐span changes in P3a. Psychophysiology 41: 575–583. [DOI] [PubMed] [Google Scholar]
- Fjell AM,Walhovd KB ( 2005): Age‐sensitivity of P3 in high‐functioning adults. Neurobiol Aging 26: 1297–1299. [DOI] [PubMed] [Google Scholar]
- Fjell AM,Walhovd KB,Reinvang I,Lundervold A,Salat D,Quinn BT,Fischl B,Dale AM ( 2006): Selective increase of cortical thickness in high‐performing elderly‐structural indices of optimal cognitive aging. Neuroimage 29: 984–994. [DOI] [PubMed] [Google Scholar]
- Folstein MF,Folstein SE,McHugh PR ( 1975): “Mini‐mental state.” J Psychiatr Res 12: 189–198. [DOI] [PubMed] [Google Scholar]
- Ford JM,Sullivan EV,Marsh L,White PM,Lim KO,Pfefferbaum A ( 1994): The relationship between P300 amplitude and regional gray matter volumes depends upon the attentional system engaged. Electroencephalogr Clin Neurophysiol 90: 214–228. [DOI] [PubMed] [Google Scholar]
- Friedman D ( 2003): Cognition and aging: A highly selective overview of event‐related potential (ERP) data. J Clin Exp Neuropsychol 25: 702–720. [DOI] [PubMed] [Google Scholar]
- Friedman D,Kazmerski V,Fabiani M ( 1997): An overview of age‐related changes in the scalp distribution of P3b. Electroencephalogr Clin Neurophysiol 104: 498–513. [DOI] [PubMed] [Google Scholar]
- Garavan H,Ross TJ,Stein EA ( 1999): Right hemispheric dominance of inhibitory control: An event‐related functional MRI study. Proc Natl Acad Sci USA 96: 8301–8306. [DOI] [PMC free article] [PubMed] [Google Scholar]
- Goldstein JM,Goodman JM,Seidman LJ,Kennedy DN,Makris N,Lee H,Tourville J,Caviness VS,Faraone SV,Tsuang MT ( 1999): Cortical abnormalities in schizophrenia identified by structural magnetic resonance imaging. Arch Gen Psychiatry 56: 537–547. [DOI] [PubMed] [Google Scholar]
- Haueisen J,Tuch DS,Ramon C,Schimpf PH,Wedeen VJ,George JS,Belliveau JW ( 2002): The influence of brain tissue anisotropy on human EEG and MEG. Neuroimage 15: 159–166. [DOI] [PubMed] [Google Scholar]
- Herath P,Kinomura S,Roland PE ( 2001): Visual recognition: Evidence for two distinctive mechanisms from a PET study. Hum Brain Mapp 12: 110–119. [DOI] [PMC free article] [PubMed] [Google Scholar]
- Houlihan M,Stelmack R,Campbell K ( 1998): Intelligence and the effects of perceptual processing demands, task difficulty and processing speed on P300, reaction time and movement time. Intelligence 26: 925. [Google Scholar]
- Ishai A,Ungerleider LG,Martin A,Haxby JV ( 1999): Distributed representation of objects in the human ventral visual pathway. Proc Natl Acad Sci USA 96: 9379–9384. [DOI] [PMC free article] [PubMed] [Google Scholar]
- Jausovec N,Jausovec K ( 2000): Correlations between ERP parameters and intelligence: A reconsideration. Biol Psychol 55: 137–154. [DOI] [PubMed] [Google Scholar]
- Kennedy DN,Filipek PA,Caviness VS ( 1989): Anatomic segmentation and volumetric calculations in nuclear magnetic resonance imaging. IEEE Trans Med Imaging 8: 1–7. [DOI] [PubMed] [Google Scholar]
- Kiehl KA,Liddle PF ( 2001a): An event‐related functional magnetic resonance imaging study of an auditory oddball task in schizophrenia. Schizophr Res 30: 159–171. [DOI] [PubMed] [Google Scholar]
- Kiehl KA,Laurens KR,Duty TL,Forster BB,Liddle PF ( 2001b): Neural sources involved in auditory target detection and novelty processing: an event‐related fMRI study. Psychophysiology 38: 133–142. [PubMed] [Google Scholar]
- Kirino E,Belger A,Goldman‐Rakic P,McCarthy G ( 2000): Prefrontal activation evoked by infrequent target and novel stimuli in a visual target detection task: an event‐related functional magnetic resonance imaging study. J Neurosci 20: 6612–6618. [DOI] [PMC free article] [PubMed] [Google Scholar]
- Knight RT ( 1984): Decreased response to novel stimuli after prefrontal lesions in man. Electroencephalogr Clin Neurophysiol 59: 9–20. [DOI] [PubMed] [Google Scholar]
- Knight RT ( 1996): Contribution of human hippocampal region to novelty detection. Nature 383: 256–259. [DOI] [PubMed] [Google Scholar]
- Knight RT ( 1997): Electrophysiological methods in behavioral neurology and neuropsychology In: Feinberg TE,Farah MJ, editors. Behavioral Neurology and Neuropsychology. New York: McGraw Hill; pp 101–119. [Google Scholar]
- Knight RT,Scabini D ( 1998): Anatomic bases of event‐related potentials and their relationship to novelty detection in humans. J Clin Neurophysiol 15: 3–13. [DOI] [PubMed] [Google Scholar]
- Kuperberg GR,Broome MR,McGuire PK,David AS,Eddy M,Ozawa F,Goff D,West WC,Williams SC,van der Kouwe AJ,Salat DH,Dale AM,Fischl B ( 2003): Regionally localized thinning of the cerebral cortex in schizophrenia. Arch Gen Psychiatry 60: 878–888. [DOI] [PubMed] [Google Scholar]
- Lezak MD ( 1995): Neuropsychological Assessment, 3rd ed. Oxford: Oxford University Press. [Google Scholar]
- Linden DEJ ( 2005): The P300: Where in the brain is it produced and what does it tell us? Neuroscientist 11: 563–576. [DOI] [PubMed] [Google Scholar]
- Linden DEJ,Prvulovic D,Formisano E,Völlinger M,Zanella FE,Goebel R,Dierks T ( 1999): The functional neuroanatomy of target detection: An fMRI study of visual and auditory oddball tasks. Cereb Cortex 9: 815–823. [DOI] [PubMed] [Google Scholar]
- Luria AR ( 1980): Higher Cortical Functions in Man. Basic Books, New York. [Google Scholar]
- Mayer AR,Dorflinger JM,Rao SM,Seidenberg M ( 2004): Neural networks underlying endogenous and exogenous visual‐spatial orienting. Neuroimage 23: 534–541. [DOI] [PubMed] [Google Scholar]
- McGarry‐Roberts PA,Stelmack RM,Campbell KB ( 1992): Intelligence, reaction time, and event‐related potentials. Intelligence 16: 289–313. [Google Scholar]
- Morris JS ( 2002): How do you feel? Trends Cogn Sci 6: 317–319. [DOI] [PubMed] [Google Scholar]
- O'Donnell BF,Friedman S,Swearer JM,Drachman DA ( 1992): Active and passive P3 latency and psychometric performance: Influence of age and individual differences. Int J Psychophysiol 12: 187–195. [DOI] [PubMed] [Google Scholar]
- Opitz B,Mecklinger A,Friederici AD,von Cramon DY ( 1999): The functional neuroanatomy of novelty processing: Integrating ERP and fMRI results. Cereb Cortex 9: 379–391. [DOI] [PubMed] [Google Scholar]
- Pakkenberg B,Gundersen HJG ( 1997): Neocortical neuron numbers in humans: Effect of sex and age. J Comp Neurology 384: 312–320. [PubMed] [Google Scholar]
- Pfefferbaum A,Ford JM,Weller BJ,Kopell BS ( 1985): ERPs to response production and inhibition: Effects of age, probability and visual noise. Electroencephalogr Clin Neurophysiol 71: 55–63. [DOI] [PubMed] [Google Scholar]
- Pfefferbaum A,Ford JM,Kraemer HC ( 1990): Clinical utility of long latency ‘cognitive’ event‐related potentials (P3): The cons. Electroencephalogr Clin Neurophysiol 6: 6–12. [DOI] [PubMed] [Google Scholar]
- Polich J ( 1996): Meta‐analysis of P300 normative aging studies. Psychophysiol 33: 334–353. [DOI] [PubMed] [Google Scholar]
- Polich J ( 2003a): Overview of P3a and P3b In: Polich J. (ed): Detection of Change‐ Event‐Related Potential and fMRI Findings. Boston: Kluwer Academic Press; pp 83–98. [Google Scholar]
- Polich J ( 2003b): Clinical application of the P300 event‐related brain potential. Phys Med Rehabil Clin North Am 15: 133–161. [DOI] [PubMed] [Google Scholar]
- Rosas HD,Liu AK,Hersch S,Glessner M,Ferrante RJ,Salat DH,van der Kouwe A,Jenkins BG,Dale AM,Fischl B ( 2002): Regional and progressive thinning of the cortical ribbon in Huntington's disease. Neurology 58: 695–701. [DOI] [PubMed] [Google Scholar]
- Salat DH,Buckner RL,Snyder AZ,Greve DN,Desikan RSR,Busa E,Morris JC,Dale AM,Fischl B ( 2004): Thinning of the cerebral cortex in aging. Cereb Cortex 14: 721–730. [DOI] [PubMed] [Google Scholar]
- Schaie K ( 1994): The course of adult intellectual development. Am Psychol 49: 304–313. [DOI] [PubMed] [Google Scholar]
- Schretlen D,Pearlson GD,Anthony JC,Aylward EH,Augustine AM,Davis A,Barta P ( 2000): Elucidating the contributions of processing speed, executive ability, and frontal lobe volume to normal age‐related differences in fluid intelligence. J Int Neuropsychol Soc 6: 52–61. [DOI] [PubMed] [Google Scholar]
- Seidman LJ,Faraone SV,Goldstein JM,Goodman JM,Kremen WS,Toomey R,Tourville J,Kennedy D,Makris N,Caviness VS,Tsuang MT ( 1999): Thalamic and amygdala–hippocampal volume reductions in first‐degree relatives of patients with schizophrenia: an MRI‐based morphometric analysis. Biol Psychiatry 46: 941–954. [DOI] [PubMed] [Google Scholar]
- Semlitsch HV,Anderer P,Schuster P,Presslich O ( 1986): A solution for reliable and valid reduction of ocular artifacts applied to the P300 ERP. Psychophysiol 23: 695–703. [DOI] [PubMed] [Google Scholar]
- Simons RF,Graham FK,Miles MA,Chen X ( 2001): On the relationship of P3a and the novelty‐P3. Biol Psychol 56: 207–218. [DOI] [PubMed] [Google Scholar]
- Spreen O,Strauss E ( 1991): A Compendium of Neuropsychological Tests: Administration, Norms, and Commentary. New York: Oxford University Press. [Google Scholar]
- Squires NK,Squires KC,Hillyard SA ( 1975): Two varieties of long‐latency positive waves evoked by unpredictable auditory stimuli in man. Electroencephalogr Clin Neurophysiol 38: 387–401. [DOI] [PubMed] [Google Scholar]
- Van Petten C ( 2004): Relationships between hippocampal volume and memory ability in healthy individuals across the lifespan: Review and meta‐analysis. Neuropsychologia 42: 1394–1413. [DOI] [PubMed] [Google Scholar]
- Van Petten C,Plante E,Davidson PSR,Kuo TY,Bajuscak L,Glisky EL ( 2004): Memory and executive function in older adults: Relationships with temporal and prefrontal gray matter volumes and white matter hyperintensities. Neuropsychologia 42: 1313–1335. [DOI] [PubMed] [Google Scholar]
- Verleger R,Heide W,Butt C,Kompf D ( 1994): Reduction of P3b potentials in patients with temporoparietal lesions. Cogn Brain Res 2: 103–116. [DOI] [PubMed] [Google Scholar]
- Walhovd KB,Fjell AM ( 2001): Two‐ and three‐stimuli auditory oddball ERP tasks and neuropsychological measures in aging. Neuroreport 12: 3149–3153. [DOI] [PubMed] [Google Scholar]
- Walhovd KB,Fjell AM ( 2002): The relationship between P3 and neuropsychological function in an adult life span sample. Biol Psychol 62: 65–87. [DOI] [PubMed] [Google Scholar]
- Walhovd KB,Fjell AM,Reinvang I,Lundervold A,Quinn BT,Dale AM,Makris N,Fischl B ( 2005a): Cortical volume and speed‐of‐processing are complementary in prediction of performance intelligence. Neuropsychologia 43: 704–713. [DOI] [PubMed] [Google Scholar]
- Walhovd KB,Fjell AM,Reinvang I,Lundervold A,Eilertsen DE,Quinn BT,Dale AM,Makris N,Fischl B ( 2005b): Effects of age on volumes of cortex, white matter and subcortical structures. Neurobiol Aging 26: 1261–1270. [DOI] [PubMed] [Google Scholar]
- Walhovd KB,Fjell AM,Reinvang I,Lundervold A,Dale AM,Quinn BT,Salat D,Makris N,Fischl B ( 2005c): Neuroanatomical aging: Universal but not uniform. Neurobiol Aging 26: 1279–1282. [DOI] [PubMed] [Google Scholar]
- West R,Baylis GC ( 1998): Effects of increased response domination and contextual disintegration on the Stroop interference effect in older adults. Psychol Aging 13: 206–217. [DOI] [PubMed] [Google Scholar]
- Wheaton B,Muthén B,Alwin DF,Summers GF ( 1977): Assessing reliability and stability in panel models In: Heise DR,editor. Sociological Methodology. San Francisco: Jossey‐Bass; pp 84–136. [Google Scholar]
- Wickett JC,Vernon PA,Lee DH ( 2000): Relationships between factors of intelligence and brain volume. Pers Ind Diff 29: 1095–1122. [Google Scholar]
- Wyland CL,Kelley WM,Macrae CN,Gordon HL,Heatherton TF ( 2003): Neural correlates of thought suppression. Neuropsychologia 41: 1863–1867. [DOI] [PubMed] [Google Scholar]