Abstract
There are several types of experiment in which it is useful to have subjects speak overtly in a magnetic resonance imaging (MRI) scanner, including those studying the articulatory apparatus and the neural basis of speech production, and fMRI experiments in which speech is used as a response modality. Although it is relatively easy to record sound from the bore, it can be difficult to hear the speech over the very loud acoustic noise from the scanner. This is particularly a problem during echo‐planar imaging, which is usually used for fMRI. We present a post‐hoc sound cancellation algorithm, and describe a Windows‐based tool that implements it. The tool is fast and operates with minimal user intervention. We evaluate cancellation performance in terms of the improvement in signal‐to‐noise ratio, and investigate the effect of the recording medium. A substantial improvement in audibility was obtained. Hum. Brain Mapping 24:299–304, 2005. © 2005 Crown Copyright
Keywords: fMRI, speech, echo‐planar imaging
INTRODUCTION
There are a number of experimental situations in which it is useful to have participants speak overtly in a magnetic resonance imaging (MRI) scanner. The most obvious are perhaps those conducted to examine the movements of the articulatory system as it produces sounds [e.g., Demolin et al., 2002; Ettema et al., 2002; Stone et al., 2001]. Overt speech is also required to examine some aspects of the neural basis of its production [e.g., Crosson et al., 2001; Fiez, 2001; Heim et al., 2002; Huang et al., 2002; Kircher et al., 2002; Palmer et al., 2001]. Speech is also a useful response modality in many functional MRI (fMRI) experiments, such as those studying working memory or free recall. In all of these types of experiments, it is often useful, and sometimes essential, to be able to record the speech produced.
Many MRI scanners have microphones fitted by default so that the person being scanned can talk to the operator, and it is not usually difficult to record from these throughout an experiment. However, MRI scanners produce loud acoustic noise (e.g., 115 dB[A] [Shellock et al., 1998]; 116 dB[A] on the 3‐tesla scanner at the Wolfson Brain Imaging Center, Cambridge, UK). It is inevitable that if the gradients used in the imaging process are to be linear and change very quickly, they will be noisy [Jezzard and Clare, 1999]. Furthermore, echo‐planar sequences typically used for functional imaging are especially loud. Although we can record the subject in the scanner, they therefore may not be audible against the noise of the machine. One solution is to use a “sparse imaging” type technique such as that usually used for studies of auditory perception [Hall et al., 1999]. A long interval would be introduced between scans, so that speech may be spoken in quiet. Because of the delay of the hemodynamic response, the activation due to the speech production processes will be manifest a few seconds later. Such a procedure would require a substantially slower acquisition rate and, accordingly, loss of sensitivity (signal‐to‐noise per unit time).
An alternative approach, described herein, is to record the speech in the presence of the loud acquisitions, but then apply post‐hoc noise cancellation. One possible form of cancellation would be to use spectral algorithms, such as the one employed by CoolEdit (online at http://www.syntrillium.com). This algorithm requires a sample of the scanner noise alone. It then calculates the spectrum of this sound, and then to carry out noise reduction it selectively attenuates frequencies that are prominent in the noise. Such algorithms are most effective when there is little spectral overlap between the target and interfering sounds; unfortunately, this criterion is unlikely to be met when trying to separate speech from scanner noise. A more promising strategy presents itself on consideration of the specific nature of the noise we are trying to cancel. The noise is a result of the vibrations from rapid changes in gradients generated by the MR scanner. Fortunately, these rapid changes are being controlled with microsecond accuracy, and the pattern of changes from one scan to the next is identical. This means that the acoustic noise generated by the scanner is likely to be fairly regular from one scan to the next. Provided the waveforms of the scanner and speech have added linearly, if we can calculate what the noise the scanner makes, it should be possible to simply subtract it from the waveform.
MATERIALS AND METHODS
Procedure
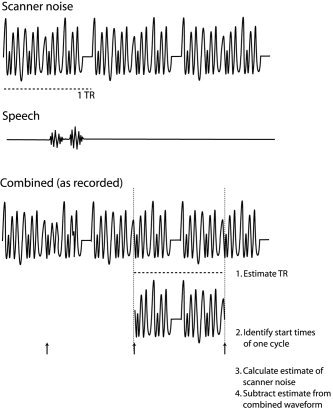
The cancellation procedure was designed to require a minimum of user intervention. An overview of the strategy is show in Figure 1. Initially, the time between the onset of acquisition of sequential volumes (TR) is estimated. A single cycle of noise is then chosen, and onsets of this cycle elsewhere in the sound are found. Next, a more precise estimate of the scanner noise is generated. Finally, this is subtracted away from the recording. We discuss each of these stages in subsequent sections. In addition to describing the algorithm we used, we give references to the specific options in the user interface of our tool (free download available online at http://www.mrc-cbu.cam.ac.uk/~rhodri.cusack/scannernoisecancellation). To record sound at the quality used here requires around 5 MB/min. The sound files therefore can be large, and the cancellation tool was designed to deal with these. The sound file is divided into a number of chunks (by default 45 s in duration), and these are processed separately. To prevent discontinuities in the waveform between chunks, they are recombined using an overlap‐and‐add technique, in which the chunks are ramped at either end with overlapping 10‐ms linear ramps.
Figure 1.

The top panel shows the waveform of the repetitive scanner noise from three acquisitions, and the second a corresponding speech waveform. In the bottom panel the cancellation procedure is illustrated. First, the TR is estimated, then one cycle is extracted and its corresponding start times estimated. These are then averaged to form an estimate of the scanner noise, and this subtracted from the waveform at the appropriate points.
Estimating the TR
The only intervention required by the user in the cancellation procedure is for an estimate of the TR to be provided. This is given as an estimate (e.g., 3.1 s) and a range (e.g., within 0.1 s). This range is then searched for the precise TR. The basic procedure is one of autocorrelation: the sound waveform is correlated with a lagged version of itself. Various lags are tried, corresponding to the range given by the user, and the one with the highest autocorrelation chosen.
For the cancellation procedure to work, precise temporal accuracy is required. A high frequency sound has a very short period (e.g., 0.2 ms for a 5‐kHz tone), and so a misalignment in the estimation or subtraction process of a fraction of a millisecond will cause the waveforms to be out of phase, and lead to complete failure of the algorithm. As all shifts of the waveforms are by whole numbers of samples, an improvement in precision can be gained by increasing the sample rate. Ideally, the initial signal should be sampled at a high rate, recording equipment and memory capacity permitting. We used a digital audio tape (DAT) recorder, and converted the input to Windows WAV format audio files at 44.1 kHz. A further increase in sample rate is possible by upsampling the data. We used upsampling of a factor of two using Hanning‐windowed sinc interpolation with a range of three samples.
As well as the importance of the accuracy of the calculations, another important consideration is speed. The recordings to be processed might be 30–45 min/subject; over a 20‐subject study, this amounts to a considerable amount of processing. To make the estimate of the TR as fast as possible while maintaining accuracy, a multistage process was used. An initial pass narrowed down the range of possible TRs; later passes progressively refined it. In the first pass, the data were downsampled into 10‐ms bins and the autocorrelation was then carried out over the full range given by the user. A second pass was then carried out in which the data were downsampled into 1‐ms bins and autocorrelation was carried out over a 20‐ms range. A third pass used 0.1‐ms bins over a 2‐ms range, and a fourth used 0.01‐ms bins over a 0.2‐ms range. The result from this fourth pass was taken as the TR. Each autocorrelation was carried out on a window that was three TRs long at the sample rate used. The starting point for the autocorrelation was chosen randomly on each trial, subject to the constraint that at enough data followed it for the autocorrelation with the longest lag to be carried out. These parameters were chosen based on informal pilot work. In the default mode, the mean of three estimates of the TR was used.
Using TR to estimate scan times
An estimate of one cycle of scanner sound was taken as one (estimated) TR after a reference point in the center of the input sound. This chunk will not necessarily correspond to a single scan from beginning to end but is more likely to be part of one scan and the start of the next; however, this is not important to the cancellation procedure. This single cycle is then correlated with points around one TR earlier in the input sound. The range around the TR is given by a parameter in the user interface (parameter “Test range,” default, ± 5 samples). The position at which the cycle correlates most highly is taken as the position of the preceding scan; using this new starting position, the search procedure is repeated to identify the scan before this one, and so on. When the start of the sound file is reached, a forward search is initiated from the midpoint.
Calculate estimate of scanner noise
After the times of the cycle starts have been identified an estimate of the sound from the scanner is calculated by taking a mean of the sound for one TR after each start position. However, some of these samples will contain not just scanner noise but also speech, and this will add noise to our mean and reduce effectiveness of the cancellation procedure. In an attempt to identify the scans without speech, the correlation between the mean and each scan was calculated. The mean will reflect predominantly scanner noise, and so the best correlation should be with those scans that only contain this. After this mean is calculated, a second stage selects just a certain proportion (given by parameter “Generate mean from most typical,” default value 50%) of the cycles with the highest correlations to this mean. These selected scans are then used to recalculate a new estimate of the scanner noise.
Subtract estimate from waveform
Finally, we subtract the estimate of the scanner noise from the input waveform at each cycle start point.
Recording of Sounds
We used a microphone built into a sound system provided by the MRC Institute of Hearing Research, Nottingham, UK. Sounds were recorded using a DAT recorder (16‐bit mono, sample rate 44.1 kHz) and converted to PC WAV format, preserving the sample rate and bit depth. The cancellation tool is implemented entirely in Visual Basic 6 (Microsoft, Redmond, WA). The recordings were taken from a 3‐Tesla Bruker MedSpec MRI scanner at the Wolfson Brain Imaging Center in Cambridge. It was carrying out echo‐planar imaging (EPI) acquisitions of 21 slices with a matrix size of 64 × 64, voxel bandwidth of 200 kHz, and a TR of 1.1 s. To investigate whether lossy compression algorithms (which degrade the waveform fidelity somewhat) would hamper noise cancellation, we tried copying a file to a common recording device that uses such a method (Sony Minidisc) and then back off onto a computer. All copying was carried out digitally.
Assessment of Performance
The most straightforward measure of cancellation performance is an estimate of the improvement in signal‐to‐noise. To get a quantitative measure of the reduction, we took 10 samples spaced by approximately 25 s, each of which was 3‐s long, and calculated the root‐mean‐square (RMS) level. This was then converted to decibels. Finally, we examined the spectrum of a portion of scanner noise after it had been canceled to examine the nature of signal parts for which cancellation was not effective. This was carried out by taking the average of power spectra of 10 consecutive portions of scanner noise that were 4,096 samples long.
RESULTS
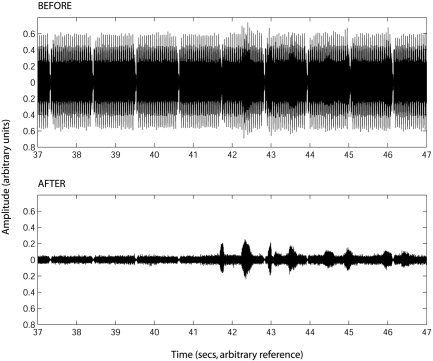
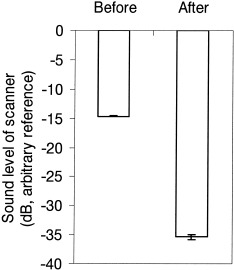
Figure 2 shows the waveform of a typical portion of the sounds before and after cancellation, covering both a section where there is only scanner noise (before 41.5 s), and a section where there was speech and scanner noise (after 41.5 s). The reduction in the level of the scanner noise is clearly visible; the level of the speech should be unaffected by the cancellation procedure. Subjectively, there was a great improvement in the intelligibility of the speech (for examples, see http://www.mrc-cbu.cam.ac.uk/~rhodri. cusack/scannersoundcancellation) Loud speech that was just intelligible before cancellation became clear. Quiet speech that was inaudible before cancellation became intelligible. The quantitative measure showed a reduction in scanner level by a little more than 21 dB (see Fig. 3). A paired‐sample t‐test across the 10 samples showed the effect of cancellation was highly significant (t[9] = 63.7, P < 0.001).
Figure 2.

Sound waveforms before and after cancellation. After cancellation, the speech waveform is clearly visible.
Figure 3.

The root‐mean‐square levels of the scanner noise before and after cancellation.
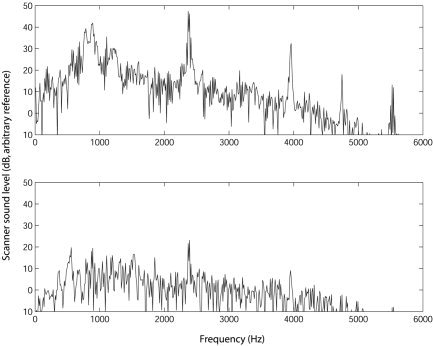
To examine the nature of the parts of the signal for which cancellation was not effective, we calculated the power spectrum of the scanner noise before and after cancellation. This is shown in Figure 4. It can be seen that the broad energy around 1 kHz and the narrowband peaks at around 2.5, 4, 4.8, and 5.5 kHz have been attenuated substantially. After cancellation, there are a few peaks remaining, but the spectrum is much closer to being white, suggesting sources of noise that are not predictable. Copying sounds via Minidisc did not impair cancellation: levels relative to arbitrary reference after cancellation for scanner noise only were −26.3 dB (direct) and −26.4 dB (copied via Minidisc), and after cancellation for scanner noise and speech were −20.1 dB (direct) and −20.1 dB (copied via Minidisc).
Figure 4.

Spectrograms showing the scanner sound level as a function of frequency before and after cancellation.
The routine has been tested with a file of 52 MB, and in principle there is no limit on the size it will process. It is relatively fast: on a 2‐GHz Intel Pentium III computer running Windows 2000, cancellation runs a little faster than real‐time, cancelling at a rate of 1.1 min of recording/min.
DISCUSSION
The algorithm presented capitalizes on a particular quality of MRI sound, its extreme regularity, to achieve substantial post‐hoc noise cancellation. Scanner noise in the processed files is attenuated substantially without distortion of other sounds. The procedure is relatively fast and operates almost without user intervention. The output files are more pleasant to listen to and speech in them is more intelligible. This tool may be useful for a range of studies, including those to directly study speech production and those where speech is used merely as a convenient response modality.
A distinction should be drawn between our post‐hoc tool and “active” noise cancellation systems, which attempt to cancel the noise in real‐time as it arrives at the participant's ears (e.g., http://www.ihr.mrc.ac.uk/research/technical/soundsystem/index.php; [Chen et al., 1999; McJury et al., 1997]. Our system only works on recordings, and does nothing to make the participant's time in the scanner more pleasant. However, there are some implications for active noise cancellation from our findings: as with our algorithm, cancellation systems rely upon the repeatability of the sound from scan‐to‐scan. Our findings suggest an upper limit for such repeatability of a little over 21 dB sound pressure level (SPL).
An alternative strategy to post‐hoc cancellation is to try to reduce the amount of noise initially present. Considerable effort has been applied already by MR manufacturers to develop acoustic damping, and designs in which the forces generated by the coils are lessened [e.g., McJury and Shellock, 2000]. Another approach is to try to reduce forces by using weaker gradients, although this inevitably leads to slower acquisition.
It might be possible to develop the cancellation tool further by considering higher orders of repeatability. Although each scan is fairly similar to the last, it might be that there are more slowly varying modes of variation; for example, odd and even scans might have slightly different characteristics. Principal components analysis could be carried out on the residuals after cancellation to see if these show any temporal patterning. If there was temporal patterning, this would provide a potential way to improve active as well as retrospective noise cancellation.
Although noise cancellation does make it easier to use tasks with a verbal response in functional imaging studies, it should be remembered that there are other significant disadvantages and it will certainly not always be the best mode. In particular, some brain movement will be generated by articulatory system movement. Rigid body movement is usually corrected for in fMRI analysis, but there remain slightly changing patterns of distortion that will introduce noise into the time series [Andersson et al., 2001; Hutton et al., 2002]. Despite this problem, acceptable power can be obtained and activations can be shown different from movement artefacts using differences in their temporal characteristics [e.g., Huang et al., 2002].
Our algorithm is successful because the sound from the scanner is regular in time and repeatable across the acquisitions of different volumes. Although in the present study we have only evaluated the performance of the algorithm on the cancellation of sound from a scanner made by a single manufacturer, we expect that these requirements will be met for other MR scanners and cancellation performance to be similar. However, it will be substantially less effective for acquisition sequences that do not have a regular pattern, such as those using cardiac triggering.
We tested two recording devices (a DAT recorder and a Sony Minidisc) and both were suitable. Other devices with similar fidelity (e.g., digital recording through a soundcard onto a laptop) should show similar performance. Devices with lower fidelity (e.g., analogue audiotape) may provide worse cancellation performance.
In conclusion, post‐hoc noise cancellation using algorithms such as those described here add a useful tool to the armory of the MRI researcher.
Acknowledgements
We thank D. Hall (MRC Institute of Hearing Research, Nottingham, UK) for measuring the sound level of the scanner at the Wolfson Brain Imaging Center.
REFERENCES
- Andersson JL, Hutton C, Ashburner J, Turner R, Friston K (2001): Modeling geometric deformations in EPI time series. Neuroimage 13: 903–919. [DOI] [PubMed] [Google Scholar]
- Chen CK, Chiueh TD, Chen JH (1999): Active cancellation system of acoustic noise in MR imaging. IEEE Trans Biomed Eng 46: 186–191. [DOI] [PubMed] [Google Scholar]
- Crosson B, Sadek JR, Maron L, Gokcay D, Mohr CM, Auerbach EJ, Freeman AJ, Leonard CM, Briggs RW (2001): Relative shift in activity from medial to lateral frontal cortex during internally versus externally guided word generation. J Cogn Neurosci 13: 272–283. [DOI] [PubMed] [Google Scholar]
- Demolin D, Hassid S, Metens T, Soquet A (2002): Real‐time MRI and articulatory coordination in speech. C R Biol 325: 547–556. [DOI] [PubMed] [Google Scholar]
- Ettema SL, Kuehn DP, Perlman AL, Alperin N (2002): Magnetic resonance imaging of the levator veli palatini muscle during speech. Cleft Palate Craniofac J 39: 130–144. [DOI] [PubMed] [Google Scholar]
- Fiez JA (2001): Neuroimaging studies of speech an overview of techniques and methodological approaches. J Commun Disord 34: 445–454. [DOI] [PubMed] [Google Scholar]
- Hall DA, Haggard MP, Akeroyd MA, Palmer AR, Summerfield AQ, Elliott MR, Gurney EM, Bowtell RW (1999): “Sparse” temporal sampling in auditory fMRI. Hum Brain Mapp 7: 213–223. [DOI] [PMC free article] [PubMed] [Google Scholar]
- Heim S, Opitz B, Friederici AD (2002): Broca's area in the human brain is involved in the selection of grammatical gender for language production: evidence from event‐related functional magnetic resonance imaging. Neurosci Lett 328: 101–104. [DOI] [PubMed] [Google Scholar]
- Huang J, Carr TH, Cao Y (2002): Comparing cortical activations for silent and overt speech using event‐related fMRI. Hum Brain Mapp 15: 39–53. [DOI] [PMC free article] [PubMed] [Google Scholar]
- Hutton C, Bork A, Josephs O, Deichmann R, Ashburner J, Turner R (2002): Image distortion correction in fMRI: a quantitative evaluation. Neuroimage 16: 217–240. [DOI] [PubMed] [Google Scholar]
- Jezzard P, Clare S (1999): Sources of distortion in functional MRI data. Hum Brain Mapp 8: 80–85. [DOI] [PMC free article] [PubMed] [Google Scholar]
- Kircher TT, Liddle PF, Brammer MJ, Williams SC, Murray RM, McGuire PK (2002): Reversed lateralization of temporal activation during speech production in thought disordered patients with schizophrenia. Psychol Med 32: 439–449. [DOI] [PubMed] [Google Scholar]
- McJury M, Shellock FG (2000): Auditory noise associated with MR procedures: a review. J Magn Reson Imaging 12: 37–45. [DOI] [PubMed] [Google Scholar]
- McJury M, Stewart RW, Crawford D, Toma E (1997): The use of active noise control (ANC) to reduce acoustic noise generated during MRI scanning: some initial results. Magn Reson Imaging 15: 319–322. [DOI] [PubMed] [Google Scholar]
- Palmer ED, Rosen HJ, Ojemann JG, Buckner RL, Kelley WM, Petersen SE (2001): An event‐related fMRI study of overt and covert word stem completion. Neuroimage 14: 182–193. [DOI] [PubMed] [Google Scholar]
- Shellock FG, Ziarati M, Atkinson D, Chen DY (1998): Determination of gradient magnetic field‐induced acoustic noise associated with the use of echo planar and three‐dimensional, fast spin echo techniques. J Magn Reson Imaging 8: 1154–1157. [DOI] [PubMed] [Google Scholar]
- Stone M, Davis EP, Douglas AS, Aiver MN, Gullapalli R, Levine WS, Lundberg AJ (2001): Modeling tongue surface contours from Cine‐MRI images. J Speech Lang Hear Res 44: 1026–1040. [DOI] [PubMed] [Google Scholar]


