

Abstract
The hippocampus is thought to play an important role in learning and memory processing, and impairments in memory, attention, and decision making are found commonly in schizophrenia. Although many studies have reported decreases in hippocampal volume in the left hemisphere in schizophrenia, regionally specific hippocampal volume loss has not been revealed consistently using volume analysis. Recently, many studies have analyzed shape asymmetry using 3‐D models; however, inconsistent results have been reported, mainly due to methodologic differences. We therefore used an active, flexible, deformable shape model for surface parameterization, and compared shape asymmetry based on principal component analysis (PCA) in the hippocampi of schizophrenic patients with those of the normal controls. Although the overall pattern of the statistical results did not change according to the number of principal components, the reconstructed results based on six major components were much more distinguishable. Although the left hemispheric hippocampal volume was larger than the right hemispheric was in this study, the difference was not significant. In shape asymmetry analysis, the right hemisphere hippocampus was bilaterally larger than the left hemisphere hippocampus was in the head of the superior CA1 and smaller in the tail and head of the inferior CA1. The asymmetry in the schizophrenia group was statistically smaller than that in the control group through reduction of the left hemisphere hippocampus volume. Hum Brain Mapp, 2005. © 2005 Wiley‐Liss, Inc.
Keywords: schizophrenia, hippocampal asymmetry, deformable model, alignment, PCA
INTRODUCTION
The hippocampus is thought to play an important role in learning and memory processing, and impairments in memory, attention, and decision making are found commonly in schizophrenia [Jessen et al., 2003; Weiss et al., 2003]. The lateralized specialization of the brain is well known and is thought to originate from evolutionary, developmental, hereditary, experiential, pathologic, and mental disorder‐related factors [Geschwind and Galaburda, 1985; Toga and Thompson, 2003]. Many studies have reported decreases in the left hemisphere (LH) hippocampal volume in schizophrenia [Bogerts et al., 1993; Breier et al., 1992; Rossi et al., 1994; Shenton et al., 1992] and meta‐analyses of such data suggest hippocampal volume reductions are bilateral in schizophrenia [Nelson et al., 1998]. As in previous studies, the left hippocampal volume in schizophrenia was associated with relatively more volumetric reduction than was the right hippocampus. Right hemisphere (RH) hippocampal volumes have been associated with age and illness duration in chronic schizophrenic patients [Velakoulis et al., 2001]. Furthermore, regionally specific hippocampal volume loss has been investigated in several studies based on the premise that hippocampal neuropathologic alterations may be more region specific [Becker et al., 1996; Bogerts et al., 1990, 1993; Csernansky et al., 1998; Hirayasu et al., 1998; Lieberman et al., 2001; Narr et al., 2001; Pegues et al., 2003; Rajarethinam et al., 2001; Shenton et al., 2002; Velakoulis et al., 2001].
Recently, 3‐D models have been applied to the analysis of the shape asymmetry involved in changes of hippocampal volume. High‐dimensional brain mapping to a triangulated model was used to determine bilateral deformations and asymmetry in the hippocampus head in schizophrenic patients [Csernansky et al., 2002; Wang et al., 2001]. Narr et al. [2001] obtained digitized points representing tissue boundaries, which were resampled and made spatially uniform by stretching a regular parametric grid over the surface. They found that significant asymmetries were present in the anterior hippocampal volumes in male subjects (RH > LH). Using an active, flexible, deformable shape model with spherical harmonic expansion, Shenton et al. [2002] reported that the major local regions responsible for the shape difference are in the tail of the hippocampus. Some previous studies have reported asymmetry of anterior hippocampal volumes, whereas others have reported asymmetry of posterior hippocampal volumes in schizophrenia groups. This discrepancy was due mainly to methodologic differences, i.e., different ways of generating models, describing measurements, carrying out statistical procedures, and eliminating unnecessary components from the analysis.
Principal component analysis (PCA) is concerned with explaining variance–covariance structure through linear combinations of the original variables. This analysis can identify patterns in data and express the data in such a way as to highlight their similarities and differences [Johnson and Wichern, 1992]. By reducing the number of dimensions and ignoring the components of lesser significance, hippocampal models can be reconstructed with consideration of the important patterns in the model. Wang et al. [2001] applied PCA to quantify the vector fields of the asymmetries on the hippocampal surface. They hypothesized that certain subsets of the basic functions would characterize the symmetry pattern, and chose two‐vector combinations according to the mean asymmetry measures.
In a previous study, we suggested a new parameterized surface model of the hippocampus, aligned to a single hippocampal template via a low‐dimensional transformation with the principal axis and a high‐dimensional transformation with the distance feature [Lee et al., 2004]. Our approach proved to give reliable correspondence within a group study. In this study, the magnitude of the difference of the distance feature was used as the asymmetry pattern. We believed that reconstructing this asymmetry pattern based on a few major principal components could make the results clearer.
The purpose of this study was to disclose the region‐specific asymmetry of the hippocampal model between control and schizophrenia groups using PCA. In addition, we investigated the relationship between the number of principal components and the reconstructed asymmetry pattern.
SUBJECTS AND METHODS
Subjects
Twenty‐two right‐handed schizophrenic patients (15 males, 7 females; mean age, 26.6 ± 6.5 years) were recruited from Seoul National University Hospital, Seoul, Korea. The normal control group was recruited using Internet advertisements, and consisted of 22 healthy subjects matched with the patient group for age (mean age, 26.2 ± 6.1 years), gender (15 males; 7 females), handedness, and parental socioeconomic status. The mean period of education between the groups was statistically different (schizophrenic: 13.1, standard deviation [SD] 1.7; control: 15.0, SD 1.4 years; P = 0.02) and in post‐hoc testing the educational periods of the schizophrenia group were ascertained to be shorter than were those of the control group. Mean parental socioeconomic status [Hollingshead and Redlich, 1958] was not significantly different (schizophrenic: 3.4, SD 0.7; control: 3.0, SD 0.7). All patients were interviewed using the Structured Clinical Interview for Diagnostic and Statistical Manual of Mental Disorders, fourth edition (DSM‐IV) [1994] and met the criteria for schizophrenia. None of the patients or controls had a lifetime history of neurologic or significant medical illnesses, or substance abuse. None of the controls had a lifetime history of DSM‐IV Axis I disorders. Symptom severity of the patients was rated on the Positive and Negative Syndrome Scale [Kay et al., 1987]. Thirteen patients with schizophrenia were drug naive, and nine patients had a history of neuroleptic medications; however, all patients had remained psychotropic drug free for at least 4 weeks before being recruited. The mean duration of illness in the schizophrenia group was 3.7 years (SD 4.7). This study was carried out under guidelines for the use of human subjects established by the institutional review board. All subjects gave written informed consent for the procedures before their participation in the study [Kim et al., 2003; Kwon et al., 2003].
Magnetic Resonance Imaging
Magnetic resonance (MR) scans of the entire brain were obtained using a 1.5‐T General Electric SIGNA System (GE Medical Systems, Milwaukee, WI), with a 3D‐SPGR T1‐weighted spoiled gradient echo pulse sequence with the following parameters: 1.5 mm sagittal slices; echo time = 5.5 ms; repetition time = 14.4 ms; number of excitations = 1; rotation angle = 20 degrees; field of view = 21 × 21 cm; and matrix = 256 × 256. Images were resampled to 1.0 mm3 voxels.
MR images were processed using the image‐processing software package Analyze v. 4.0 (Mayo Foundation, USA), resampled to 1.0 mm3 voxels, reoriented to the conventional position, and spatially normalized to align the anterior–posterior axis of the brain parallel to the intercommissural line, with the other two axes aligned along the interhemispheric fissure. The datasets were filtered using anisotropic diffusion methods with five iterations to improve the signal‐to‐noise ratio [Kim et al., 2003; Kwon et al., 2003].
Image Preparation and Hippocampal Modeling
Hippocampi were manually traced onto all of the coronal slices, with the references of the sagittal or axial planes, using the Analyze region‐of‐interest (ROI) module. The boundaries of the hippocampus were defined using a minor modification of the method reported previously [Pantel et al., 2000]. To assess interrater reliability, tracing was carried out independently on a set of 10 MR scans by two raters and the volumes of the traced regions were measured automatically. The intraclass correlation coefficients (ICCs) were calculated and found to be high: 0.89/0.90 for the left/right side of the hippocampus [Kwon et al., 2003]. The following overall preprocessing flow is displayed in Figure 1. After pruning all except the hippocampal volume from the entire brain volume, the smoothed and clipped volume was converted into binary to discriminate the boundary. An active, flexible, deformable shape model, developed originally by MacDonald et al. [2000], was used for cortical surface parameterization. The deformation process was carried out based on an objective function, which was a weighted sum of several different terms, such as Image, Stretch, Self‐proximity, and Inter‐surface proximity terms. The optimal parameterized model was obtained by minimizing this objective function, with the hippocampal surface consisting of 2,562 points per object. All parameterized shape models were obtained for each hippocampal dataset by the same algorithm. This procedure is described in detail in our previous study [Lee et al., 2004].
Figure 1.
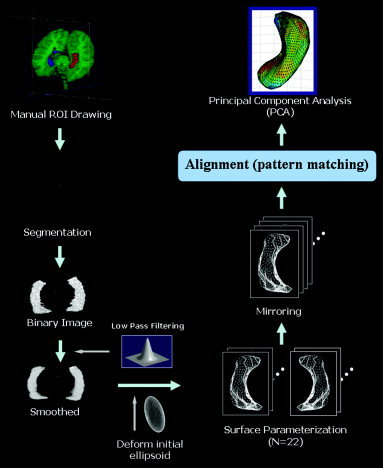
Overview of data preprocessing. The hippocampal data were extracted using the Analyze v4.0 program, and clipped and smoothed for further processing. The extracted and smoothed hippocampus was rendered to a 3‐D volume. The surface of the hippocampus was parameterized to consist of 2,562 points.
Alignment
First, the target model of the left hippocampus with a normal distribution was obtained from a normal control subject but not included in the test dataset. To find homologous points, the left hippocampi were aligned to a single left hippocampus (Fig. 2). The mirrored right hippocampi were then aligned to the contralateral left‐aligned hippocampus. For each group g, the asymmetry vector field u (g,x) was obtained from
| (1) |
where n is a vertex number, k is a subject number, and u , u the mean distance fields, which are calculated from the center of the hippocampal model to the boundary, in the right and left models, respectively. The asymmetry measurement M, calculated by subtracting the right hippocampal distance field from the left, is ‖u (g,x)‖. The alignment process consisted of two steps, the coarse and fine alignments. The coarse alignment was based on the main axis and the fine alignment was based on the mean squared difference. The vertex of the source had the same index as the target did through reindexing. Each subject had the same single template domain and homologous points. The details of the alignment process have been described in our previous study [Lee et al., 2004].
Figure 2.
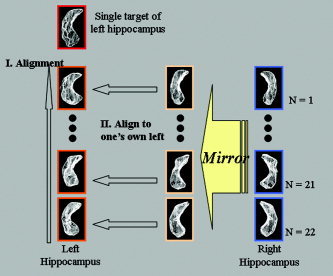
The left hemisphere (LH) hippocampi were aligned to a single target of an LH hippocampus that was selected arbitrarily from the control group to find homologous points. The mirrored right hemisphere (RH) hippocampi were then aligned to the contralateral LH‐aligned hippocampi.
Asymmetry Measures via PCA
To quantify the asymmetries of the hippocampus described by the magnitude of the vector fields for all subjects, we carried out PCA on the hippocampal data to reduce the dimensionality of the parameter space from the number of surface vertices, n, to the number of subjects, N. We then defined asymmetry measurement matrix M g=[M ,…,M N g] where M is 1‐by‐n column vector {‖u (g,x)‖,…,‖u (g,x)‖}. The covariance structure for the measurement matrix can be defined as follows:
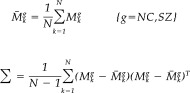 |
(2) |
We numerically estimated the eigenvector matrix E of dimension N‐by‐N and the eigenvalue vector {λ1, …, λN} corresponding to each eigenvector by using singular value decomposition on the measurement matrix M g.
For the between‐group comparison of hippocampal asymmetry, the q eigenvectors were selected according to the following equation and predefined pwr ratio:
| (3) |
The projection and reconstruction of the asymmetry matrix in the newly found eigenvector dimension can then be defined as:
| (4) |
where T is projected data, E* is a subset of E whose unwanted eigenvectors were zero‐padded, and M g* was reconstructed data with the contribution by unwanted eigenvectors removed. The surfaces of the single objects were parameterized, providing a point‐to‐point correspondence between the homologous surface points. The statistic on shape asymmetry, then, was based on a simple t‐test.
Statistical Analysis of Group Differences
To carry out the t‐test on the values of the discrete vertex, the values must have a Gaussian distribution. If the distribution of values were not Gaussian, this would be a case of multiple comparisons, which would necessitate a correction such as a Bonferroni correction or the use of a nonparametric test.
We overcame the limitation of not being able to apply a simple t‐test directly to the values of the discrete vertex using diffusion Gaussian smoothing [Chung et al., 2003]. The values for the measures of asymmetry were distributed as a Gaussian random variable on the hippocampal surfaces. We carried out diffusion smoothing with a 3‐mm full‐width half‐maximum (FWHM) diffusion Gaussian kernel for 100 iterations. If the iteration step size was large, the distance became unstable and a singularity (white spot) began to appear. Statistical inferences could then be based on simple t‐tests with no correction for multiple comparisons.
RESULTS
Asymmetry of Volume
As reported in our previous study, the hippocampal volume was reduced bilaterally in schizophrenic patients compared to that in normal controls (Table I) [Lee et al., 2004]. Although the right volume is larger than the left is in schizophrenia and the left volume of healthy controls is larger than that in the right, as shown in Table I, it is difficult to interpret the hippocampal asymmetry nonstatistically. We can presume that, in general, the asymmetry of volume was decreased in schizophrenia compared to asymmetry of volume in the healthy controls. The smaller areas in schizophrenia mean that the degree of asymmetry in schizophrenia was smaller than in the healthy controls. In other words, where generally there must have an asymmetry, it was not apparent.
Table I.
Hippocampal volume in schizophrenic patients and normal controls
| Hippocampus | Age (yr) | Volume cm3 | |
|---|---|---|---|
| Left | Right | ||
| Schizophrenia (n = 22) | 26.6 ± 6.5 | 2.836 ± 0.515 | 2.849 ± 0.552 |
| Control (n = 22) | 26.2 ± 6.1 | 3.338 ± 0.489 | 3.192 ± 0.514 |
Data are given as the mean ± SD. Statistical significance levels are based on paired sample t‐tests (P < 0.01). The hippocampal volume was bilaterally reduced in the schizophrenic patients compared to that in normal controls.
Asymmetry of Shape Using PCA
The shape asymmetry analysis using the mean square difference (MSD) showed that the RH hippocampus was bilaterally larger than the LH hippocampus was in the head of the superior CA1, and smaller in the tail and head of the inferior CA1. In both the control and the schizophrenia groups, we observed larger LH hippocampi overall (Fig. 3); however, only a very small region was detected as statistically significant (Fig. 3c,f). The eigenvalue distributions were obtained in control and schizophrenia groups (Fig. 4). The low components, regarded as noise elements, were eliminated using the PCA. We selected the six dominant components, and the eigenvalue sums were more than 60% (control, 66.2%; schizophrenia, 68.2%). The subtle regions of L > R and R > L were more prominent in the reconstructed hippocampal data (Fig. 5). As shown in the statistically significant region (Fig. 5c,f), the shape asymmetry of the schizophrenia group was smaller in the head and middle of the superior subiculum, CA3/CA4, and the tail of the inferior CA1.
Figure 3.
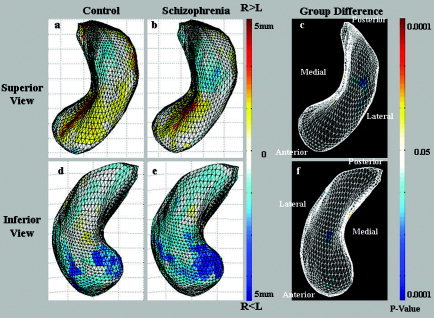
The mean square difference (MSD) results are illustrated in the control (a, d) and the schizophrenia (b, e) groups. The group differences of shape asymmetry are presented in c and f. In both cases, the shape asymmetry is mapping onto the right hemisphere (RH) average hippocampal model. The regions in which the RH hippocampus is larger than is the left hemisphere (LH) hippocampus are noted in red. In particular, the RH hippocampus was bilaterally larger than the LH hippocampus was in the head of the superior CA1 (a, b); however, we showed that the superior aspect of the LH hippocampi was large in both control and schizophrenia groups (d, e), but was not statistically significant (c, f).
Figure 4.

Distribution of the eigenvalues in the control and schizophrenia groups through principal component analysis. The hippocampal model was reconstructed with six eigenvalues and the eigenvectors of the 22 principal components.
Figure 5.
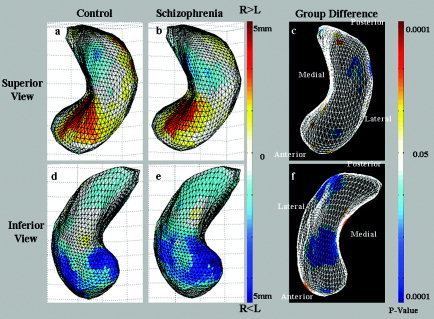
Shape asymmetry of the hippocampus for control (a, d) and schizophrenia groups (b, e) through principal component analysis. The subtle regions of L > R and R > L are prominent. As shown in c and f, the shape asymmetry of the schizophrenia group was smaller in the head and middle of the superior subiculum, CA3/CA4, and in the tail of the inferior CA1.
DISCUSSION
Number of Subjects
Each of the schizophrenic and normal control groups had 22 subjects consisting of 15 males and 7 females. All patients were interviewed with the Structured Clinical Interview for DSM‐IV and met those criteria for schizophrenia. We carefully selected normal control subjects to match the patient group for age, gender, handedness, and parental socioeconomic status. Although this study could not reveal a gender effect because of the small dataset, it was controlled for gender by matching the numbers of male and female subjects. Our previous studies showed good results with the same dataset [Kwon et al., 2003; Lee et al., 2004].
Volume and Shape Asymmetry Comparison of Schizophrenia Subjects and Normal Controls
The RH hippocampal volume has been shown to be larger than the LH in both control and schizophrenia groups in many previous studies [Csernansky et al., 1998, 2002; Narr et al., 2001; Pegues et al., 2003]. Pruessner et al. [2000] pointed out that the vast majority had either normative R > L asymmetry or no left–right differences. Although the LH hippocampal volume was larger than that of the RH in our study, there was no significant difference in terms of volume. A global shape difference caused by an overall volume difference should be removed to represent the local asymmetry. Shenton et al. [2002] reported that the major local regions responsible for the shape difference between the healthy controls and the schizophrenia groups are in the tail. Another interesting study reported that the LH hippocampus was larger than the RH was in the head of the CA1/CA2. The area in which the LH hippocampus is smaller than the RH was revealed overall [Csernansky et al., 2002; Wang et al., 2001].
As we have only the imaging data, it is difficult to interpret precisely the subfields of the hippocampus. We followed the definition of the areas from the illustration in the study by Posener et al. [2003], which showed global areas such as CA1–2 and the tail of the subiculum. On the control map, the subfield CA1 accounted for much of the hippocampal head and for the lateral and posterior edges of the hippocampal body and tail. The subiculum accounts for a smaller region in the medial part of the head and body of the hippocampus. This is best seen in the inferior view, because the subiculum is covered partially by the dentate gyrus and subfields CA3 and CA4 in the superior view. In this study, we found that the RH hippocampus was unilaterally smaller than the LH hippocampus was in the tail of the superior CA1, and that the RH hippocampus was larger in the region of the superior head in both control and schizophrenia groups (Fig. 5a,b,d,e). Although the findings are similar to the results of Shenton et al. [2002], the significant regions were revealed at the head and middle of the superior subiculum, CA3/CA4, and the tail of the inferior CA1. In Figure 5 (c,f), the blue color indicates that the shape asymmetry in the schizophrenia group was smaller than it was in the control group. This region shows that the hippocampal volume is less in the LH than in the RH in schizophrenia [Bogerts et al., 1993; Breier et al., 1992; Rossi et al., 1994]. Harrison and Eastwood [2001] suggested that there was greater cellular volume loss and disorganization within CA3/CA4 and the subiculum. The anterior and posterior compartments of the hippocampus have distinct neural connections [Cavada et al., 2000; Goldman‐Rakic et al., 1984] and seem to be functionally dissociated [Lepage et al., 1998; Strange et al., 1999]. Hippocampal CA1 neurons that project to the medial prefrontal cortex are found predominantly in the head of the hippocampus [Barbas and Blatt, 1995; Carmichael and Price, 1995]. The abnormality in this area therefore provides support for hypotheses that schizophrenia involves a disturbance of the connections between the hippocampus and the prefrontal structures [Narr et al., 2001; Pegues et al., 2003; Weinberger et al., 1992].
Hippocampal Modeling and Alignment Methods
Several different methods have been suggested for modeling hippocampal shape. Shenton et al. [2002] used a spherical harmonic function for modeling and a 3‐D ellipsoid as the first‐order approximation of the structures for alignment. Thompson et al. [1996, 2004] made the manually derived contours spatially uniform by modeling them as a 3‐D parametric surface mesh. Csernansky et al. [2002] modeled the surface of the template hippocampus and determined the corresponding target points using a higher dimensional transformation. Although the performance of these approaches depends mainly on the accuracy of the transformation and manually placed landmarks, our approach, which obtains each surface model from manually delineated data and is aligned in two steps, depends predominantly on the manual delineation procedure. As the manual delineation procedure was examined carefully, the modeling and the correspondence were more reliable [Lee et al., 2004]. The study region of our previous study, the anterior and midbody CA1 and CA2 hippocampal region, was similar to the results of Narr et al. [2004].
We have the limitation that the isolating locations of asymmetries using root MSD did not accord with the true anatomy of the hippocampus. It is, nevertheless, too small a mismatched location error to affect the result. We therefore did not only obtain good result in our previous study [Lee et al., 2004] but also in many subsequent studies [Shenton et al., 2002; Wang et al., 2001, 2003].
Reconstruction With the Selected Principal Components
The most general methodology in the analysis of raw data is in itself shape analysis. The raw hippocampal data comprised not only a shape pattern, but also a modeling error and the noise originating from the partial volume effect. It is difficult to confirm the veracity of raw data without “ground truth.” Recently, many researchers have used component analysis to overcome this limitation and to find ground truth [Joshi et al., 2002; Shen et al., 2001; Wang et al., 2003]. Independent component analysis (ICA) is a statistical and computational technique for revealing hidden factors that underlie sets of random variables, measurements, or signals. The method of ICA did not define the prior knowledge for selecting the independent component in the shape analysis. We therefore used PCA to eliminate the unnecessary components such as errors and noises using the eigenvalue. The principal components were selected through the ratio of accumulation about the total summation of eigenvalues as shown in Figure 4.
The statistical results were evaluated according to the number of principal components (Fig. 6). As expected, the overall pattern of the statistical results did not change according to the number of principal components. As the information from the asymmetry pattern should be preserved, we selected the six dominant components; the sum of the eigenvalues was more than 60% (control, 66.2%; schizophrenia, 68.2%). As shown in Figure 4, the distribution of eigenvalues diminished rapidly after the sixth component. The eigenvalues of the low components below 60% revealed smaller values and gradients of variance than did the total sum values of the eigenvalues. Although we selected the number of components arbitrarily, there was reasonable rationale to select the principal components through the histogram of eigenvalue distribution (Fig. 4) and observing the changes of the results according to the changes in the numbers of eigenvectors (Fig. 6). The unnecessary components such as noise and modeling errors could be reduced effectively by removing the lower components.
Figure 6.
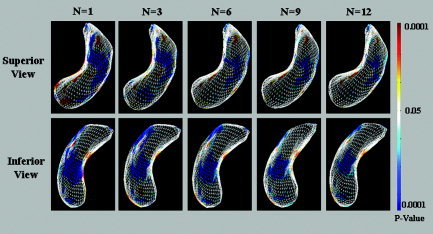
Changes in the results according to the number of the principal components. N is the number of principal components used in the reconstruction. There was more localization of regions until the sixth principal component, but there were no differences after the sixth component.
In summary, we obtained a parameterized surface model of the hippocampus using a multiple‐surface algorithm, aligned all the hippocampal surface data into the target hippocampus using a surface pattern‐matching algorithm, and compared the shape asymmetry in the hippocampus of the schizophrenic patients with those of the controls, based on the distance map, using PCA. Our findings were similar to previous studies, i.e., the smaller LH hippocampus in the tail of the superior CA1. The asymmetry of the schizophrenia group was smaller than that of the control group because of the LH hippocampus volume reduction. We believe that our PCA study offered criteria for reconstructing hippocampal models with selected principal components.
Acknowledgements
This research was supported by the Brain Research Center of the 21st Century Frontier Research Program, funded by the Ministry of Science and Technology of the Republic of Korea (M103KV01001403K220101420).
REFERENCES
- Barbas H, Blatt GJ (1995): Topographically specific hippocampal projections target functionally distinct prefrontal areas in the rhesus monkey. Hippocampus 5: 511–533. [DOI] [PubMed] [Google Scholar]
- Becker T, Elmer K, Schneider F, Schneider M, Grodd W, Bartels M, Heckers S, Beckmann H (1996): Confirmation of reduced temporal limbic structure volume on magnetic resonance imaging in male patients with schizophrenia. Psychiatry Res 67: 135–143. [DOI] [PubMed] [Google Scholar]
- Bogerts B, Ashtari M, Degreef G, Alvir JM, Bilder RM, Lieberman JA (1990): Reduced temporal limbic structure volumes on magnetic resonance images in first episode schizophrenia. Psychiatry Res 35: 1–13. [DOI] [PubMed] [Google Scholar]
- Bogerts B, Lieberman JA, Ashtari M, Bilder RM, Degreef G, Lerner G, Johns C, Masiar S (1993): Hippocampus‐amygdala volumes and psychopathology in chronic schizophrenia. Biol Psychiatry 33: 236–246. [DOI] [PubMed] [Google Scholar]
- Breier A, Buchanan RW, Elkashef A, Munson RC, Kirkpatrick B, Gellad F (1992): Brain morphology and schizophrenia. A magnetic resonance imaging study of limbic, prefrontal cortex, and caudate structures. Arch Gen Psychiatry 49: 921–926. [DOI] [PubMed] [Google Scholar]
- Carmichael ST, Price JL (1995): Limbic connections of the orbital and medial prefrontal cortex in macaque monkeys. J Comp Neurol 363: 615–641. [DOI] [PubMed] [Google Scholar]
- Cavada C, Company T, Tejedor J, Cruz‐Rizzolo RJ, Reinoso‐Suarez F (2000): The anatomical connections of the macaque monkey orbitofrontal cortex. A review. Cereb Cortex 10: 220–242. [DOI] [PubMed] [Google Scholar]
- Chung MK, Worsley KJ, Robbins S, Paus T, Taylor J, Giedd JN, Rapoport JL, Evans AC (2003): Deformation‐based surface morphometry applied to gray matter deformation. Neuroimage 18: 198–213. [DOI] [PubMed] [Google Scholar]
- Csernansky JG, Joshi S, Wang L, Haller JW, Gado M, Miller JP, Grenander U, Miller MI (1998): Hippocampal morphometry in schizophrenia by high dimensional brain mapping. Proc Natl Acad Sci USA 95: 11406–11411. [DOI] [PMC free article] [PubMed] [Google Scholar]
- Csernansky JG, Wang L, Jones D, Rastogi‐Cruz D, Posener JA, Heydebrand G, Miller JP, Miller MI (2002): Hippocampal deformities in schizophrenia characterized by high dimensional brain mapping. Am J Psychiatry 159: 2000–2006. [DOI] [PubMed] [Google Scholar]
- Geschwind N, Galaburda AM (1985): Cerebral lateralization. Biological mechanisms, associations, and pathology: I. A hypothesis and a program for research. Arch Neurol 42: 428–459. [DOI] [PubMed] [Google Scholar]
- Goldman‐Rakic PS, Selemon LD, Schwartz ML (1984): Dual pathways connecting the dorsolateral prefrontal cortex with the hippocampal formation and parahippocampal cortex in the rhesus monkey. Neuroscience 12: 719–743. [DOI] [PubMed] [Google Scholar]
- Harrison PJ, Eastwood SL (2001): Neuropathological studies of synaptic connectivity in the hippocampal formation in schizophrenia. Hippocampus 11: 508–519. [DOI] [PubMed] [Google Scholar]
- Hirayasu Y, Shenton ME, Salisbury DF, Dickey CC, Fischer IA, Mazzoni P, Kisler T, Arakaki H, Kwon JS, Anderson JE, Yurgelun‐Todd D, Tohen M, McCarley RW (1998): Lower left temporal lobe MRI volumes in patients with first‐episode schizophrenia compared with psychotic patients with first‐episode affective disorder and normal subjects. Am J Psychiatry 155: 1384–1391. [DOI] [PubMed] [Google Scholar]
- Hollingshead AB, Redlich FC (1958): Social class and mental illness: a community study. New York: John Wiley and Sons. [DOI] [PMC free article] [PubMed] [Google Scholar]
- Jessen F, Scheef L, Germeshausen L, Tawo Y, Kockler M, Kuhn KU, Maier W, Schild HH, Heun R (2003): Reduced hippocampal activation during encoding and recognition of words in schizophrenia patients. Am J Psychiatry 160: 1305–1312. [DOI] [PubMed] [Google Scholar]
- Johnson RA, Wichern DW (1992): Applied multivariate statistical analysis, 3rd ed. NJ: Prentice Hall; 642 p. [Google Scholar]
- Joshi S, Pizer S, Fletcher PT, Yushkevich P, Thall A, Marron JS (2002): Multiscale deformable model segmentation and statistical shape analysis using medial descriptions. IEEE Trans Med Imaging 21: 538–550. [DOI] [PubMed] [Google Scholar]
- Kay SR, Fiszbein A, Opler LA (1987): The positive and negative syndrome scale (PANSS) for schizophrenia. Schizophr Bull 13: 261–276. [DOI] [PubMed] [Google Scholar]
- Kim JJ, Youn T, Lee JM, Kim IY, Kim SI, Kwon JS (2003): Morphometric abnormality of the insula in schizophrenia: a comparison with obsessive‐compulsive disorder and normal control using MRI. Schizophr Res 60: 191–198. [DOI] [PubMed] [Google Scholar]
- Kwon JS, Shin YW, Kim CW, Kim YI, Youn T, Han MH, Chang KH, Kim JJ (2003): Similarity and disparity of obsessive‐compulsive disorder and schizophrenia in MR volumetric abnormalities of the hippocampus‐amygdala complex. J Neurol Neurosurg Psychiatry 74: 962–964. [DOI] [PMC free article] [PubMed] [Google Scholar]
- Lee JM, Kim SH, Jang DP, Ha TH, Kim JJ, Kim IY, Kwon JS, Kim SI (2004): Deformable model with surface registration for hippocampal shape deformity analysis in schizophrenia. Neuroimage 22: 831–840. [DOI] [PubMed] [Google Scholar]
- Lepage M, Habib R, Tulving E (1998): Hippocampal PET activations of memory encoding and retrieval: the HIPER model. Hippocampus 8: 313–322. [DOI] [PubMed] [Google Scholar]
- Lieberman J, Chakos M, Wu H, Alvir J, Hoffman E, Robinson D, Bilder R (2001): Longitudinal study of brain morphology in first episode schizophrenia. Biol Psychiatry 49: 487–499. [DOI] [PubMed] [Google Scholar]
- MacDonald D, Kabani N, Avis D, Evans AC (2000): Automated 3‐D extraction of inner and outer surfaces of cerebral cortex from MRI. Neuroimage 12: 340–356. [DOI] [PubMed] [Google Scholar]
- Narr KL, Thompson PM, Sharma T, Moussai J, Blanton R, Anvar B, Edris A, Krupp R, Rayman J, Khaledy M, Toga AW (2001): Three‐dimensional mapping of temporo‐limbic regions and the lateral ventricles in schizophrenia: gender effects. Biol Psychiatry 50: 84–97. [DOI] [PubMed] [Google Scholar]
- Narr KL, Thompson PM, Szeszko P, Robinson D, Jang S, Woods RP, Kim S, Hayashi KM, Asunction D, Toga AW, Bilder RM (2004): Regional specificity of hippocampal volume reductions in first‐episode schizophrenia. Neuroimage 21: 1563–1575. [DOI] [PubMed] [Google Scholar]
- Nelson MD, Saykin AJ, Flashman LA, Riordan HJ (1998): Hippocampal volume reduction in schizophrenia as assessed by magnetic resonance imaging: a meta‐analytic study. Arch Gen Psychiatry 55: 433–440. [DOI] [PubMed] [Google Scholar]
- Pantel J, O'Leary DS, Cretsinger K, Bockholt HJ, Keefe H, Magnotta VA, Andreasen NC (2000): A new method for the in vivo volumetric measurement of the human hippocampus with high neuroanatomical accuracy. Hippocampus 10: 752–758. [DOI] [PubMed] [Google Scholar]
- Pegues MP, Rogers LJ, Amend D, Vinogradov S, Deicken RF (2003): Anterior hippocampal volume reduction in male patients with schizophrenia. Schizophr Res 60: 105–115. [DOI] [PubMed] [Google Scholar]
- Posener JA, Wang L, Price JL, Gado MH, Province MA, Miller MI, Babb CM, Csernansky JG (2003): High‐dimensional mapping of the hippocampus in depression. Am J Psychiatry 160: 83–89. [DOI] [PubMed] [Google Scholar]
- Press AP, editor (1994): Diagnostic and statistical manual of mental disorders, 4th ed. Washington, DC: American Psychiatric Association. [Google Scholar]
- Pruessner JC, Li LM, Serles W, Pruessner M, Collins DL, Kabani N, Lupien S, Evans AC (2000): Volumetry of hippocampus and amygdala with high‐resolution MRI and three‐dimensional analysis software: minimizing the discrepancies between laboratories. Cereb Cortex 10: 433–442. [DOI] [PubMed] [Google Scholar]
- Rajarethinam R, DeQuardo JR, Miedler J, Arndt S, Kirbat R, Brunberg JA, Tandon R (2001): Hippocampus and amygdala in schizophrenia: assessment of the relationship of neuroanatomy to psychopathology. Psychiatry Res 108: 79–87. [DOI] [PubMed] [Google Scholar]
- Rossi A, Stratta P, Mancini F, Gallucci M, Mattei P, Core L, Di Michele V, Casacchia M (1994): Magnetic resonance imaging findings of amygdala‐anterior hippocampus shrinkage in male patients with schizophrenia. Psychiatry Res 52: 43–53. [DOI] [PubMed] [Google Scholar]
- Shen D, Herskovits EH, Davatzikos C (2001): An adaptive‐focus statistical shape model for segmentation and shape modeling of 3‐D brain structures. IEEE Trans Med Imaging 20: 257–270. [DOI] [PubMed] [Google Scholar]
- Shenton ME, Gerig G, McCarley RW, Szekely G, Kikinis R (2002): Amygdala‐hippocampal shape differences in schizophrenia: the application of 3D shape models to volumetric MR data. Psychiatry Res 115: 15–35. [DOI] [PMC free article] [PubMed] [Google Scholar]
- Shenton ME, Kikinis R, Jolesz FA, Pollak SD, LeMay M, Wible CG, Hokama H, Martin J, Metcalf D, Coleman M, et al. (1992): Abnormalities of the left temporal lobe and thought disorder in schizophrenia. A quantitative magnetic resonance imaging study. N Engl J Med 327: 604–612. [DOI] [PubMed] [Google Scholar]
- Strange BA, Fletcher PC, Henson RN, Friston KJ, Dolan RJ (1999): Segregating the functions of human hippocampus. Proc Natl Acad Sci USA 96: 4034–4039. [DOI] [PMC free article] [PubMed] [Google Scholar]
- Thompson PM, Hayashi KM, De Zubicaray GI, Janke AL, Rose SE, Semple J, Hong MS, Herman DH, Gravano D, Doddrell DM, Toga AW (2004): Mapping hippocampal and ventricular change in Alzheimer disease. Neuroimage 22: 1754–1766. [DOI] [PubMed] [Google Scholar]
- Thompson PM, Schwartz C, Toga AW (1996): High‐resolution random mesh algorithms for creating a probabilistic 3D surface atlas of the human brain. Neuroimage 3: 19–34. [DOI] [PubMed] [Google Scholar]
- Toga AW, Thompson PM (2003): Mapping brain asymmetry. Nat Rev Neurosci 4: 37–48. [DOI] [PubMed] [Google Scholar]
- Velakoulis D, Stuart GW, Wood SJ, Smith DJ, Brewer WJ, Desmond P, Singh B, Copolov D, Pantelis C (2001): Selective bilateral hippocampal volume loss in chronic schizophrenia. Biol Psychiatry 50: 531–539. [DOI] [PubMed] [Google Scholar]
- Wang L, Joshi SC, Miller MI, Csernansky JG (2001): Statistical analysis of hippocampal asymmetry in schizophrenia. Neuroimage 14: 531–545. [DOI] [PubMed] [Google Scholar]
- Wang L, Swank JS, Glick IE, Gado MH, Miller MI, Morris JC, Csernansky JG (2003): Changes in hippocampal volume and shape across time distinguish dementia of the Alzheimer type from healthy aging. Neuroimage 20: 667–682. [DOI] [PubMed] [Google Scholar]
- Weinberger DR, Berman KF, Suddath R, Torrey EF (1992): Evidence of dysfunction of a prefrontal‐limbic network in schizophrenia: a magnetic resonance imaging and regional cerebral blood flow study of discordant monozygotic twins. Am J Psychiatry 149: 890–897. [DOI] [PubMed] [Google Scholar]
- Weiss AP, Schacter DL, Goff DC, Rauch SL, Alpert NM, Fischman AJ, Heckers S (2003): Impaired hippocampal recruitment during normal modulation of memory performance in schizophrenia. Biol Psychiatry 53: 48–55. [DOI] [PubMed] [Google Scholar]