

Abstract
We demonstrate that spatially accurate and selective stimulation is crucial when cortical functions are studied by the creation of temporary lesions with transcranial magnetic stimulation (TMS). Previously, the interpretation of the TMS results has been hampered by inaccurate knowledge of the site and strength of the induced electric current in the brain. With a Navigated Brain Stimulation (NBS) system, which provides real‐time magnetic resonance image (MRI)‐guided targeting of the TMS‐induced electric field, we found that TMS of a spatially restricted cortical S1 thenar area is sufficient to abolish sensation from a weak electric stimulation of the corresponding skin area. We demonstrate that with real‐time navigation, TMS can be repeatably directed at millimeter‐level precision to a target area defined on the MRI. The stimulation effect was temporally and spatially specific: the greatest inhibition of sensation occurred when TMS was applied 20 ms after the cutaneous test stimulus and the TMS effect was sensitive to 8–13 mm displacements of the induced electric field pattern. The results also indicate that TMS selectively to S1 is sufficient to abolish perception of cutaneous stimulation of the corresponding skin area. Hum Brain Mapp, 2005. © 2005 Wiley‐Liss, Inc.
Keywords: transcranial magnetic stimulation, navigated brain stimulation, blocking of sensation, somatosensory, S1, M1
INTRODUCTION
Transcranial magnetic stimulation (TMS) affects a localized region of neurons for a brief period by inducing weak electric currents in the cortex. Interpretation of TMS results has been complicated by inaccurate knowledge of the site of the applied magnetic stimulation. Without navigated stimulation systems, the target area of TMS causing visually detectable movements of body parts or responses in the electromyography has been assumed to be either the motor or sensorimotor area [e.g., Seyal et al.,1997; Harris et al.,2002]. Targeting other cortical areas has required one to move the coil a certain distance away from the motor area based on anatomical brain atlas information, or using the international 10–20 electroencephalography (EEG) system [e.g., McKay et al.,2003]. Such localization methods are not accurate and do not take into account individual differences in cortical anatomy.
The need to accurately apply TMS at a desired location has led to the development of navigated stimulation systems [Miranda et al.,1997; Krings et al.,1997; Chambers et al.,2004; Neggers et al.,2004; Rushworth et al.,2002]. The earlier MRI‐based navigation systems are limited to locating the coil. They all have the same principle. By digitizing landmarks of the subject's head and by transforming these locations onto the subject's MRI, it is possible to calculate the location of the coil with respect to the subject's head. These methods have not been able to define the exact amplitude (dose), location, distribution, and orientation of the TMS‐induced electric field in the cortex.
In the present study, we used a newly developed system, Navigated Brain Stimulation (NBS; Nexstim, Helsinki, Finland), which also utilizes individual MRI and real‐time navigation in positioning the TMS. Based on the understanding that TMS preferentially stimulates neurons located in the area where the induced current is strongest [Thielscher and Kammer,2002], NBS displays the cortical area being stimulated by highlighting the electric field maximum in the cortex. The NBS system allows the stimulated sites to be saved and recalled to enable reproducible stimulation of a desired cortical location.
NBS calculates the distribution and strength of the intracranial electric field. This computation takes into account the exact shape of the copper wiring inside the coil, the 3D position and orientation of the coil, and the overall shape of the head and the brain. The distribution of the induced electric field depends on the geometry of the stimulating coil, its location and orientation, as well as the shape of the head. Even slight tilting of the head under the coil may markedly change the location and strength of the intracranial neuronal activation. It is therefore important to locate the intracranial stimulation field in real time with respect to the anatomic structures of the brain. Although navigated TMS became common in 1997, the benefits of accurate coil positioning and modeling of the stimulating electric field with respect to MR images were recognized only by a few developers of the technology [e.g., Ilmoniemi and Grandori,1993; Ruohonen and Ilmoniemi,1996; Ilmoniemi et al.,1996; Thielscher and Kammer,2002].
Earlier studies reporting attenuation of cutaneous sensation by TMS of the cortex have involved stimulation of the sensorimotor cortex or have used non‐navigated TMS to locate the stimulation site [Cohen et al.,1991; Seyal et al.,1992,1997; Pascual‐Leone et al.,1994; Harris et al.,2002; McKay et al.,2003]. Therefore, it has remained unsettled whether it is the M1 or S1 that mediates the TMS‐induced attenuation of cutaneous sensation. The representation of sensory information in the primary somatosensory cortex (S1) in the postcentral gyrus is somatotopically arranged. The first objective of the present study was to determine the temporal and spatial specificity of the S1 representation of a sensation. Using NBS‐controlled TMS to accurately stimulate the S1 representation of a skin area, we studied whether it is possible to block the sensation of a cutaneous stimulus to that skin area. We applied NBS to determine if TMS of a spatially restricted area of the S1 cortex representing the thenar region is sufficient to abolish the sensation evoked by a weak electric stimulation of the corresponding skin area in the hand. The second objective of the present study was to investigate the reproducibility of the TMS effect with NBS. We demonstrate that with real‐time navigation, TMS can be repeatably directed to a desired cortical site, that the stimulation effect is sensitive to slight displacement of the induced electric field, and that TMS directed selectively to S1 is sufficient to abolish perception of cutaneous stimulation of the corresponding skin area.
SUBJECTS AND METHODS
For an overview of experimental procedures, see Figure 1.
Figure 1.
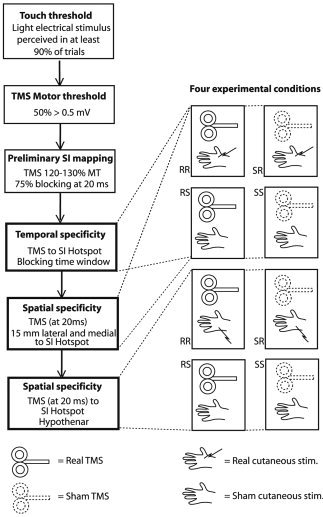
The experimental protocol. First, the touch threshold and the TMS motor threshold were determined. Then, using TMS of 120–130% MT, the S1 was preliminarily mapped to determine the hotspot where sensation of cutaneous stimulation was blocked in at least 75% of the trials. To determine the effectiveness and the time window of TMS directed to the hotspot, real TMS and real cutaneous stimulation (RR), sham TMS and real cutaneous stimulation (SR), real TMS and sham cutaneous stimulation (RS), and sham TMS and sham cutaneous stimulation (SS) conditions were presented in a counterbalanced manner at variable intervals between the TMS and cutaneous stimulation. Finally, the spatial characteristics of the TMS‐induced effect were tested by varying the cortical and cutaneous stimulation sites.
Subjects
Six right‐handed, paid volunteers (five males; average age 33 years) were recruited. All subjects signed an informed consent before participating in the experiment, which was approved by the ethical committee of the Helsinki University Central Hospital. One male subject was excluded because he was unable to report his sensations according to the instructions given. White noise delivered from headphones was used to mask auditory cues during the experiments. The subjects were tested during a period of about 4 h.
NBS‐Controlled TMS
A Magstim 200 monopulse stimulator (Magstim, Wales, UK) was connected with the NBS navigation system (Nexstim). The coil was the figure‐of‐eight Magstim model P/N9925 with a mean wing diameter of 70 mm. The NBS device locates the TMS coil with an optical tracking system that can recognize the TMS tracking tools with a precision of less than 1 mm. The NBS system takes into account the stimulation intensity, coil parameters, and the individual brain anatomy. The stimulation coil is modeled and the calculation of the intracranial electric field is based on the spherical model [Sarvas,1987; Tarkiainen et al.,2003], matched to the individual MRIs. The same sphere model has been used successfully in magnetoencephalography to locate brain activity. The sphere model does not take into account details of conductivity geometry, for example, the shape and conductivity of the skull, the cerebrospinal fluid, and the cortex. With the Magstim monophasic stimulator, the direction of the induced electric field is the direction opposite to the coil handle (orange arrow in Fig. 2). The electric field is visualized on a color‐coded map based on individual MR images, enabling the user to see in advance the exact cortical location being stimulated. The NBS system records the coil's orientation, location, and induced electric field for each stimulus pulse. The location and orientation of the coil used in any previous stimulation can be recalled and the software guides the user to position the coil with a 3D aiming tool, ensuring reproducible location and orientation (direction and angle) of all further stimulations.
Figure 2.
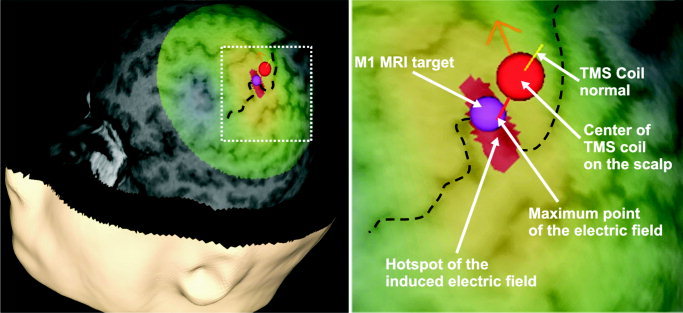
Cortical stimulation site in the M1 area of subject 1. Dashed black line = central sulcus; red‐yellow‐green area on the cortex = induced electric field (red area = stimulation hotspot); orange arrow = direction of the current; purple sphere = M1 target location.
Cutaneous Test Stimulation
Two Ag–AgCl skin electrodes (Ambu, Ballerup, Denmark) were fixed on the thenar area of the right hand and electro‐tactile stimuli were delivered via a Grass PSIU6 constant current stimulator (Grass Instruments, Quincy, MA) with a pulse duration of 0.5 ms at a stimulus intensity that was felt by the subject in at least 90% of the trials. The intensity ranged from 1.1–2.2 mA across subjects.
MI Hotspot Location
Mapping of the M1 cortex determined the optimal coil position to produce a motor response of the abductor pollicis brevis (APB) muscle. Coil orientation was such that the induced electric field was aimed at the motor cortex, anterior to the central sulcus. In the NBS software, the target point for the hand motor area was set on the left motor cortex prior to the session to allow for quick M1 thenar localization. In all subjects the optimal cortical location for APB muscle stimulation (M1 hotspot) was at the medial bend of the motor knob of the central sulcus (Fig. 2). The motor threshold (MT) was the lowest TMS intensity at which at least 5 out of 10 pulses to the optimal motor area resulted in a motor‐evoked potential (MEP) of 0.5 mV or greater. The average motor threshold was 47% (range, 40–55%) of the maximal output of the stimulator.
S1 Hotspot Location
To stimulate the S1 cortex, the TMS coil was rotated 180° so that the electric field was directed posterior to the central sulcus. TMS pulses and tactile stimuli were programmed with Presentation software (Neurobehavioral Systems, Albany, CA). Subjects were instructed to attend to the right thenar region and after each TMS pulse to answer “yes” if they felt a tactile stimulus, “no” if not, and “maybe” if they were uncertain. Initial mapping throughout the S1 area, with a TMS pulse intensity of 120% MT and a time delay of 20 ms from the cutaneous stimulus, determined where the sensation block of the contralateral thenar could be achieved. The location and orientation of the coil were preserved once consistent blocking resulted from stimulation of a particular S1 location.
For the remainder of the experiment, sham stimulus conditions were included. Subjects were told that there may or may not be a tactile stimulus delivered with every TMS pulse, and to again respond yes, no, or maybe following each TMS pulse. Four conditions comprised the TMS and tactile stimulus presentations (Fig. 1). Real TMS was 120% or 130% MT, and sham TMS was 20% of the maximum output intensity of the stimulator, corresponding to 36–50% of the individual MT. Condition RR (real TMS with real cutaneous stimulation) assessed the efficacy of the TMS‐induced inhibition. The lower the response rate (probability of feeling a cutaneous sensation), the more effective the TMS‐induced inhibition. Condition RS (real TMS with sham cutaneous stimulation) was used as a measure of the subject's response bias (or criterion). A response in this condition indicates that the subject rates noise as a signal (a sign of a low criterion), and the higher the response rate in this condition, the lower the criterion. This condition also tested whether TMS of the S1 induces tactile sensation. Condition SR (sham TMS with real cutaneous stimulation) verified the efficacy of cutaneous stimulation and constancy of stimulus conditions (to make sure that the electrodes are in good contact and that they are activating the cutaneous receptors). Additionally, condition SR was used as a comparison to condition RR when assessing the TMS‐induced change in discriminative capacity; i.e., if TMS produced a significant suppression of sensation, then cutaneous test stimuli were not felt as well in condition RR (real TMS) as in condition SR (sham TMS). Condition SS (sham TMS with sham cutaneous stimulation) and condition RS (real TMS with sham cutaneous stimulation) did not allow the subject to learn that a real or sham TMS pulse per se indicates occurrence of a cutaneous test stimulus. Furthermore, if TMS induces tactile sensations, then condition RS should produce significantly more responses than condition SS. Conditions were presented in random order, which changed between sequences. If condition SR (sham TMS with real cutaneous stimulation) did not reach a criteria level of at least 62.5% correct, the sequence was performed again. Sham conditions forced the subject to remain attentive and alert throughout the entire experiment.
Temporal Specificity of the NBS
Following initial mapping of the S1 thenar area, a sequence including all four conditions (8 RR‐stimuli, 4 RS, 4 SR, 4 SS; 20‐ms delay from cutaneous to magnetic stimulation) was delivered to the S1 hotspot to determine if 120% of MT was sufficient to cause at least 75% blocking. If not, 130% of MT was tried. This intensity was always sufficient in those subjects where 120% was not effective. The average stimulator output intensity used was 58% of maximal output. This TMS intensity was then used for the remainder of the experiment in conditions RR and RS.
Various intervals between the tactile stimulus and TMS pulse were tested. Blocks of sequences with different intervals between the cutaneous stimulus and the TMS were presented in a counterbalanced order (20, 50, 100, 150, 200, 250, 250, 200, 150, 100, 50, 20 ms). Each block of sequences consisted of 16 stimuli, four in each condition (RR, RS, SR, and SS). The numbers of studied intervals varied slightly across subjects because once blocking was no longer occurring, longer intervals were not administered. In three subjects the effect of TMS delivered at 0–20 ms before the cutaneous stimulus was also tested in a separate session.
Spatial Specificity of the NBS
To test the spatial distribution of the effect of the TMS pulse, two tests were performed. First, the coil was moved ∼15 mm rostrolaterally from the S1 hotspot, and a single sequence at an interval of 20 ms was presented. The single sequence was repeated after the coil was moved about 15 mm caudomedially from the S1 hotspot. Second, we investigated whether sensation from cutaneous stimulation applied to the hypothenar of the right hand was also inhibited during TMS of the S1 hotspot. For this purpose, two skin electrodes were fixed to the hypothenar of the right hand, and tactile threshold for this area was tested using the same procedure as previously described. Two sequences of 16 stimuli, at an interval of 20 ms between the cutaneous stimulus and TMS, were performed with TMS to the S1 hotspot while tactile stimuli were delivered to the hypothenar.
From the right APB muscle, EMG responses to 10 TMS pulses delivered to the S1 hotspot were recorded to determine if M1 was affected. The time between each TMS pulse was 4 s.
Reproducibility of the NBS‐Controlled TMS Effect
The reproducibility of the effects of the NBS‐controlled TMS was tested in three subjects. TMS pulses were delivered to the S1 hotspot that had been defined during the subjects' first TMS session and saved in the NBS system. TMS pulses of the same intensity as during the first session were delivered to the recalled target location, the S1 hotspot, 20 ms after the application of a cutaneous stimulus to the right thenar region. This was done to find out whether the NBS‐controlled TMS again produced at least 75% blocking of sensation of the cutaneous test stimuli as in the first session. The results obtained on the two different days (first and second TMS sessions) were compared to find out whether the attenuation of sensation produced by NBS‐controlled TMS of the S1 thenar cortical area was reproducible.
Data Analysis
After the presentation of each real or sham TMS, the subjects rated the sensation evoked by the real or sham cutaneous stimulus using a rating scale consisting of three categories: 1) Yes, representing a definite tactile sensation; 2) Maybe, indicating an uncertain perception in the skin; 3) No, representing lack of any cutaneous sensation after the stimulus presentation. Responses were analyzed using a method based on signal detection theory [Swets,1973], which allows one to dissociate the subject's discriminative capacity from the subjective criteria he uses to assess his perceptions. The former is a pure measure of sensory function, whereas the latter reflects the subject's response bias (nonsensory function).
A low index of discriminative capacity means that the subject tends to confuse weak and more intense stimuli, and it results when the physical intensities of the stimuli are close together or when the subject's sensory system is insensitive. The index of discriminative capacity is a relatively pure measure of sensory function; in the present study the index of the subject's discriminative capacity allows determining whether TMS is indeed producing a change in sensory function underlying cutaneous perception, independent of a potential placebo effect or a change in the subject's response bias. For assessment of the subject's discriminative capacity, ROC (receiver operating characteristic) curve analysis was performed using MedCalc (Mariakerke, Belgium) software. The ROC curve analysis contributed to the accuracy with which TMS‐induced perceptual changes were determined. When entering the data, the category rating scale was transformed into numerical form (two representing a definite tactile sensation, one representing an uncertain cutaneous perception, and zero representing lack of any cutaneous sensation). In each condition the ROC curve analysis was made by comparing responses to real cutaneous stimulation during real TMS (condition RR) vs. sham TMS (SR). The area under the ROC curve (AUC) was used as an index of the subject's discriminative capacity. The AUC value varies from 0.5 to 1.0: the value 0.5 indicates that the subject cannot discriminate the two stimulus conditions, whereas 1.0 indicates that the subject can perfectly discriminate the two conditions from each other. In other words, an AUC value close to 0.5 indicates that the effect of real TMS does not differ from that of sham TMS, whereas an AUC value significantly greater than 0.5 indicates that real TMS produces a suppression of cutaneous sensation. It should be noted that each sequence also involved sham cutaneous stimulation with sham or real TMS allowing determination of the subject's response criterion independent of the assessment of his/her discriminative capacity.
Statistics
One‐way analysis of variance (ANOVA) followed by Tukey's test was used for comparing three or more groups, and t‐test for comparing two groups. In these tests, P < 0.05 was considered to represent a significant difference. Additionally, the 95% confidence limits of the area under each ROC curve were used to assess a significant difference from the value of 0.5 representing no blocking effect.
RESULTS
TMS of S1 Applied After Cutaneous Stimulation: Time Course of Blocking Effect
Magnetic stimulation of the thenar S1 cortical area (Fig. 3A) attenuated sensation evoked by contralateral thenar stimulation within a restricted time window following cutaneous test stimulation as indicated by the ROC curve area values (Fig. 4) [Swets,1973]. The greatest inhibition of sensation occurred when TMS was applied 20 ms after the cutaneous test stimulus; in this condition, TMS applied to the thenar S1 cortical area produced a significant suppression of sensation in all subjects. When the interval from the cutaneous test stimulus to the cortical TMS increased from 20 to 150 ms, the TMS‐induced effect decreased (F 3,15 = 4.377, P < 0.03, ANOVA; Fig. 5A); none of the subjects had a significant suppression of sensation when TMS was applied 150 ms after the cutaneous test stimulus. The false‐alarm rate, reported cutaneous perception during the absence of peripheral stimulation, was not significantly influenced by a change in the delay between the cutaneous test stimulus and TMS as shown by responses to sham cutaneous stimulation during real TMS stimulation (false‐alarm rate at 20 ms: 5.0%; 50 ms: 7.5%; 100 ms: 5.0%; 150 ms: 3.1%; F 3,15 = 0.3237, one‐way‐ANOVA).
Figure 3.
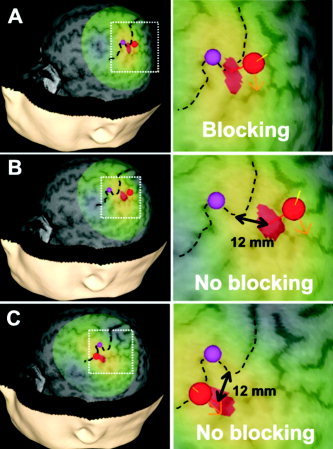
Cortical stimulation sites in S1 area of one subject. A: S1 thenar cortical location in subject 1. Dashed black line = central sulcus; red sphere = center of the TMS coil on the scalp; red‐yellow‐green area on the cortex = TMS‐induced electric field (red area = maximum of the induced electric field); orange arrow = direction of the current; purple sphere = M1 target. B,C: Target locations in the same subject after the TMS coil was moved medially (B) and laterally (C) along the central sulcus to the TMS target area (hotspot) that produced perception blocking to cutaneous stimulation of the thenar skin area. In this subject, the actual distance was 12 mm medial (B) and 12 mm lateral (C). 12 mm is the distance between the maxima of the induced electric fields.
Figure 4.
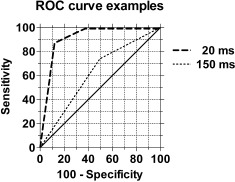
Receiver operating characteristic (ROC) curves for one subject. ROC curves were obtained by comparing the subject's responses to cutaneous test stimulation in experimental condition RR (real TMS with real cutaneous stimulation) vs. condition SR (sham TMS with real cutaneous stimulation). In this example, TMS was applied to the hotspot for the test site (thenar) in the S1 cortex 20 and 150 ms after the cutaneous test stimulus. The larger the area under the ROC curve (AUC), the larger the difference in discriminability of cutaneous test stimulation between the two experimental conditions; i.e., a large AUC indicates that detection of the cutaneous test stimulus is suppressed by real TMS when compared to detection of the same test stimulus during sham TMS. The diagonal line represents the baseline AUC value of 0.5 indicating no change in discriminability of test stimuli by real vs. sham TMS. For example, the curve for the interval of 20 ms in the graph was based on the following responses to real cutaneous test stimulation: 1) during real TMS, five “no,” two “maybe,” and one “yes” responses; 2) during sham TMS, one “maybe” and seven “yes” responses.
Figure 5.
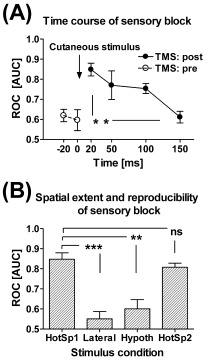
Time course, spatial extent, and reproducibility of the TMS‐induced cutaneous sensory block. A: Time course of the TMS‐induced cutaneous sensory block over all subjects. TMS was applied at varying time points after (TMS: post; n = 5) or prior to (TMS: pre; n = 3) the cutaneous test stimulus. The 95% confidence intervals of the areas under the ROC curve overlapped with the value representing no block (0.5) in all individuals when TMS was applied prior to or 150 ms after cutaneous test stimulation, but this overlap did not occur in any of the subjects when TMS was applied 20 ms after the cutaneous test stimulus. B: Spatial extent and reproducibility of the TMS‐induced sensory block. HotSp1 = First day, when TMS was applied to the hotspot for the thenar and the cutaneous test stimulus to the thenar (n = 5). Lateral = TMS was applied 8–13 mm lateral to the hotspot for the thenar and the cutaneous test stimulus to the thenar (n = 5). Hypoth = TMS was applied to the hotspot for the thenar and the cutaneous test stimulus to the hypothenar (n = 4). HotSp2 = Second day, when TMS was applied to the hotspot for the thenar and the cutaneous test stimulus to the thenar (n = 3). The 95% confidence intervals of the areas under the ROC curve indicate that TMS produced a significant block (no overlap with value 0.5) in the experimental condition HotSp1 and HotSp2, but not in other experimental conditions. In both graphs the area under the ROC curve is represented on the y‐axis, with 1.0 equal to 100% blocking of cutaneous sensation by TMS and 0.5 equal to no blocking. Error bars represent ± SEM. ns = nonsignificant, **P < 0.01, ***P < 0.005 (Tukey's test).
TMS of S1 Applied at or Before Cutaneous Stimulation
TMS of S1 delivered simultaneously with (0 ms) or prior to (−5 ms to −20 ms) the cutaneous stimulation did not significantly inhibit sensation (in all subjects, 95% confidence limits of the ROC curve values overlapped with the value of 0.5 representing no block; n = 3, Fig. 5A).
TMS of S1: Spatial Extent of the Suppressive Effect
Two control experiments were carried out to determine the spatial characteristics of the sensory block induced by TMS of S1. First, to determine the extent of the cortical area where the TMS pulse attenuates sensation evoked by cutaneous stimulation of the thenar hand area, TMS was targeted to cortical areas about 15 mm medial and lateral to the S1 hotspot for the stimulated thenar area (Fig. 3B,C). However, when we tested the spatial accuracy, we moved the coil away rostrolaterally and caudomedially so far from the optimal site that the stimulation hotspot (the red area where the electric field is more than 97% of the maximum) and the hotspot for the optimal stimulation site were side by side but did not overlap. NBS records every stimulus; the orientation and position of the coil and the electric field of the stimulus are all automatically recorded. After the stimulation session, the distance from the electric field maximum at the optimum blocking site and the rostrolateral as well as caudomedial sites were measured from the screen. The measured distance appeared to vary between 8–13 mm. This variation depends on the size of the hotspot. The hotspot size depends on individual head shape and orientation of the coil.
The attenuation of sensation was significantly lower when TMS was applied to the medial and lateral positions than when it was directed to the hotspot (n = 5, P < 0.05, t‐test of combined medial and lateral ROC data). In three of the five subjects, TMS to these sites had absolutely no attenuating effect on thenar sensation, while in two subjects there was still some inhibition. Second, to investigate the extent of the hand skin area that is affected by TMS of the S1 hotspot for the thenar area, we applied cutaneous test stimulation to the right hypothenar area. TMS applied to the S1 hotspot for the right thenar area produced significantly less attenuation of sensation from the hypothenar than the thenar (n = 4, P < 0.05, t‐test) (Fig. 5B).
TMS of S1: Reproducibility of Sensory Suppression
The repeatability of NBS‐controlled TMS was tested in three subjects. Analysis of ROC curves indicated that there was no significant difference in attenuation of sensation on two different days at an interval of 20 ms between the thenar cutaneous stimulus and the TMS (P = 0.15, paired t‐test) (Fig. 5B).
TMS of S1: Lack of Motor Effects
To determine if the motor cortex was affected during stimulation of the S1 hotspot, EMG responses from the abductor pollicis brevis (APB) muscle were recorded. The motor response to S1 stimulation was virtually nonexistent, and was significantly less than that following TMS of M1 at the motor threshold intensity (n = 5, P < 0.01, paired t‐test of EMG values) even though TMS intensity during S1 stimulation was 120–130% of MT.
DISCUSSION
The present study demonstrates that selective TMS stimulation of the S1 thenar area is sufficient to inhibit the sensation induced by electric stimulation to the corresponding skin area. Spatially restricted and cortically selective stimulation was accomplished using NBS‐controlled TMS, which allows real‐time monitoring of the location and orientation of the stimulation‐induced electric field on the subject's MR image and a millimeter‐level precision in the positioning of the coil.
TMS‐Induced Cutaneous Sensory Block: Comparison With Earlier Results
Previous studies using less selective stimulation methods for directing the TMS have demonstrated the attenuation of sensation when TMS was delivered after the cutaneous test stimulus to “the sensorimotor area” or the M1 area [Cohen et al.,1991; Seyal et al.,1992,1997; Pascual‐Leone et al.,1994; McKay et al.,2003]. An earlier study addressing the time course of the blocking of sensation reported that TMS of the parietal cortex with a circular coil produced attenuation of cutaneous sensation when TMS was applied 20–140 ms following the cutaneous test stimulus [Andre‐Obadia et al.,1999]. This time course is very similar to that in the present study, although stimulation of the parietal cortex with a circular coil does not allow determining the precise cortical area critical for the block. Interestingly, the arrival of the afferent volley from the hand to the S1 cortex peaks at 20 ms [Allison et al.,1989], at which time point TMS produced maximal suppression of sensation in the present study and in the study by Andre‐Obadia et al. [1999].
The present results demonstrate that the TMS‐induced effect was spatially restricted. This was indicated by the finding that TMS applied 8–13 mm lateral or medial to the S1 hotspot produced significantly less attenuation of sensation from the thenar than TMS applied to the hotspot. Moreover, although the hypothenar cortical representation is only ∼7 mm medial to the thenar cortical representation [Nakamura et al.,1998], sensation from cutaneous stimulation to the hypothenar was affected very little by TMS applied to the S1 hotspot for the thenar. Although we did not aim to determine the ultimate accuracy of the NBS method, the results show that the functional, or physiological resolution of the NBS‐controlled TMS is 8–13 mm or better. As explained above, we tested the spatial accuracy of the TMS in attenuating the sensation in the S1 cortical region representing the thenar area by moving the coil away rostrolaterally and caudomedially so far from the optimal site that the stimulation hotspot and the hotspot of the optimal stimulation site were side by side but did not overlap. The NBS technology provides a technical resolution of 1 mm. The functional resolution of TMS depends on the coil, stimulation intensity, target depth, and coil orientation. In this study, we showed that the functional resolution with NBS can be at least as good as 8–13 mm. It can be even better if the coil is moved millimeter by millimeter. Future investigation is needed to refine the functional cortical resolution achievable by NBS.
We also addressed the question of repeatability and reproducibility of the effects of NBS‐controlled TMS in three subjects. The results showed that there was no significant difference in attenuation of sensation on two different days when a TMS pulse to the S1 hotspot was delivered at an interval of 20 ms from the thenar cutaneous stimuli. This result demonstrates reproducibility of the attenuation produced by NBS‐controlled TMS of the S1 thenar cortical area.
It may not be possible to stimulate S1 without affecting M1, given that there are cortical connections between the two regions. However, EMG data showed that muscle activation in the hand was negligible when TMS was applied to the S1 cortex and strong when it was applied to the M1 area. This finding indicates that when TMS was applied to S1, the M1 was indeed affected much less than S1. Moreover, because of the coil orientation, the TMS‐induced electric field in our study was directed posterior to the central sulcus, towards the S1 cortex. This was likely to reduce the possibility that the cortical stimulus would affect the M1 cortex.
One should be cautious in interpreting earlier blocking effects caused by M1 or sensorimotor stimulation because the resulting motor responses may confound the data in three ways. First, past research has shown that the perception threshold of cutaneous stimulation may increase during movement preparation and execution [e.g., Chapman et al.,1987; Milne et al.,1988; Williams et al.,1998]. This may explain why TMS of the motor cortex has been reported to suppress perception even more than stimulation of the somatosensory cortex [McKay et al.,2003]. Second, peripheral movement induces afferent barrage from nerve fibers innervating muscles, joints, and skin, causing uncertainty as to whether perceived sensation was evoked by the cutaneous test stimulus or by movement. Third, movement‐induced afferent barrage may induce central modulation of the signal evoked by cutaneous stimulation [e.g., Pertovaara et al.,1994]. For these reasons, one should be cautious when comparing the present results involving TMS of S1 with results of previous studies involving TMS of the sensorimotor cortex.
In earlier studies, in which TMS was delivered to the sensorimotor cortex, attenuation of sensation was obtained with stimulation prior to and simultaneous with the cutaneous stimulation [Cohen et al.,1991; Seyal et al.,1992,1997; Pascual‐Leone et al.,1994]. In the present study, significant attenuation of sensation was not observed when TMS was applied to the S1 cortex simultaneously with or 20 ms prior to the cutaneous test stimulus. This could be due to the involvement of different mechanisms in M1‐ vs. S1‐mediated inhibition, since TMS stimulation of the sensorimotor cortex in the previous studies involved the M1 and S1 areas to a variable degree.
Potential Mechanisms Underlying TMS‐Induced Sensory Block
Mechanisms of attenuation by TMS are not well established. At the neuronal level, the induced electric field causes ion movement that leads to neuronal cell depolarization, which if great enough will cause neuronal activation. However, it is not known which neurons are most sensitive to TMS stimulation, and while inhibitory and excitatory neurons are both activated, the resulting inhibition or facilitation is poorly understood. It is also unknown how complex cell shapes and ongoing background neuronal activity may affect the result of TMS [Bailey et al.,2001], although the distribution of membrane potentials is known to be of importance [Komssi et al.,2004]. At the integrative level, there are several mechanisms that need to be considered when trying to explain a TMS‐induced blocking of tactile sensations. First, TMS could block ascending sensory signals by activation of corticothalamic modulatory pathways. Experimental animal studies suggest that microstimulation of the motor cortex may, indeed, produce a marked suppression of somatosensory responses measured at the level of the dorsal column nuclei, the thalamus, and S1 cortex [Jiang et al.,1990; Shin and Chapin,1989,1990]. However, in the present study the lack of an EMG response following stimulation of the S1 cortex suggests that TMS did not produce a significant activation of the motor cortex. Activation of corticothalamic pathways originating in the S1 cortex of experimental animals has predominantly facilitated ascending somatosensory signals at the level of the thalamus and the dorsal column nuclei [Malmierca and Nuñez,2004; Temereanca and Simond,2004], suggesting that corticothalamic pathways are not likely to explain the inhibition of cutaneous perceptions during TMS of the S1 cortex. Second, by activating antidromically thalamocortical axons in the S1 cortex, TMS could produce a collision block of orthodromic signals mediating tactile sensations. However, a collision block would be expected to last only for a few ms and influence the ascending afferent volley until its arrival in the cortex within 20 ms from the cutaneous stimulus, but not after the arrival, as in the present study. Third, TMS may cause activation of inhibitory interneurons and the release of inhibitory neurotransmitters within the S1 cortex [Chowdhury and Rasmusson,2003; Nikulin et al.,2003], which might lead to suppression of the cortical neurons mediating the tactile perception. Fourth, the TMS‐induced depolarization block of S1 neurons might underlie the disappearance of cutaneous sensation particularly at the time point of 20 ms when the peak afferent volley supposedly arrives at the cortex. The depolarization block might also contribute later, provided that conscious somatosensory experience requires the integration of neuronal activity over a longer period [Libet et al.,1964]. Application of TMS to the S1 hand area did not itself produce sensations projected to the hand, as indicated by a comparison of the results of the present experimental conditions, in which sham cutaneous stimulation was applied together with real or sham TMS. This may be explained by geometrically and temporally unnatural activation of S1 neurons, and by TMS‐induced release of inhibitory neurotransmitters from cortical interneurons.
Prospects
NBS uses MRI to accurately guide the stimulation hotspot of TMS to target locations in the brain. The NBS device used in this study (Nexstim, Helsinki, Finland) determines with an optical tracker the location and orientation of the TMS coil with respect to the subject's head. Taking into account the shape and structure of the head and the winding geometry of the coil, the system calculates in real time the induced electric field inside the cranium [Ruohonen and Ilmoniemi,1999].
Real‐time navigation is very different from just locating the freely defined midpoint of the coil cover for the first pulse and hoping that the coil does not move. With the NBS‐controlled TMS it is possible to register the tilting angle and rotation of the coil in real time, not just its middle point. To our knowledge, the present study is the first TMS investigation in which the location of the coil and the location, extent, and shape of the intracranially induced electric field were determined for individual pulses.
The electric field is displayed color‐coded on individual MRI; this helps the user to move the coil until the stimulation hotspot is at the desired target. In addition to the precise location, the orientation of the electric field is an important factor in determining the cortical effect of stimulation. The motor threshold can be twice as high when the induced field is in the direction of the central sulcus as when it is perpendicular to it [Brasil‐Neto et al.,1992].
One of the practical problems in brain imaging studies is the movement of the head during a study session. In TMS, these movements may lead to increased variability and inaccuracy of stimulus targeting. Real‐time monitoring of the head and the coil help us track the head movements and, when necessary, to shift the coil to keep the stimulation hotspot at the target. Improved accuracy in TMS targeting allows us to reduce stimulation intensities, which adds to safety and reduces the area where neuronal firing thresholds are exceeded. NBS is thus a new precision tool with a potential for functional mapping of the brain with improved accuracy and larger safety margins [Wassermann et al.,1998].
REFERENCES
- Allison T, McCarthy G, Wood CC, Darcey TM, Spencer DD, Williamson PD (1989): Human cortical potentials evoked by stimulation of the median nerve. II. Cytoarchitectonic areas generating short‐latency activity. J Neurophysiol 62: 694–710. [DOI] [PubMed] [Google Scholar]
- Andre‐Obadia N, Garcia‐Larrea L, Garassus P, Mauguière F (1999): Timing and characteristics of perceptual attenuation by transcranial stimulation: a study using magnetic cortical stimulation and somatosensory‐evoked potentials. Psychophysiology 36: 476–483. [DOI] [PubMed] [Google Scholar]
- Bailey CJ, Karhu J, Ilmoniemi RJ (2001): Transcranial magnetic stimulation as a tool for cognitive studies. Scand J Psychol 42: 297–305. [DOI] [PubMed] [Google Scholar]
- Brasil‐Neto JP, Cohen LG, Panizza M, Nilsson J, Roth BJ, Hallett M (1992): Optimal focal transcranial magnetic activation of the human motor cortex: effects of coil orientation, shape of the induced current pulse, and stimulus intensity. J Clin Neurophysiol 9: 132–136. [PubMed] [Google Scholar]
- Chambers CD, Payne JM, Stokes MG, Mattingley JB (2004): Fast and slow parietal pathways mediate spatial attention. Nat Neurosci 7: 217–218. [DOI] [PubMed] [Google Scholar]
- Chapman CE, Bushnell MC, Miron D, Duncan GH, Lund JP (1987): Sensory perception during movement in man. Exp Brain Res 68: 516–524. [DOI] [PubMed] [Google Scholar]
- Chowdhury SA, Rasmusson DD (2003): Corticocortical inhibition of peripheral inputs within primary somatosensory cortex: the role of GABAA and GABAB receptors. J Neurophysiol 90: 851–856. [DOI] [PubMed] [Google Scholar]
- Cohen LG, Bandinelli S, Sato S, Kufta C, Hallett M (1991): Attenuation in detection of somatosensory stimuli by transcranial magnetic stimulation. Electroencephalogr Clin Neurophysiol 81: 366–376. [DOI] [PubMed] [Google Scholar]
- Harris JA, Miniussi C, Harris IM, Diamond ME (2002): Transient storage of a tactile memory trace in primary somatosensory cortex. J Neurosci 22: 8720–8725. [DOI] [PMC free article] [PubMed] [Google Scholar]
- Ilmoniemi R, Grandori F (1993): Finnish Patent Application No. 934511. Patent No. 100458 granted 15 December 1997.
- Ilmoniemi RJ, Ruohonen J, Virtanen J (1996): Relationships between magnetic stimulation and MEG/EEG In: Nilsson J, Panizza M, Grandori F, editors. Advances in magnetic stimulation: mathematical modeling and clinical applications. Advances in occupational medicine and rehabilitation 2. Pavia: Maugeri Foundation; p 65–72. [Google Scholar]
- Jiang W, Chapman CE, Lamarre Y (1990): Modulation of somatosensory evoked responses in the primary somatosensory cortex produced by intracortical microstimulation of the motor cortex in the monkey. Exp Brain Res 80: 333–344. [DOI] [PubMed] [Google Scholar]
- Komssi S, Kähkönen S, Ilmoniemi RJ (2004): The effect of stimulus intensity on brain responses evoked by transcranial magnetic stimulation. Hum Brain Mapp 21: 154–164. [DOI] [PMC free article] [PubMed] [Google Scholar]
- Krings T, Buchbinder BR, Butler WE, Chiappa KH, Jiang HJ, Rosen BR, Cosgrove GR (1997): Stereotactic transcranial magnetic stimulation: correlation with direct electrical cortical stimulation. Neurosurgery 41: 1319–1325. [DOI] [PubMed] [Google Scholar]
- Libet B, Alberts WW, Wright EW Jr, Delattre L, Levin G, Feinstein B (1964): Production of threshold levels of conscious sensation by electric stimulation of human somatosensory cortex. J Neurophysiol 27: 546–578. [DOI] [PubMed] [Google Scholar]
- Malmierca E, Nuñez A (2004): Primary somatosensory cortex modulation of tactile responses in nucleus gracilis cells of rats. Eur J Neurosci 19: 1572–1580. [DOI] [PubMed] [Google Scholar]
- McKay DR, Ridding MC, Miles TS (2003): Magnetic stimulation of motor and somatosensory cortices suppresses perception of ulnar nerve stimuli. Int J Psychophysiol 48: 25–33. [DOI] [PubMed] [Google Scholar]
- Milne RJ, Aniss AM, Kay NE, Gandevia SC (1988): Reduction in perceived intensity of cutaneous stimuli during movement: a quantitative study. Exp Brain Res 70: 569–576. [DOI] [PubMed] [Google Scholar]
- Miranda PC, de Carvalho M, Conceicao I, Luis ML, Ducla‐Soares E (1997): A new method for reproducible coil positioning in transcranial magnetic stimulation mapping. Electroencephalogr Clin Neurophysiol 105: 116–123. [DOI] [PubMed] [Google Scholar]
- Nakamura A, Yamada T, Goto A, Kato T, Ito K, Abe Y, Kachi T, Kakigi R (1998): Somatosensory homunculus as drawn by MEG. Neuroimage 7: 377–386. [DOI] [PubMed] [Google Scholar]
- Neggers SFW, Langerak TR, Schutter DJLG, Mandl RCW, Ramsey NF, Lemmens PJJ, Postma A (2004): A stereotactic method for image‐guided transcranial magnetic stimulation validated with fMRI and motor‐evoked potentials. Neuroimage 21: 1805–1817. [DOI] [PubMed] [Google Scholar]
- Nikulin VV, Kicic D, Kähkönen S, Ilmoniemi RJ (2003): Modulation of electroencephalographic responses to transcranial magnetic stimulation: evidence for changes in cortical excitability related to movement. Eur J Neurosci 18: 1207–1213. [DOI] [PubMed] [Google Scholar]
- Pascual‐Leone A, Cohen LG, Brasil‐Neto JP, Valls‐Solé J, Hallett M (1994): Differentiation of sensorimotor neuronal structures responsible for induction of motor evoked potential, attenuation in detection of somatosensory stimuli, and induction of sensation of movement by mapping of optimal current directions. Electroencephalogr Clin Neurophysiol 93: 230–236. [DOI] [PubMed] [Google Scholar]
- Pertovaara A, Helminen RR, Mansikka H (1994): The movement‐induced modulation in discriminability between cutaneous nonpainful stimuli depends on test stimulus intensity. Exp Brain Res 101: 506–512. [DOI] [PubMed] [Google Scholar]
- Ruohonen J, Ilmoniemi RJ (1996): Multichannel magnetic stimulation: improved stimulus targeting In: Nilsson J, Panizza M, Grandori F, editors. Advances in magnetic stimulation: mathematical modeling and clinical applications. Advances in occupational medicine and rehabilitation 2. Pavia: Maugeri Foundation; p 55–64. [Google Scholar]
- Ruohonen J, Ilmoniemi RJ (1999): Modeling of the stimulating field generation in TMS. Electroenchephalogr Clin Neurophysiol Suppl 51: 30–40. [PubMed] [Google Scholar]
- Rushworth MF, Hadland KA, Paus T, Sipila P (2002): Role of the human medial frontal cortex in task switching: a combined fMRI and TMS study. J Neurophysiol 87: 2577–2592. [DOI] [PubMed] [Google Scholar]
- Sarvas, J (1987): Basic mathematical and electromagnetic concepts of the biomagnetic problem. Phys Med Biol 32: 11–22. [DOI] [PubMed] [Google Scholar]
- Seyal M, Masuoka LK, Browne JK (1992): Suppression of cutaneous perception by magnetic pulse stimulation of the human brain. Electroencephalogr Clin Neurophysiol 85: 397–401. [DOI] [PubMed] [Google Scholar]
- Seyal M, Siddiqui I, Hundal NS (1997): Suppression of spatial localization of a cutaneous stimulus following transcranial magnetic pulse stimulation of the sensorimotor cortex. Electroencephalogr Clin Neurophysiol 105: 24–28. [DOI] [PubMed] [Google Scholar]
- Shin HC, Chapin JK (1989): Mapping the effects of motor cortex stimulation on single neurons in the dorsal column nuclei in the rat: direct responses and afferent modulation. Brain Res Bull 22: 245–252. [DOI] [PubMed] [Google Scholar]
- Shin HC, Chapin JK (1990): Mapping the effects of motor cortex stimulation on somatosensory relay neurons in the rat thalamus: direct responses and afferent modulation. Brain Res Bull 24: 257–265. [DOI] [PubMed] [Google Scholar]
- Swets JA (1973): The relative operating characteristic in psychology. Science 182: 990–1000. [DOI] [PubMed] [Google Scholar]
- Tarkiainen A, Liljestrom M, Seppa M, Salmelin R (2003): The 3D topography of MEG source localization accuracy: effects of conductor model and noise. Clin Neurophysiol 114: 1977–1992. [DOI] [PubMed] [Google Scholar]
- Temereanca S, Simond DJ (2004): Functional topography of corticothalamic feedback enhances thalamic spatial response tuning in the somatosensory whisker/barrel system. Neuron 41: 639–651. [DOI] [PubMed] [Google Scholar]
- Thielscher A Kammer T (2002): Linking physics with physiology in TMS: a sphere field model to determine the cortical stimulation site in TMS. Neuroimage 17: 1117–1130. [DOI] [PubMed] [Google Scholar]
- Wassermann EM (1998): Risk and safety of repetitive transcranial magnetic stimulation: report and suggested guidelines from the International Workshop on the Safety of Repetitive Transcranial Magnetic Stimulation, June 5–7, 1996. Electroencephalogr Clin Neurophysiol 108: 1–16. [DOI] [PubMed] [Google Scholar]
- Williams SR, Shenasa J, Chapman CE (1998): Time course and magnitude of movement‐related gating of tactile detection in humans. I. Importance of stimulus location. J Neurophysiol 79: 947–963. [DOI] [PubMed] [Google Scholar]