

Abstract
Motor skill learning depends upon acquiring knowledge about multiple features of sequential behaviors, including their visuomotor and spatial properties. To investigate the neural systems that distinguish these representations, we carried out functional magnetic resonance imaging (fMRI) as healthy adults learned to type sequences on a novel keyboard. On the initial training day, learning‐related changes in brain activation were found in distributed cortical regions, only a subset of which correlated with improvements in movement time (MT), suggesting their preeminence in controlling movements online. Subjects received extended training on the sequences during the ensuing week, after which they returned to the scanner for another imaging session. Relative to performance at the end of the first training day, continued plasticity was most striking in the inferior parietal cortex and new areas of plasticity were uncovered in the caudate and cerebellum. Plasticity in these regions correlated with reaction time (RT), suggesting their role in planning sequences before movement onset. Two transfer conditions probed for “what” subjects learned. The probe for visuomotor learning produced increased activation in visual analysis (left inferior visual cortex) and advance planning (left caudate) systems. The probe for spatial learning produced increased activation in visuomotor‐transformation (left dorsal visual pathway) and retrieval (left precuneus) systems. Increased activity in all of these regions correlated with increased RT, but not MT, indicating that both transfer conditions interfered with the neural representation of plans for the sequences, but not processes that controlled their implementation. These findings demonstrated that neuroanatomically dissociable systems support the acquisition of visuomotor and spatial representations of actions. Hum Brain Mapping 24:229–247, 2005. © 2004 Wiley‐Liss, Inc.
Keywords: sequence learning, perceptual learning, spatial learning, fMRI
INTRODUCTION
Throughout life, humans are able to learn complex motor skills, many of which require extensive practice and repetition. Motor‐skill learning involves gaining knowledge about many aspects of sequential behaviors including regularities in their spatial, perceptual, temporal, and motoric properties [Lee, 2000; Mayr, 1996; Willingham et al., 2000]. It is, therefore, not surprising that practice on motor‐sequencing tasks is associated with plasticity in the striatum, cerebellum, and distributed regions of the cerebral cortex. However, the neural underpinnings of different representations of motor‐skill learning are not well understood, nor are the effects of extended practice. We investigated “what” subjects learned as they practiced finger sequences and whether different memory representations of the sequencing skill were supported by neuroanatomically distinct systems. We also studied the time course of brain plasticity as subjects practiced the sequences over five sessions.
Although changes in brain activation throughout the course of practicing a skill have been well documented, some studies have reported learning‐related increases in activation in numerous cortical and subcortical regions [Grafton et al., 1995, 1998; Hazeltine et al., 1997; Hikosaka et al., 1996; Jueptner et al., 1997b; Toni et al., 1998], whereas others have shown no change or decreased activation with practice in some of these same areas [Jenkins et al., 1994; Sakai et al., 1998; Schlaug et al., 1994; Toni et al., 1998; Toni and Passingham, 1999]. One model suggests that these discrepancies may be explained in part by the distinct roles of corticostriatal and corticocerebellar systems in different stages of sequence learning and motor adaptation, respectively [Doyon et al., 2003]. By this account, corticocerebellar systems are involved primarily in early motor adaptation phases of learning where the adjustment and monitoring of sensory‐motor information is most crucial. Once a motor task becomes more practiced, these mechanisms are less active and corticostriatal systems become more active, due to their primary role in automatization of sequence learning. Although relatively few studies have investigated neural plasticity over extended periods of practice, motor‐sequencing learning sometimes produces a shift in activation from the cerebellum in early stages of learning to the striatum in later stages [Doyon et al., 2002; Penhune and Doyon, 2002]; however, this has not always been found [Muller et al., 2002; Sakai et al., 1998; Toni et al., 1998]. The failure to observe striatal, cerebellar, or other patterns of learning‐related plasticity may also be related to insufficient practice on a task. For example, Karni et al. [1998] showed only subtle changes in motor cortex (M1) activity during the first 3 weeks of practicing sequential finger movements, but an expansion of activation was found after 3 additional weeks of practice. These findings suggest that sensorimotor representations of motor sequences evolve more gradually.
Although the stage of expertise undoubtedly provides a window into the nature of knowledge representations, discrepant patterns of learning‐related neural plasticity are also likely explained by differences among studies in what is being learned. The most common approach to understanding the neural underpinnings of learning specific types of knowledge about a skill has been to study neural plasticity associated with carrying out a particular task (e.g., timed motor sequences, visuomotor sequencing) [Penhune and Doyon, 2002; Sakai et al., 2002; Toni and Passingham, 1999]. This approach assumes that brain plasticity is related to learning the experimenter‐defined task characteristic, which may be problematic because most skilled behaviors are comprised of multiple representations. It might therefore be difficult to distinguish brain plasticity related to learning the experimenter‐defined task characteristic from learning other types of task‐relevant information. An alternative approach is to probe for sequence‐specific learning by using transfer conditions that differ from the practiced task in a specific characteristic. If performance is disrupted in the transfer condition and is accompanied by regional changes in brain activity, this provides more direct evidence for the neural basis of sequence‐specific learning. This approach has been used to identify effector‐specific learning [Grafton et al., 2002] and spatial learning [Grafton et al., 2001]. However, neither of these studies examined whether the neural representation of effector‐ or spatial‐specific properties was distinct from the representation of other types of sequence‐specific knowledge. This is important because probes for different types of knowledge can reflect processing in common systems involved in, for example, memory retrieval, attention, or executive functions, as well as processing in systems that specifically support the representation of a particular type of knowledge.
We investigated whether acquisition of a sequential skill involved two types of learning: visuomotor learning of finger‐movement sequences that were defined by letter stimuli, and spatial learning of the locations of finger movements on a keypad in allocentric space. We exposed individuals to a novel four‐button keypad, on which they were asked to type four‐letter strings (Fig. 1). On the first day of training, subjects practiced four different sequences over multiple trials while they underwent functional magnetic resonance imaging (fMRI) scanning. Individuals learned not only a set of letter strings and associated finger movements, but also the layout of the keypad. To study longer‐term learning, we had subjects practice the sequences daily for 1 week before returning to the scanner to carry out the task again. We hypothesized that performance would improve rapidly during the early phase of learning and that practice‐related fMRI signal changes would be seen across a network of corticostriatal and corticocerebellar systems involved in movement sequencing [Doyon et al., 2003; Haaland et al., 2000; Harrington et al., 2000; Hikosaka et al., 2002], reflecting both general learning of the task and the acquisition of sequence‐specific knowledge. We did not predict the direction of blood oxygen level‐dependent (BOLD) signal change, however, due to contradictory findings in the literature. We allowed movement speed to improve without constraint to study the natural development of automaticity. Some blocked‐design studies have constrained the rate of performance as subjects practice a skill to control for the larger number of repetitions within a trial block as learning progresses [Grafton et al., 1995, 1998; Toni et al., 1998]. This approach attempts to disentangle the confounding influences of performance from learning‐based changes in brain activation; however, this procedure can alter the evolution of normal learning from a controlled or effortful process to a more automatic one. We avoided this problem by using an event‐related fMRI design in which the evoked hemodynamic response is calculated for individual trials rather than summated over multiple trial repetitions in a blocked design. The total amount of movement thus does not change as performance improves.
Figure 1.

Experimental task. Time sequence of trial events (A). At the beginning of each trial, subjects were presented with a central fixation cross and a set of letters below, corresponding to the standard keyboard alignment. After 9 s, the cross expanded and darkened, providing subjects with a warning signal that a trial was to begin. The sequence of letters to be typed on a four‐button keypad would then appear above the fixation cross for 5 s. Subjects typed standard sequences (C, left column) on the standard keyboard map (B, left) on the first learning day in the scanner and during the extended practice sessions outside the scanner. During the second scanning session, subjects typed sequences under three conditions: (1) standard sequences on standard keyboard map; (2) new sequences constructed by switching the order of last two elements (C, middle) on standard keyboard map; and (3) standard sequences on novel keyboard map (B, right; C, right). In the new keyboard map condition, letters in parentheses denote the correspondence of the response mappings to the old keyboard.
To probe for visuomotor and spatial learning, we introduced two transfer conditions on the final scanning day (Fig. 1B,C). In the visuomotor transfer condition, the sets of letter strings and associated finger movements were changed so that subjects carried out novel letter‐finger sequences on the familiar keypad (new sequence). We hypothesized that differences in functional activity between this condition and the familiar condition would be seen in striatal‐prefrontal motor systems (e.g., basal ganglia, premotor cortex, supplementary motor area [SMA]), which are important in learning visuomotor sequences [Toni et al., 2001]. In the spatial transfer condition, the spatial mapping of letters on the keyboard was changed, and subjects carried out the familiar sequences on a novel keyboard map (new map). We hypothesized that differences between this condition and the familiar condition would be especially apparent in the parietal cortex, due to its role in representing allocentric space [Ungerleider and Haxby, 1994]. Because both transfer conditions changed the ordering of individual finger movements and required subjects to inhibit the familiar sequence, we expected that both conditions would produce increased activation in systems associated with executive functions (e.g., middle‐frontal cortex) [Smith and Jonides, 1999] and response conflict (e.g., anterior cingulate) [MacDonald et al., 2000].
SUBJECTS AND METHODS
Subjects
The participants were 12 healthy volunteers (6 women; mean age, 24.8 years; age range, 18–32 years). All were strongly right‐handed (mean laterality quotient = 94.8; range = 80–100) on the Edinburgh Handedness Inventory [Oldfield, 1971]. No subjects had a history of neurologic disease, major psychiatric disturbance, substance abuse, or were taking psychoactive prescriptive medications. Informed consent was obtained according to institutional guidelines of the Medical College of Wisconsin Human Subjects Review Committee, consistent with the Declaration of Helsinki. All subjects were paid $100 for their participation.
Experimental Paradigm
Stimuli were computer generated and rear‐projected onto the center of an opaque screen located at the subject's feet (viewing distance = 200 cm). The total dimensions of the stimulus array subtended a 1.5 × 3.0‐degree visual angle. Subjects viewed the screen in a darkened room through prism glasses and corrective lenses, if necessary. The stimulus array consisted of black letters on a white background (Fig. 1). Four letters at the top of the array represented the sequence of letters to be typed on a four‐button keypad. Below this target sequence was a centrally located cross, which served as a fixation point. Four letters below the cross represented the alignment of keys on the keypad (i.e., the keyboard map). A nonferrous, four‐button key press device was used and the computer recorded the accuracy and response time of each key press. Three response time measures were calculated. Reaction time (RT) was measured from stimulus onset to the onset of the first key press. Inter‐response time (IRT) for each remaining keystroke was measured for the onset of one key press to the onset of the next key press. Movement time (MT) was the sum of the time of the remaining three IRTs. Subjects received auditory feedback (a computer‐generated buzzer sound presented through air conduction tubes) if they typed an incorrect letter. If there was an error in typing, the subject was instructed to complete the remainder of the sequence correctly.
Figure 1A shows the phases of each trial. Throughout the trial, subjects were instructed to maintain fixation on the centrally located cross. Each imaging run began with 10 s of rest followed by 24 15‐s trials for a total of 6 min (10 s/run).
The experiment consisted of three phases. During the learning phase, subjects were exposed to the four standard sequences and the standard keyboard map for the first time. Once positioned in the scanner, subjects were provided with a demonstration of the task and 8–24 practice trials (practice was discontinued when the subject attained a criterion of 4 consecutively correct trials). The subjects then carried out 8 runs of 24 trials each while being scanned. There were four different four‐letter stimuli, which were presented in a pseudorandom order (e.g., the set of four stimuli were sampled randomly until all items had been presented, then another randomly ordered cycle began, until six randomly ordered cycles had been completed). Subjects were instructed to perform each typing sequence as quickly as possible without making mistakes. Accuracy was emphasized over speed of responding.
During the practice phase, subjects practiced the four standard sequences daily outside of the scanner using the same keyboard map. Subjects carried out three practice runs (24 trials per run) on each of five weekdays between scanning sessions. The trials were identical to those carried out in the scanner, except the rest phase was shortened to 4 s. During the transfer phase, subjects returned to the scanner at the same time of day at which they had been scanned the previous week. The procedures were identical except that there were no practice trials. Three conditions were carried out (2 runs/condition; 24 trials/run) during this scanning session (Fig. 1C). To assess changes in performance across the week of practice, subjects carried out two runs of the sequences they had been practicing during the preceding week (standard sequence condition). To probe for perceptual learning, subjects typed a new set of four four‐letter sequences on the standard keyboard map (new sequence). The new sequence condition was designed by switching the order of the last two letters of each sequence (Fig. 1C). To examine spatial learning of the keyboard map, subjects carried out the same sequences on a different keyboard map (new map). This keyboard map was designed by rearranging the letters on the keyboard such that the letter strings and movement sequences were identical to those that had been practiced, but the response locations changed (Fig. 1B,C). Because both transfer conditions altered the ordering of finger movements, activations uniquely associated with each condition should be due to changes in the perceptual or spatial mapping properties of the sequences. The order of all conditions was counterbalanced across subjects and the two runs of each condition were carried out consecutively.
Imaging Procedures
Whole‐brain, event‐related functional MRI was conducted on a commercial 1.5‐Tesla scanner (Signa; General Electric Medical Systems, Milwaukee, WI) equipped with a three‐axis local gradient head coil and an elliptical endcapped quadrature radiofrequency coil (Medical Advances, Inc., Milwaukee, WI). Foam padding was used to limit head motion. Echo‐planar images were collected using a single‐shot, blipped, gradient‐echo echo‐planar pulse sequence (repetition time [TR] = 2.5 s; echo time [TE] = 40 ms; field of view [FOV] = 24 cm; matrix size = 64 × 64). Seventeen contiguous sagittal 7‐mm thick slices were selected to provide coverage of the entire brain (voxel size: 3.75 × 3.75 × 7 mm). Six images were collected per 15‐s trial for a total of 148 sequential images per run. At the beginning of the scanning session, 3‐D SPGR anatomic images were collected (TE = 5 ms, TR = 24 ms, 40‐degree flip angle, number of excitations [NEX] = 1, slice thickness = 1.1–1.3 mm, FOV = 24 cm, resolution = 256 × 192).
Image Analysis
Each image time series was spatially registered in‐plane to reduce the effects of head motion using an iterative linear least‐squares method. Functional images were created by subtracting a local baseline (fixation) image from an activation image on a trial‐by‐trial basis. The first images (0 s post‐stimulus onset) in temporally adjacent trials were averaged to remove linear trends and are referred to as the local baseline image. The third, fourth, and fifth images (5.0, 7.5. and 10 s post‐stimulus onset) were summed to provide a modified measurement of the evoked change in the hemodynamic response and the sum is referred to as the activation image. The second and sixth images (2.5 and 12.5 s post‐stimulus onset, respectively) were not analyzed because they represent the transitional rise and fall of the evoked hemodynamic response. In the next stage, a difference image was created for each trial by subtracting the baseline image from the activation image. Only correctly typed sequences were used in the analyses to maximize the association between behavioral performance and neuronal activation. An average difference image (ADI) was then created for each of the conditions by averaging all of the individual difference images within a condition. Individual SPGR anatomic scans and average difference images were linearly interpolated to volumes with 1 mm3 voxels, coregistered, and transformed into standard stereotaxic space [Talairach and Tournoux, 1988] using the analysis of functional neuro‐images (AFNI) software package [Cox, 1996]. Functional images were blurred using a 4‐mm Gaussian full‐width half‐maximum (FWHM) filter to compensate for intersubject variability in anatomic and functional anatomy. An individual voxel statistical threshold of P < 0.005 and a minimum cluster size threshold of 200 μl [Forman et al., 1995] was applied to minimize false positive activation foci in the activation maps. These two thresholds were established based on 10,000 Monte Carlo simulations, demonstrating that the chance probability of obtaining a significant activation cluster for an entire volume (Type I error) was less than P = 0.05.
RESULTS
Behavioral Data
Analysis of variance (ANOVA) with repeated measures was used for all statistical tests, and trend analyses (linear and quadratic) tested the effects of run and transfer condition. The Huynh‐Feldt correction was used to adjust for violations in homogeneity of variance, whenever appropriate.
Learning phase
To examine the effects of practice on performance during the initial learning phase, separate ANOVAs for each dependent variable tested the within‐subject effect of run, averaging across the sequences. Accuracy did not improve across the eight runs during the first scanning session (P > 0.10). Performance was accurate, averaging 83% percent correct (standard deviation [SD] = 3%) across runs. Figure 2A shows that RT and MT improved across the eight runs. Significant linear and nonlinear effects of run were found for both RT (linear: F[1,11] = 8.0, P < 0.02; quadratic: F[1,11] = 8.1, P < 0.02) and MT (linear: F[1,11] = 38.5, P < 0.0001; quadratic: F[1,11] = 70.2, P < 0.0001).
Figure 2.
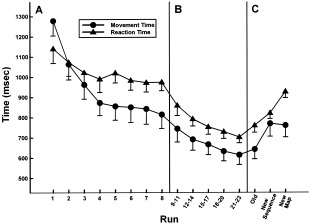
Mean (standard error) of median reaction time and movement time during the practice trials and the transfer conditions. A: Learning phase on Day 1 (eight consecutive imaging runs). B: Extended practice phase (5 days; each day represents average of three runs). C: Transfer phase (average of two runs per condition). In the transfer phase, subjects performed (a) standard sequences on standard keyboard map (old), (b) novel sequences on standard keyboard (new sequence), and standard sequences on novel keyboard map (new map).
Practice phase
The data from the practice phase were averaged across the three runs for each of the 5 days. Figure 2B shows that when subjects practiced the same sequences during nonscanning days, both RT (linear: F[1,11] = 21.7, P < 0.001) and MT (linear: F[1,11] = 15.5, P < 0.01) continued to improve across the 5 days.
Transfer phase
The data from the transfer phase were averaged across the two runs in each condition. Repeated‐measures ANOVA tested the effect of transfer condition for each dependent measure. Accuracy differed among the conditions (F[2,22] = 4.9, P < 0.02) such that performance was more accurate for the familiar and new sequence conditions (mean ± SD = 98 ± 1%) than for the new map condition (mean ± SD = 93 ± 2%). Figure 2C shows that RT (F[2,22] = 33.2, P < 0.0001) and MT (F[2,22] = 8.1, P < 0.01) also varied as a function of transfer condition. Follow‐up analyses indicated that RTs were longer for the new sequence (F[1,11] = 10.9, P < 0.01) and the new map conditions (F[1,11] = 61.7, P < 0.001) relative to the familiar condition. RTs were also longer for the new map than the new sequence condition (F[1,11] = 22.6, P < 0.001). MTs were longer for the new sequence (F[1,11] = 31.1, P < 0.001) and the new map (F[1,11] = 9.9, P < 0.01) relative to the familiar condition, but there was no difference in execution times between the two transfer conditions. These findings indicated that the two transfer conditions differed in terms of their initial planning (RT) but not execution time (MT).
Because the transfer conditions differed with respect to the number of movements that were reordered, we also examined the pattern of response times to determine if subjects organized the two types of transfer sequences differently [Rosenbaum et al., 1983]. Figure 3 shows that the pattern of response times for each key press as a function of their serial position was similar to the practice phase, irrespective of the transfer condition, such that response times were the longest for the first and the shortest for last finger movement. There was also an effect of transfer for each sequence (FRHW: F[2,22] = 41.8, P < 0.001; HWRF: F[2,22] = 9.2, P < 0.001; RFWH: F[1.3,14] = 9.4, P < 0.01; WHFR: F[1.4,15.6] = 4.8, P < 0.05). Thus, the two transfer conditions differed in terms of their initial planning (RT), whereas differences in the number of reordered movements had no effect on execution time (MT) or sequence organization (pattern of IRTs).
Figure 3.

Mean response times for each sequence condition during the transfer phase. The means of the median response times are graphed for each key press. Letters along the x‐axis indicate the familiar (old) sequence of key presses, the most similar key press sequence in the visuomotor transfer condition (new sequences), and the identical key press sequence in the spatial transfer condition (new map). Statistical analyses revealed significant differences between the old condition and the two transfer conditions, but the transfer conditions did not differ from one another (see text).
Functional Imaging Data
Learning phase
For analysis of the functional imaging data from the learning phase, statistical comparisons were made between the eight different ADIs representing repetitions of the task in each of the eight time‐series. A one‐way repeated measures ANOVA was applied to the ADIs on a voxel‐by‐voxel basis across the 12 subjects. The overall F test from this ANOVA represents those voxels that demonstrate significant change in mean intensity difference across runs. Table I and Figures 4 and 5 display the results from the ANOVAs. Table I also shows the correlation coefficients for regions in which performance was significantly correlated (P < 0.001) with learning‐related change in the fMRI signal. Coefficients were derived from linear regression analyses of the fMRI signal on RT and MT. The mean difference score of all voxels within active clusters thus defined was plotted across runs to examine the direction of change across runs. These data are graphed in Figures 4 and 5 for regions showing the strongest relationship with performance. Several bilateral cortical regions showed decreasing activation across the eight runs, including the premotor (Brodmann area [BA] 6), postcentral (BA 2), superior parietal (BA 7), and inferior parietal (BA 40) cortices. In the left hemisphere, learning‐related decreases in activation were found in the SMA, middle frontal cortex (BA 10), and in regions associated with language, including the inferior frontal (BA 44) and superior temporal (BA 22) cortices. In the right hemisphere, learning‐related decreases in activation were seen in the middle frontal cortex (BA 6), occipital cortex (BA 19) and the cerebellum (Lobule IV) [Schmahmann et al., 2000]. Three clusters showed increasing activity across the eight runs (Fig. 5): the left anterior cingulate (BA 24), posterior cingulate (BA 31), and lingual gyrus (BA 18).
Table I.
Regions showing learning‐related changes in MR signal intensity on Day 1
| Region (BA) | Left hemisphere | Region (BA) | Right hemisphere | ||||||||
|---|---|---|---|---|---|---|---|---|---|---|---|
| Talairach coordinates | Volume (μl) | r MT | Talairach coordinates | Volume (μl) | r MT | ||||||
| x | y | z | x | y | z | ||||||
| Decreased intensity | |||||||||||
| Frontal lobe | |||||||||||
| SMA (6) | −7 | 0 | 63 | 329 | 0.54 | Precentral gyrus (4, 6) | 37 | −19 | 58 | 253 | |
| Premotor (6) | −22 | −3 | 49 | 316 | 0.53 | Premotor (6) | 18 | −18 | 63 | 234 | |
| −50 | 5 | 31 | 272 | 51 | 1 | 25 | 459 | ||||
| Middle frontal (10) | −41 | 45 | −11 | 265 | Middle frontal (6) | 26 | −5 | 51 | 749 | 0.43 | |
| Inferior frontal (44) | −37 | 4 | 24 | 716 | 0.46 | ||||||
| −50 | 15 | 22 | 202 | ||||||||
| Temporal lobe | |||||||||||
| Superior temporal (22) | −45 | −30 | 17 | 235 | |||||||
| Parietal lobe | |||||||||||
| Postcentral gyrus (2) | −39 | −31 | 47 | 1,024 | Postcentral (2) | 55 | −21 | 28 | 263 | ||
| −52 | −24 | 38 | 1,008 | Superior parietal (7) | 11 | −53 | 64 | 204 | |||
| Superior parietal (7) | −21 | −66 | 46 | 339 | Postcentral (2) | 35 | −40 | 47 | 6,785 | 0.45 | |
| Inferior parietal (40) | −40 | −40 | 32 | 374 | Superior (7) | ||||||
| Inferior parietal (40) | |||||||||||
| Occipital lobe | |||||||||||
| Middle occipital (19) | 39 | −78 | 19 | 776 | |||||||
| Cerebelluma | |||||||||||
| Lobule IV | 23 | −36 | −27 | 215 | |||||||
| Increased intensity | |||||||||||
| Cingulate cortex | |||||||||||
| Anterior cingulate (24) | −1 | 30 | 15 | 359 | −0.37 | ||||||
| −5 | 35 | 0 | 330 | ||||||||
| Posterior cingulate (31) | 0 | −33 | 33 | 547 | −0.37 | ||||||
| Occipital lobe | |||||||||||
| Lingual gyrus (18) | −1 | −79 | −5 | 431 | −0.42 | ||||||
Tabled correlations coefficients for regions in which performance was correlated significantly with learning‐related changes in MR signal, based on an α level of P < 0.001. BA, Brodmann area.
Regions identified using the atlas of Schmahmann et al. [2000].
Figure 4.

Learning phase decreases (Day 1). Lateral brain regions showing significantly (P < 0.005) decreased MR signal intensity changes across the eight imaging runs (see Table I). Plots represent mean signal intensity in specific active clusters across the eight runs.
Figure 5.

Learning phase increases (Day 1). Midline regions showing significantly (P < 0.005) increased MR signal intensity across the eight imaging runs (see Table I). Plots represent mean signal intensity in specific active clusters across the eight runs.
To examine the relationship between learning‐related changes in the BOLD response in the above regions and performance, we correlated fMRI signal intensity in the first and eighth runs with RT and MT during these runs. RT did not correlate with brain plasticity during the practice phase. In the left hemisphere, MT correlated positively with learning‐related decreases in fMRI signal intensity in the SMA, premotor cortex (dorsal; BA 6), and inferior frontal cortex. In contrast, MT correlated negatively with learning‐related increases in fMRI signal intensity in the left cingulate motor areas (BA 24, 31) and the left lingual gyrus. In the right hemisphere, MT correlated negatively with fMRI signal decreases in a large cluster located in the parietal lobe (BA 7 & 40) and in a dorsal portion of the premotor cortex (BA 6).
Practice phase
To evaluate the effects of longer‐term learning, the data from the two familiar sequence runs of the transfer phase were averaged and compared to data from the last two runs of the learning phase using a paired t‐test. A cutoff t‐value of 3.12 (P < 0.005, degrees of freedom [df] = 11) and minimum cluster size of 200 μl was used as the threshold for identifying active voxels in this comparison. Figure 6 and Table II show that activation in some regions continued to decrease with extended practice, including the left middle frontal (BA 10), left postcentral gyrus (BA 2), and bilateral inferior parietal cortex (BA 40). In addition, extended practice resulted in decreased activation in several areas not associated with learning in early stages of practice including the bilateral precuneus (BA 7), caudate nuclei bilaterally, left inferior occipital cortex (BA 18), left cerebellum (Lobule V, hemisphere and vermis), right middle frontal cortex (BA 9, 10), and right thalamus. There were significant increases in activation in bilateral angular gyrus (BA 39) and left cuneus (BA 18), which also were not associated with learning in the initial practice phase.
Figure 6.

Extended practice phase (Day 1 vs. Day 2). Brain regions showing significant differences (P < 0.005) between the last two imaging runs of the learning phase (Day 1) and the two imaging runs of the old condition (standard sequence and standard map) from the transfer phase (Day 2). Regions in red were more active after practice, whereas regions in blue were less active after practice. Numbers correspond to areas in Table II.
Table II.
Regions showing learning‐related changes in MR signal intensity with extended practice
| Region (BA) | Left hemisphere | Region (BA) | Right hemisphere | ||||||||
|---|---|---|---|---|---|---|---|---|---|---|---|
| Talairach coordinates | Volume (μl) | r RT | Talairach coordinates | Volume (μl) | r RT | ||||||
| x | y | z | x | y | z | ||||||
| Decreased intensity | |||||||||||
| Frontal lobe | |||||||||||
| [1] Middle frontal (10) | −25 | 38 | 15 | 429 | [10] Middle frontal (9, 10) | 22 | 26 | 18 | 1,139 | ||
| Parietal lobe | |||||||||||
| [2] Precuneus (7) | −17 | −73 | 38 | 525 | 0.74 | [11] Precuneus (7) | 21 | −67 | 35 | 1,506 | |
| [3] Inferior parietal (40) | −39 | −49 | 44 | 871 | 0.68 | [12] Inferior parietal (40) | 35 | −40 | 39 | 746 | 0.73 |
| [4] Postcentral (2) | −59 | −13 | 18 | 218 | |||||||
| Occipital Lobe | |||||||||||
| [5] Inferior occipital (18) | −28 | −85 | 0 | 229 | |||||||
| Subcortical | |||||||||||
| [6] Caudate | −12 | 3 | 8 | 247 | 0.80 | [13] Caudate | 11 | 8 | 10 | 1,318 | 0.67 |
| [14] Thalamus (DM) | 11 | −16 | 13 | 313 | 0.66 | ||||||
| Cerebelluma | |||||||||||
| [7] Lobule V (vermis) | −5 | −61 | −25 | 481 | 0.80 | ||||||
| [8] Lobule V | −20 | −55 | −24 | 231 | |||||||
| [9] Peduncle | −14 | −43 | −33 | 309 | 0.70 | ||||||
| Increased intensity | |||||||||||
| Parietal lobe | |||||||||||
| [15] Angular gyrus (39) | −50 | −58 | 25 | 280 | [17] Angular gyrus (39) | 44 | −58 | 24 | 375 | ||
| Occipital lobe | |||||||||||
| [16] Cuneus (18) | −10 | −96 | 19 | 522 | |||||||
To examine the relationship between performance and learning‐related changes in the BOLD response after extended practice, we correlated the average fMRI signal intensity from the last two runs of the first fMRI session and the two familiar‐sequence runs of the second fMRI session with the mean RT and MT during these runs. In contrast to the learning phase, improvements in RT, but not MT, correlated with brain plasticity. RT correlated positively with learning‐related decreases in activation in the bilateral inferior parietal cortex (BA 40), bilateral precuneus (BA 7), bilateral caudate, right thalamus, and left cerebellum (vermis and peduncle).
Transfer phase
To examine brain regions involved in learning spatial response location regularities (new map) versus those involved in learning visuomotor regularities of sequences (new sequence), separate repeated measures ANOVAs were conducted comparing activation in the familiar sequences (during the transfer phase) to activation in each of the transfer conditions. All areas of significant activation were greater in the transfer conditions relative to the familiar condition. To determine whether the increased activations during the visuomotor and spatial transfer conditions were in neuroanatomically distinct or common regions, we imposed a spatial criterion [Harrington et al., 2000]. Activations in regions within 12 mm3 of one another in both transfer conditions were considered common areas and activations in regions separated by more than 12 mm3 were considered spatially distinct. Next, in a region‐of‐interest (ROI) analysis, we evaluated whether the magnitude of activation in spatially distinct regions differed significantly between the two transfer conditions. In this analysis, the difference in signal intensity between each transfer condition (new map, new sequence) relative to the familiar sequence condition was computed for the distinct regions using paired one‐tailed t‐tests. Because we had already adjusted our significance threshold in the initial analyses that tested for the effect of each transfer condition, a threshold of P < 0.05 was adopted for the region of interest analyses.
Table III and Figure 7 show that both transfer conditions produced increased activation bilaterally in the premotor cortex, SMA, middle frontal cortex (BA 9), anterior cingulate, superior parietal cortex, and inferior parietal cortex. In addition, both contrasts produced activation in the right middle‐inferior frontal cortex (BA 10, BA 45) right occipital lobe, right caudate, and left cerebellum (Lobule VI). Table III, however, shows that increased RT (bold type) or MT (italic type) (i.e., transfer condition minus familiar sequences) correlated with increased activation in only a subset of these areas: left premotor cortex, left inferior parietal cortex, right SMA, and right middle frontal cortex (BA 9).
Table III.
Common regions showing increased MR signal intensity for transfer conditions
| Region (BA) | Left hemisphere | Region (BA) | Right hemisphere | ||||||||
|---|---|---|---|---|---|---|---|---|---|---|---|
| Talairach coordinates | Volume (μl) | r RT/MT | Talairach coordinates | Volume (μl) | r MT/RT | ||||||
| x | y | z | x | y | z | ||||||
| Frontal lobe | |||||||||||
| Premotor (6) | −36 | −3 | 44 | 2,035 | 0.64 | Premotor (6) | 35 | 0 | 46 | 1,553 | |
| SMA (6) | −5 | 7 | 51 | 643 | SMA (6) | 5 | 8 | 51 | 731 | 0.58 | |
| Middle frontal (9) | −45 | 13 | 30 | 1,705 | Middle frontal (9) | 38 | 13 | 35 | 453 | 0.56 | |
| Middle/inf frontal (10/45) | 23 | 32 | 17 | 905 | |||||||
| Cingulate cortex | |||||||||||
| Anterior cingulate (24, 32) | −7 | 11 | 39 | 964 | Anterior cingulate (24) | 6 | 8 | 42 | 412 | ||
| Parietal lobe | |||||||||||
| Superior parietal (7) | −29 | −64 | 46 | 986 | Superior parietal (7) | 18 | −63 | 46 | 3,331 | ||
| Inferior parietal (40) | −38 | −47 | 43 | 1,081 | 0.59 | Inferior parietal (40) | 40 | −43 | 47 | 1,374 | |
| 0.63 | |||||||||||
| Occipital lobe | |||||||||||
| Middle occipital (18/19) | 28 | −82 | 18 | 2,075 | |||||||
| Superior occipital (19) | 31 | −76 | 38 | 716 | |||||||
| Cuneus (17) | 10 | −83 | 9 | 226 | |||||||
| Subcortical | |||||||||||
| Caudate | 13 | 11 | 9 | 616 | |||||||
| Cerebelluma | |||||||||||
| Lobule VI | −13 | −62 | −22 | 882 | |||||||
Tabled correlations for common regions are based on P < 0.001. Bolded numbers designate correlations between peak activation and RT; italicized numbers designate correlations between peak activation and MT.
Regions identified using the atlas of Schmahmann et al. [2000].
Figure 7.

Transfer phase (Day 2). Results of paired t‐tests comparing old condition with the new sequence and new map conditions (P < 0.005). Regions uniquely activated by the new sequence and new map conditions are shown in red and blue, respectively (numbers correspond to areas in Table IV). Areas in green were active in both transfer conditions (Table III). Regions were considered commonly activated if adjacent regions were located within a 12 mm sphere of each other.
Table IV shows that changing the visuomotor properties of the sequence (new sequence) produced increased activation in many distinct areas. In most of these areas, activation was also significantly greater in the visuomotor than the spatial transfer condition. Of these regions, the most spatially distinctive included the left anterior‐middle frontal cortex (BA 10), bilateral inferior occipital cortex, left caudate, left thalamus, and right cerebellum (Lobule VI). Table IV also shows, however, that increased activation in only a subset of these regions correlated with increased RTs including the left inferior occipital cortex, left thalamus, and left caudate. MT did not correlate with increased activity in any distinct regions in the visuomotor transfer condition.
Table IV.
Distinct regions showing increased MR signal intensity in the new sequence and new map conditions
| Region (BA) | Left hemisphere | Region (BA) | Right hemisphere | ||||||||||
|---|---|---|---|---|---|---|---|---|---|---|---|---|---|
| t | Talairach coordinates | Volume (μl) | r RT | t | Talairach coordinates | Volume (μl) | r RT | ||||||
| x | y | z | x | y | z | ||||||||
| New sequence (visuomotor learning) | |||||||||||||
| Frontal lobe | |||||||||||||
| [1] SMA (6) | 5.1d | −12 | −10 | 52 | 242 | [7] Premotor (6) | 2.2a | 19 | −5 | 57 | 617 | ||
| [2] Premotor (6) | 3.6c | −23 | −17 | 55 | 216 | [8] Inferior frontal (44) | 1.9a | 50 | 9 | 21 | 273 | ||
| [3] Middle frontal (10) | 3.1c | −31 | 43 | 19 | 437 | ||||||||
| Cingulate cortex | |||||||||||||
| [9] Anterior cingulate (24) | 3.3c | 11 | −16 | 36 | 204 | ||||||||
| Occipital lobe | |||||||||||||
| [4] Inferior occipital (18) | 2.6c | −23 | −89 | −8 | 521 | [10] Middle occipital (18) | 4.2c | 26 | −84 | −7 | 916 | ||
| 2.1a | −37 | −83 | −2 | 369 | 0.63 | [11] Inferior occipital (18/19) | 2.9c | 37 | −68 | −2 | 334 | ||
| [12] Middle occipital (19) | 3.7c | 49 | −75 | 9 | 452 | ||||||||
| Subcortical | |||||||||||||
| [5] Thalamus (VPL) | 3.7c | −15 | −16 | 4 | 583 | 0.60 g | [13] Thalamus (DM) | 1.7a | 8 | −21 | 12 | 689 | |
| [6] Caudate | 2.5b | −9 | 8 | 14 | 341 | 0.56 g | |||||||
| Cerebellumh | |||||||||||||
| [14] Lobule VI | 2.4b | 37 | −48 | −23 | 700 | ||||||||
| [15] Lobule IV | 2.9c | 22 | −27 | −30 | 270 | ||||||||
| New map (spatial learning) | |||||||||||||
| Parietal/occipital lobe | |||||||||||||
| [16] Sup occipital (19) + Precuneus (31) | −1.7e | −27 | −74 | 25 | 689 | 0.51 f | |||||||
Numbers in brackets refer to locations of unique activation foci in Figure 7.
P < 0.05;
P < 0.025;
P < 0.01;
P < 0.001;
P = 0.054;
paired t‐tests comparing the magnitude of the fMRI signal (transfer condition minus familiar condition) between the two transfer conditions.
P < 0.01;
P < 0.005 for unique regions, correlations are also displayed for those that approached significance.
Regions identified using the atlas of Schmahmann et al. [2000].
Table IV shows that changing the spatial mapping of responses (new map) resulted in unique activation in the left superior occipital cortex (BA 19) and precuneus (BA 31). There was a trend for activation to be greater in the spatial mapping than the visuomotor transfer condition (P = 0.054). There was also a trend for increased RT, but not MT, to correlate with increased activation in this region.
DISCUSSION
Overview
Our results demonstrated dynamic changes in distributed cortical and subcortical networks as subjects learned motor sequences. These findings highlighted the importance of extended practice in characterizing the neural basis of skill learning, as plasticity in subcortical and cerebellar regions was found only after practicing the sequences for 5 days. Moreover, brain plasticity correlated with improvements in performance in only a subset of regions, suggestive of their preeminence in sequence learning. In early stages of learning, improvements in MT correlated with plasticity in occipital, inferior frontal, and parietal cortices as well as interconnected motor areas (SMA, BA 6, cingulate cortex). These results suggested that early learning is subserved by two networks principally involved in stimulus identification and controlling movements on‐line. This contrasted with later stages of learning in which improvements in RT correlated with plasticity in inferior parietal, subcortical, and cerebellar regions, indicating that skilled performance was supported by networks involved in representing and planning sequential movements.
The patterns of brain plasticity seen in our study were only partially consistent with models that predict a shift in activation from cerebellar–cortical motor areas in early stages of learning to striatal–cortical association areas in later stages of learning [Doyon et al., 2002; Penhune and Doyon, 2002]. Although we found learning‐related decreases in activation in the cerebellum and interconnected motor areas, decreases were found also in the striatum and frontal and parietal cortices, particularly after extended practice. These latter findings also contrasted with results showing a shift from frontal cortex activation in early stages of sequence learning to parietal cortex activation in later stages [Sakai et al., 1998]. Discrepancies between our results and those of others may be partly because that most studies have examined trial‐and‐error learning, where early learning stages emphasize utilization of feedback to formulate a representation of the sequence. In our study, subjects learn the visuomotor and spatial mappings of individual key presses and at the same time, begin to integrate this information into higher‐level programs that represent entire sequences, which allows for automatization of the movement sequences.
Discrepancies among our study and others may also be due to differences in what subjects are learning. Our probes for what subjects learned showed that visuomotor and spatial learning were supported by some distinct neural systems. Moreover, increased activity in some of these systems correlated with increased RT, but not MT, indicating that the transfer conditions interfered with the neural representation of plans for the sequences, but not processes that controlled their implementation. We now turn to a discussion of the patterns of brain plasticity associated with performance during different stages of learning and the neural systems that support representations of specific knowledge in our task.
Plasticity During Early Learning
Although early learning was characterized by plasticity in distributed cortical regions, only a subset was associated with improvements in MT, but not RT. This subset of regions could be separated further into those that receive visual input from the ventral and dorsal streams involved in stimulus identification and spatial processing for action, respectively [Goodale and Milner, 1992]. In the ventral stream, activation increased with practice in the left lingual gyrus, which plays a fundamental role in letter processing [Polk et al., 2002] and decreased with practice in the left inferior frontal cortex (BA 44), which is involved in verbal working memory [Paulesu et al., 1993]. These two interconnected regions are part of a sensory knowledge and identification network [Rushworth, 2000]. Altogether, this pattern of plasticity suggests that with practice, the rehearsal of individual letters declines as the execution of movements becomes increasingly more proficient. The lingual gyrus then begins to play a greater role, perhaps because letter strings start to be recognized as whole sequences.
We observed learning‐related decreases in activation bilaterally within dorsal visual stream projections to the parietal cortex, which correlated with improvements in MT only in the right hemisphere. Learning‐related decreases in the right superior parietal cortex suggested that attention to extrapersonal spatial information [Ungerleider and Haxby, 1994] gradually diminished in the early stage of learning as subjects became familiar with the keyboard. We also found learning‐related decreases in bilateral inferior parietal cortex activation, in keeping with its broad role in integrating sensation for action [Kalaska et al., 1997], but again plasticity correlated with improved MT only in the right parietal cortex. Studies in humans underscore the lateralized roles of the inferior parietal regions, with the left controlling movement [Haaland and Harrington, 1996; Haaland et al., 2004], and the right involved in spatial and temporal attention [Harrington et al., 1998; Posner et al., 1984; Rao et al., 2001]. This leads us to speculate that attention to salient spatial and temporal relationships among individual finger movements is especially important early in learning to develop an integrated representation of the sequence as a whole.
Prefrontal areas also showed plasticity primarily during early stages of learning. Learning‐related plasticity in only the lateral and medial motor areas correlated with MT, however, suggesting that these regions mediate the control of movements represented in the parietal cortex. Bilateral plasticity in the dorsal premotor cortex (PMd) correlated with MT. PMd exhibits greater sequence‐specific activation than does ventral premotor cortex [Kettner et al., 1996]. In addition, activation in PMd is greater when movement sequences are more complex and less predictable [Dassonville et al., 1998; Harrington et al., 2000]. One proposal is that PMd plays a role in selection and retrieval of action plans from the parietal cortex. This proposal is compatible with its correlation with MT in early stages of learning. Plasticity in the SMA proper is also correlated with MT, likely reflecting the role of this region in online planning of sequential movements [Rao et al., 1993].
In contrast to the above results, learning‐related increases in activation were observed in two medial motor areas, the anterior and posterior cingulate. In the posterior cingulate, activation was initially at baseline and then increased with practice. In contrast, the anterior cingulate showed deactivation initially with a gradual increase to baseline. It is possible that this pattern represents a high tonic level of activity in the anterior cingulate during the earliest learning runs, such that a relative deactivation is observed. As the task becomes more automated, the tonic level of anterior cingulate activation during the baseline period may decline and thus eliminate the relative deactivation. Although it is not known why the anterior cingulate might show higher baseline activity than the posterior cingulate, both areas are thought to monitor signals from interconnecting brain regions to facilitate correct and suppress incorrect responses [Awh and Gehring, 1999]. This suggests that as subjects come to recognize the sequential order of finger movements in early stages of learning in our study, cingulate motor areas begin to take on a greater role in monitoring and suppressing incorrect movements, thereby facilitating MT [Naito et al., 2000]. However, extended practice does not continue to have an effect on activity in the cingulate areas, suggesting that processing in this region is optimized quickly and then sustained.
Plasticity During Later Stages of Learning
Extended practice resulted in additional decreases in inferior parietal cortex activation bilaterally, but plasticity in the precuneus, caudate nuclei, thalamus, and cerebellum also emerged. Unlike early learning, plasticity in all of these regions correlated with RT but not MT. These results are compatible with theories that assume sequence learning evolves from online planning of individual responses to advance planning of the entire sequence of responses represented as an integrated unit [Rosenbaum et al., 1984]. This proposal would suggest that activity should decline in areas important for retrieval once sequences are learned due to the reduced demands on memory storage from consolidating sequential responses into higher‐level representations. Indeed, the inferior parietal cortex is activated during the recall of temporal sequences [Penhune and Doyon, 2002], consistent with its hypothesized role in storing higher‐level integrated sensorimotor representations. Similarly, after extended practice we observed declining activity in an area closely associated with episodic memory retrieval, the left precuneus [Fletcher et al., 1996], which also correlated with RT, in keeping with the role of this area in retrieval.
Most cortical regions comprising the dorsal action system described above are thought to relay information by way of the thalamus to the basal ganglia, both of which showed plasticity after extended practice. The basal ganglia have been implicated widely in skill learning, although their precise role is not known [Grafton et al., 1995, 1998; Hikosaka et al., 1996; Jueptner et al., 1997a; Knowlton et al., 1996; Sakai et al., 1998; Toni and Passingham, 1999]. Although many studies have not found plasticity in the basal ganglia [Hazeltine et al., 1997; Hikosaka et al., 1996; Jenkins et al., 1994; Sakai et al., 1998], our results suggest that this may be due to insufficient training of a skill, because plasticity emerged only after extended practice in our study. Importantly, our learning‐related decreases in caudate activation strongly correlated with RT, a measure of advance planning. Several lines of research suggest that the basal ganglia are involved integrally in planning actions [Dagher et al., 1999; Harrington and Haaland, 1991; Postle and D'Esposito, 1999], which are represented in and controlled by interconnecting inferior parietal and prefrontal cortical areas [Cavada and Goldman‐Rakic, 1991; Middleton and Strick, 2000]. We propose that as action plans become consolidated into integrated units and working memory demands drop off, activity in the caudate also declines because these events require less planning.
Our proposal contrasts with the view that basal ganglia activity should increase with practice [Doyon et al., 2003] due to its role in automatization of performance. One difficulty with this model is that automaticity could be indicated by reduced rather than increased brain activation, because fewer cognitive resources are engaged [Wu et al., 2004]. In addition, different patterns of striatal plasticity likely depend upon what subjects learn in early and later stages of practice. This issue is relevant to a model that suggests plasticity in the putamen and caudate can differ due to the different functional roles of their interconnecting cortical circuits [Hikosaka et al., 2002]. For example, muscimol injections in the anterior striatum (associative circuit) of the monkey disrupt learning of a new spatial sequence, whereas injections in the posterior striatum (motor circuit) disrupt the execution of well‐learned sequences [Miyachi et al., 1997]. By analogy, early stages of practice in our task also emphasize learning visuomotor and spatial properties of sequences, which may explain the greater activity in the caudate, premotor, and parietal circuits relative to the extended practice phase. Although plasticity in the putamen was not observed in our study, the presentation of entire sequences may have minimized planning “which” movements to select in our task. This proposal points to the need for models of motor‐skill learning that consider both the functional specificity of corticostriatal circuits, and “what” is learned as a skill becomes increasingly more proficient.
Like the basal ganglia, the cerebellum is also well situated to participate in learning given the interconnections of the dentate nuclei with the prefrontal and parietal cortices [Dum and Strick, 2003]. Although we observed a reduction in cerebellar activation during early learning, it was only after extended practice that continued declines in activation correlated with improved RT, but not MT. Insight into the functional role of the cerebellum in learning was provided recently by Seidler et al. [2002], who showed that the cerebellum did not contribute to motor‐sequence learning per se, but instead to the expression of a skill. In this study, cerebellar plasticity was not seen when performance improvements were suppressed across practice trials by a distractor task. Upon removal of the distractor task, however, subjects showed evidence of sequence learning (reduced RT) that correlated with increased cerebellar activation. One explanation for our results and those of Seidler et al. [2002] is that the cerebellum plays a subsidiary role in planning [Horwitz et al., 2000], perhaps by enhancing sensory or cognitive input from the cerebral cortex [Bower, 1997; Desmond et al., 1997], thereby enabling the detection and correction of visuomotor errors [Flament et al., 1996; Jueptner et al., 1996]. In contrast to others [Doyon et al., 2002], however, learning‐related activation in our study shifted from the cerebellar hemisphere ipsilateral to movement during early learning to the contralateral side after extended practice. One speculation is that declining activity in the right (ipsilateral) cerebellum during early stages of learning in our study may be due to a relatively quick optimization of sensorimotor input from the left hemisphere, which is biased for controlling movement [Haaland and Harrington, 1996]. In contrast, declining activation of the left cerebellum after extended practice might reflect the more gradual adjustments that take place for monitoring right hemisphere processing, which in our task may relate to planning spatiotemporal properties of the entire sequence.
Neural Systems Underlying Visuomotor and Spatial Learning
Changing the visuomotor properties of sequences or their spatial mapping during the transfer conditions increased activity in the same networks that evidenced plasticity during the learning phases of the study. These common regions likely represent processing that is similar between the two transfer conditions, such as increased visual analysis of stimuli, increased motor attention and planning, and inhibition of overlearned responses to the familiar sequences. Unlike early and later stages of learning, however, RT positively correlated with activation in the right middle frontal cortex (BA 9), suggesting that both transfer conditions increased the time to search working memory for subprograms necessary for planning ahead individual movements. Likewise, performance correlated positively with activation in the left inferior parietal (RT and MT), premotor (RT), and right SMA (MT), indicating that behavioral expressions of learning were associated with networks involved in representing and retrieving actions and controlling them online.
The unique areas of activation in response to the visuomotor and spatial probes support the hypothesis that dissociable neural systems associated with different processes mediate learning of a new visuomotor sequence with different allocentric spatial coordinates. Although probing for visuomotor learning involved switching the order of only the last two letters in a sequence, this produced increased activity in distributed systems within the left and right hemispheres. Probing for spatial map learning had a more disruptive effect on RT, but produced only one focus of unique activation. These findings indicated that unique areas of activation were not simply related to the differences between the transfer tasks in performance difficulty or retroactive interference.
Visuomotor learning
Probing for visuomotor learning increased activity in some unique regions, including frontal areas related to executive working memory functions (left BA 10) and maintenance of spatial working memory (right BA 44) [Fletcher and Henson, 2001]. Although activity in these areas did not correlate with performance, RT was associated positively with activity in the left inferior occipital cortex. This result may suggest that the ventral visual pathway participates in a higher‐level visual analysis of the new sequence rather than simply the individual letters [Polk et al., 2002], because the new sequences comprised the same letters as familiar ones. The migration of attention from the individual parts to the whole sequence might develop through top‐down biasing of attention in other cortical regions responsible for consolidating action plans, such as the parietal cortex [Moran and Desimone, 1985]. An alternative possibility is that the inclusion of new letter sequences in this condition required more visual inspection than that in the familiar condition.
Although our results show that the right caudate is involved in learning both visuomotor and spatial regularities of sequences, visuomotor learning was uniquely associated with activity in the left caudate, which correlated with RT, in agreement with its role in planning [Harrington and Haaland, 1991]. Changing the serial ordering of letters in the sequence, as we did to probe for visuomotor learning, increased the time it took to plan sequences. The dominant role of the left caudate might be a reflection of planning the serial ordering of movements [Aldridge and Berridge, 1998; Kermadi and Joseph, 1995], which are represented largely in the left hemisphere [Haaland and Harrington, 1996]. This hypothesis is consistent with the correlation between RT and activation in the left thalamus, which completes the striatothalamocortical loops necessary for basal ganglia–cortical interactions in the left hemisphere. The thalamus also supports cerebellar–cortical interactions, which is relevant to sequence‐specific activation found in Lobule VI of the ipsilateral (right) cerebellum for the new sequence condition. Due to its connections with frontal cortex [Middleton and Strick, 1998], expressions of learning in the right cerebellum may reflect the increased need to monitor enhanced executive working memory functions of the left middle frontal cortex (BA 10) when the serial ordering of learned sequences is changed [Desmond et al., 1997]. This kind of mechanism seems to play a more subsidiary role in the expression of learning [Seidler et al., 2002], as increased cerebellar activity when probing for sequence‐specific learning did not correlate with planning time.
Spatial learning
Probing for spatial learning produced unique activity in the left superior occipital cortex and the precuneus. These results show that changing the keyboard mapping amplified the demands on allocentric spatial processing, thereby increasing activation in systems critically related to this function. This is consistent with the role of the precuneus in motor imagery [Stephan et al., 1995] and visual imagery during encoding and episodic memory retrieval [Fletcher et al., 1996]. Likewise, the findings are in keeping with the role of the dorsal visual pathway in mediating visuomotor transformation processes [Ungerleider and Mishkin, 1982]. The correlation of RT with activation in these regions further supports their preeminence in planning spatial information.
CONCLUSIONS
The present results underscore the importance of studying skill learning over extended practice. Not only did performance continue to improve across 5 days of practicing the sequences, but different time courses of plasticity were uncovered in the central nervous system. These findings have implications for understanding the time course of learning different types of knowledge as individuals become increasingly proficient at performing a skill. During early stages of learning, stimulus identity networks and systems involved in controlling movements online exhibited relatively rapid changes in activity, which then stabilized. This contrasted with changes in the inferior parietal cortex, which began early and continued throughout the course of practicing the sequences. Plasticity in this region, which initially correlated with MT and then correlated with RT after extended practice, seemed to reflect the greater experience required for consolidating sequential movements into integrated representations of actions. Plasticity emerged in yet other regions only after 5 days of practice. We found evidence that was consistent with the involvement of the caudate nucleus and the cerebellum in planning sequential movements.
Through the use of transfer conditions, we demonstrated that acquisition of knowledge about two different properties of learning was supported by neuroanatomically dissociable systems. The distinction between mechanisms that support visuomotor and spatial learning has been grounded in behavioral dissociations between these two forms of knowledge representation. Our study extends this work by suggesting that visuomotor learning was dependent especially upon systems involved in a visual analysis of stimulus elements (inferior visual cortex) and advance planning (caudate nucleus). In contrast, spatial learning was supported by systems involved in visuomotor transformation processes (dorsal visual pathway) and visual imagery at episodic memory retrieval (precuneus).
Acknowledgements
We thank A. Mayer, PhD, and S. Durgerian, MS, for their technical support of this project. We also thank S. Woodley, PhD, for his contributions to the study conception and design.
REFERENCES
- Aldridge JW, Berridge KC (1998): Coding of serial order by neostriatal neurons: A “natural action” approach to movement sequence. J Neurosci 18: 2777–2798. [DOI] [PMC free article] [PubMed] [Google Scholar]
- Awh E, Gehring WJ (1999): The anterior cingulate cortex lends a hand in response selection. Nat Neurosci 2: 853–854. [DOI] [PubMed] [Google Scholar]
- Bower JM (1997): Control of sensory data acquisition In: Schmahmann JD, editor. The cerebellum and cognition. San Diego: Academic Press; p 490–515. [Google Scholar]
- Cavada C, Goldman‐Rakic PS (1991): Topographic segregation of corticostriatal projections from posterior parietal subdivisions in the macaque monkey. Neuroscience 42: 683–696. [DOI] [PubMed] [Google Scholar]
- Cox RW (1996): AFNI: software for analysis and visualization of functional magnetic resonance neuroimages. Comput Biomed Res 29: 162–173. [DOI] [PubMed] [Google Scholar]
- Dagher A, Owen AM, Boecker H, Brooks DJ (1999): Mapping the network for planning: a correlational PET activation study with the Tower of London task. Brain 122: 1973–1987. [DOI] [PubMed] [Google Scholar]
- Dassonville P, Lewis S, Zhu X, Ugurbil K, Kim S, Ashe J (1998): Effects of movement predictability on cortical motor activation. Neurosci Res 32: 65–74. [DOI] [PubMed] [Google Scholar]
- Desmond JE, Gabrieli JDE, Wagner AD, Ginier BL, Glover GH (1997): Lobular patterns of cerebellar activation in verbal working‐memory and finger‐tapping tasks as revealed by functional MRI. J Neurosci 17: 9675–9685. [DOI] [PMC free article] [PubMed] [Google Scholar]
- Doyon J, Penhune V, Ungerleider LG (2003): Distinct contribution of the cortico‐striatal and cortico‐cerebellar systems to motor skill learning. Neuropsychologia 41: 252–262. [DOI] [PubMed] [Google Scholar]
- Doyon J, Song AW, Karni A, Lalonde F, Adams MM, Ungerleider LG (2002): Experience‐dependent changes in cerebellar contributions to motor sequence learning. Proc Natl Acad Sci USA 99: 1017–1022. [DOI] [PMC free article] [PubMed] [Google Scholar]
- Dum RP, Strick PL (2003): An unfolded map of the cerebellar dentate nucleus and its projections to the cerebral cortex. J Neurophysiol 89: 634–639. [DOI] [PubMed] [Google Scholar]
- Flament D, Ellermann JM, Kim SG, Ugurbil K, Ebner TJ (1996): Functional magnetic resonance imaging of cerebellar activation during the learning of a visuomotor dissociation task. Hum Brain Mapp 4: 210–226. [DOI] [PubMed] [Google Scholar]
- Fletcher PC, Henson RN (2001): Frontal lobes and human memory: insights from functional neuroimaging. Brain 124: 849–881. [DOI] [PubMed] [Google Scholar]
- Fletcher PC, Shallice T, Frith CD, Frackowiak RSJ, Dolan RJ (1996): Brain activity during memory retrieval. The influence of imagery and semantic cueing. Brain 119: 1587–1596. [DOI] [PubMed] [Google Scholar]
- Forman SD, Cohen JD, Fitzgerald M, Eddy WF, Mintun MA, Noll DC (1995): Improved assessment of significant activation in functional magnetic resonance imaging (fMRI): use of a cluster‐size threshold. Magn Reson Med 33: 636–647. [DOI] [PubMed] [Google Scholar]
- Goodale MA, Milner AD (1992): Separate visual pathways for perception and action. Trends Neurosci 15: 35–62. [DOI] [PubMed] [Google Scholar]
- Grafton ST, Hazeltine E, Ivry R (1995): Functional mapping of sequence learning in normal humans. J Cogn Neurosci 7: 497–510. [DOI] [PubMed] [Google Scholar]
- Grafton ST, Hazeltine E, Ivry R (1998): Abstract and effector‐specific representations of motor sequences identified with PET. J Neurosci 18: 9420–9428. [DOI] [PMC free article] [PubMed] [Google Scholar]
- Grafton ST, Hazeltine E, Ivry RB (2002): Motor sequence learning with the nondominant left hand. A PET functional imaging study. Exp Brain Res 146: 369–378. [DOI] [PubMed] [Google Scholar]
- Grafton ST, Salidis J, Willingham DB (2001): Motor learning of compatible and incompatible visuomotor maps. J Cogn Neurosci 13: 217–231. [DOI] [PubMed] [Google Scholar]
- Haaland KY, Elsinger CL, Mayer AR, Durgerian S, Rao SM (2004): Motor sequence complexity and performing hand produce differential patterns of hemispheric lateralization. J Cogn Neurosci 16: 621–636. [DOI] [PubMed] [Google Scholar]
- Haaland KY, Harrington DL (1996): Hemispheric asymmetry of movement. Curr Opin Neurobiol 6: 796–800. [DOI] [PubMed] [Google Scholar]
- Haaland KY, Harrington DL, Knight RT (2000): Neural representations of skilled movement. Brain 123: 2306–2313. [DOI] [PubMed] [Google Scholar]
- Harrington DL, Haaland KY (1991): Sequencing in Parkinson's disease: abnormalities in programming and controlling movement. Brain 114: 99–115. [PubMed] [Google Scholar]
- Harrington DL, Haaland KY, Knight RT (1998): Cortical networks underlying mechanisms of time perception. J Neurosci 18: 1085–1095. [DOI] [PMC free article] [PubMed] [Google Scholar]
- Harrington DL, Rao SM, Haaland KY, Bobholz JA, Mayer NH, Binder JR, Cox RW (2000): Specialized neural systems underlying representation of sequential movements. J Cogn Neurosci 12: 56–77. [DOI] [PubMed] [Google Scholar]
- Hazeltine E, Grafton ST, Ivry R (1997): Attention and stimulus characteristics determine the locus of motor‐sequence encoding a PET study. Brain 120: 123–140. [DOI] [PubMed] [Google Scholar]
- Hikosaka O, Nakamura K, Sakai K, Nakahara H (2002): Central mechanisms of motor skill learning. Curr Opin Neurobiol 12: 217–222. [DOI] [PubMed] [Google Scholar]
- Hikosaka O, Sakai K, Miyauchi S, Takino R, Sasaki Y, Putz B (1996): Brain activation during learning of sequential procedures. Electroencephalogr Clin Neurophysiol 47: 245–252. [PubMed] [Google Scholar]
- Jenkins IH, Brooks DJ, Nixon PD, Frackowiak RSJ, Passingham RE (1994): Motor sequence learning: a study with positron emission tomography. J Neurosci 14: 3775–3790. [DOI] [PMC free article] [PubMed] [Google Scholar]
- Jueptner M, Frith CD, Brooks DJ, Frackowiak RSJ, Passingham RE (1997a): Anatomy of motor learning. II. Subcortical structures and learning by trial and error. J Neurophysiol 77: 1325–1337. [DOI] [PubMed] [Google Scholar]
- Jueptner M, Jenkins IH, Brooks DJ, Frackowiak RS, Passingham RE (1996): The sensory guidance of movement: a comparison of the cerebellum and basal ganglia. Exp Brain Res 112: 462–474. [DOI] [PubMed] [Google Scholar]
- Jueptner M, Stephan KM, Frith CD, Brooks DJ, Frackowiak RSJ, Passingham RE (1997b): Anatomy of motor learning. I. Frontal cortex and attention to action. J Neurophysiol 77: 1313–1324. [DOI] [PubMed] [Google Scholar]
- Kalaska JF, Scott S, Cisek P, Sergio LE (1997): Cortical control of reaching movements. Curr Opin Neurobiol 7: 849–859. [DOI] [PubMed] [Google Scholar]
- Karni A, Meyer G, Rey‐Hipolito C, Jezzard P, Adams MM, Turner R, Ungerleider LG (1998): The acquisition of skilled motor performance: fast and slow experience‐driven changes in primary motor cortex. Proc Natl Acad Sci USA 95: 861–868. [DOI] [PMC free article] [PubMed] [Google Scholar]
- Kermadi I, Joseph JP (1995): Activity in the caudate nucleus of monkey during spatial sequencing. J Neurophysiol 74: 911–933. [DOI] [PubMed] [Google Scholar]
- Kettner RE, Marcario JK, Clark‐Phelps MC (1996): Control of remembered reaching sequences in monkey I. Activity during movement in motor and premotor cortex. Exp Brain Res 112: 335–346. [DOI] [PubMed] [Google Scholar]
- Knowlton BJ, Mangels JA, Squire LR (1996): A neostriatal habit learning system in humans. Science 273: 1399–1402. [DOI] [PubMed] [Google Scholar]
- Lee D (2000): Learning of spatial and temporal patterns in sequential hand movements. Brain Res Cogn Brain Res 9: 35–39. [DOI] [PubMed] [Google Scholar]
- MacDonald AW, Cohen JD, Stenger VA, Carter CS (2000): Dissociating the role of the dorsolateral prefrontal and anterior cingulate cortex in cognitive control. Science 288: 1835–1838. [DOI] [PubMed] [Google Scholar]
- Mayr U (1996): Spatial attention and implicit sequence learning: evidence for independent learning of spatial and nonspatial sequences. J Exp Psychol Learn Mem Cogn 22: 350–364. [DOI] [PubMed] [Google Scholar]
- Middleton FA, Strick PL (1998): The cerebellum: an overview. Trends Neurosci 21: 367–369. [DOI] [PubMed] [Google Scholar]
- Middleton FA, Strick PL (2000): Basal ganglia output and cognition: evidence from anatomical, behavioral, and clinical studies. Brain Cogn 42: 183–200. [DOI] [PubMed] [Google Scholar]
- Miyachi S, Hikosaka O, Miyashita K, Karadi Z, Rand MK (1997): Differential roles of monkey striatum in learning of sequential hand movement. Exp Brain Res 115: 1–5. [DOI] [PubMed] [Google Scholar]
- Moran J, Desimone R (1985): Selective attention gates visual processing in the extrastriate cortex. Science 229: 782–784. [DOI] [PubMed] [Google Scholar]
- Muller RA, Kleinhans N, Pierce K, Kemmotsu N, Courchesne E (2002): Functional MRI of motor sequence acquisition: effects of learning stage and performance. Brain Res Cogn Brain Res 14: 277–293. [DOI] [PubMed] [Google Scholar]
- Naito E, Kinomura S, Geyer S, Kawashima R, Roland PE, Zilles K (2000): Fast reaction to different sensory modalities activates common fields in the motor areas, but the anterior cingulate cortex is involved in the speed of reaction. J Neurophysiol 83: 1701–1709. [DOI] [PubMed] [Google Scholar]
- Oldfield RC (1971): The assessment and analysis of handedness: the Edinburgh Inventory. Neuropsychologia 9: 97–113. [DOI] [PubMed] [Google Scholar]
- Paulesu E, Frith CD, Frackowiak RS (1993): The neural correlates of the verbal component of working memory. Nature 362: 342–345. [DOI] [PubMed] [Google Scholar]
- Penhune VB, Doyon J (2002): Dynamic cortical and subcortical networks in learning and delayed recall of timed motor sequences. J Neurosci 22: 1397–1406. [DOI] [PMC free article] [PubMed] [Google Scholar]
- Polk TA, Stallcup M, Aguirre GK, Alsop DC, D'Esposito M, Detre JA, Farah MJ (2002): Neural specialization for letter recognition. J Cogn Neurosci 14: 145–159. [DOI] [PubMed] [Google Scholar]
- Posner MI, Walker JA, Friedrich FJ, Rafal RD (1984): Effects of parietal injury on covert orienting of attention. J Neurosci 4: 1863–1874. [DOI] [PMC free article] [PubMed] [Google Scholar]
- Postle BR, D'Esposito M (1999): Dissociation of human caudate nucleus activity in spatial and nonspatial working memory: an event‐related fMRI study. Brain Res Cogn Brain Res 8: 107–115. [DOI] [PubMed] [Google Scholar]
- Rao SM, Binder JR, Bandettini PA, Hammeke TA, Yetkin FZ, Jesmanowicz A, Lisk LM, Morris GL, Mueller WM, Estkowski LD, Wong EC, Haughton VM, Hyde JS (1993): Functional magnetic resonance imaging of complex human movements. Neurology 43: 2311–2318. [DOI] [PubMed] [Google Scholar]
- Rao SM, Mayer AR, Harrington DL (2001): The evolution of brain activation during temporal processing. Nat Neurosci 4: 317–323. [DOI] [PubMed] [Google Scholar]
- Rosenbaum D, Kenny S, Derr M (1983): Hierarchical control of rapid movement sequences. J Exp Psychol Hum Percept Perform 9: 86–102. [DOI] [PubMed] [Google Scholar]
- Rosenbaum DA, Inhoff AW, Gordon AM (1984): Choosing between movement sequences: a hierarchical editor model. J Exp Psychol 113: 372–393. [Google Scholar]
- Rushworth MFS (2000): Anatomical and functional subdivision within the primate lateral prefrontal cortex. Psychobiology 28: 187–196. [Google Scholar]
- Sakai K, Hikosaka O, Miyauchi S, Takino R, Sasaki Y, Putz B (1998): Transition of brain activation from frontal to parietal areas in visuomotor sequence learning. J Neurosci 18: 1827–1840. [DOI] [PMC free article] [PubMed] [Google Scholar]
- Sakai K, Ramnani N, Passingham RE (2002): Learning of sequences of finger movements and timing: frontal lobe and action‐oriented representation. J Neurophysiol 88: 2035–2046. [DOI] [PubMed] [Google Scholar]
- Schlaug G, Knorr U, Seitz RJ (1994): Inter‐subject variability of cerebral activations in acquiring a motor skill: A study with positron emission tomography. Exp Brain Res 98: 523–534. [DOI] [PubMed] [Google Scholar]
- Schmahmann J, Doyon J, Toga A, Petrides M, Evans A. (2000): MRI atlas of the human cerebellum. San Diego: Academic Press. [DOI] [PubMed] [Google Scholar]
- Seidler RD, Purushotham A, Kim SG, Ugurbil K, Willingham D, Ashe J (2002): Cerebellum activation associated with performance change but not motor learning. Science 296: 2043–2046. [DOI] [PubMed] [Google Scholar]
- Smith E, Jonides J (1999): Storage and executive processes in the frontal lobes. Science 283: 1657–1661. [DOI] [PubMed] [Google Scholar]
- Stephan KM, Fink GR, Passingham RE, Silbersweig D, Ceballos‐Baumann AO, Frith CD, Frackowiak RS (1995): Functional anatomy of the mental representation of upper extremity movements in healthy subjects. J Neurophysiol 73: 373–386. [DOI] [PubMed] [Google Scholar]
- Talairach J, Tournoux P. (1988): Co‐planar stereotaxic atlas of the human brain New York: Thieme. [Google Scholar]
- Toni I, Krams M, Turner R, Passingham RE (1998): The time course of changes during motor sequence learning: a whole‐brain fMRI study. Neuroimage 8: 50–61. [DOI] [PubMed] [Google Scholar]
- Toni I, Passingham RE (1999): Prefrontal‐basal ganglia pathways are involved in the learning of arbitrary visuomotor associations: a PET study. Exp Brain Res 127: 19–32. [DOI] [PubMed] [Google Scholar]
- Toni I, Ramnani N, Josephs O, Ashburner J, Passingham RE (2001): Learning arbitrary visuomotor associations: temporal dynamic of brain activity. Neuroimage 14: 1048–1057. [DOI] [PubMed] [Google Scholar]
- Ungerleider LG, Haxby JV (1994): “What” and “where” in the human brain. Curr Opin Neurobiol 4: 157–165. [DOI] [PubMed] [Google Scholar]
- Ungerleider LG, Mishkin M (1982): Two cortical visual systems In: Ingle DJ, Goodale MA, Mansfield RJW, editors. Analysis of visual behavior. Cambridge: MIT Press; p 549–586. [Google Scholar]
- Willingham DB, Wells LA, Farrell JM, Stemwedel ME (2000): Implicit motor sequence learning is represented in response locations. Mem Cognit 28: 366–375. [DOI] [PubMed] [Google Scholar]
- Wu T, Kansaku K, Hallett M (2004): How self‐initiated memorized movements become automatic: a functional MRI study. J Neurophysiol 91: 1690–1698. [DOI] [PubMed] [Google Scholar]