

Abstract
Postmortem data suggest that trans‐synaptic degeneration occurs in the lateral geniculate nucleus after optic nerve injury. This study investigated in vivo the optic radiations in patients affected by optic neuritis using fast marching tractography (FMT), a diffusion magnetic resonance imaging (MRI) fiber tracking method, and group mapping techniques, which allow statistical comparisons between subjects. Seven patients, 1 year after isolated unilateral optic neuritis, and ten age and gender‐matched controls underwent whole‐brain diffusion tensor MR imaging. The FMT algorithm was used to generate voxel‐scale connectivity (VSC) maps in the optic radiations in each subject in native space. Group maps of the left and right optic radiations were created in the patient and control group in a standardized reference frame using statistical parametric mapping (SPM99). The reconstructed optic radiations in the patient group were localized more laterally in the posterior part of the tracts and more inferiorly than in the control group. Patients showed reduced VSC values in both tracts compared with controls. These findings suggest that the group mapping techniques might be used to assess changes in the optic radiations in patients after an episode of optic neuritis. The changes we have observed may be secondary to the optic nerve damage. Hum Brain Mapp, 2005. © 2005 Wiley‐Liss, Inc.
Keywords: optic neuritis, MRI, diffusion, tractography
INTRODUCTION
The directional bias of microscopic water molecule diffusion is characterized at the macroscopic level by the magnetic resonance (MR) technique of diffusion tensor imaging (DTI) [Basser et al.,1994]. This diffusion is restricted or hindered in vivo by the presence of obstacles, such as cellular membranes and fibers, and may exhibit directional bias (anisotropy) in orientations relatively free of obstruction. In brain white matter, the water molecules diffuse more freely along the neuronal projections or axons rather than across them [Pierpaoli and Basser,1996]. DTI has the potential to identify the dominant direction of diffusion and the magnitude of anisotropy within a single voxel, providing indirect information about tissue microstructure and organization of fibers. However, it cannot give explicit information about the connection between adjacent voxels. Diffusion tractography allows inferences about inter‐voxel fiber tract connection to be made from DTI [Basser et al.,2000; Conturo et al.,1999; Gossl et al.,2002; Jones et al.,1999b; Mori et al.,1999,2000; Poupon et al.,2000; Stieltjes et al.,2001; Xue et al.,1999]. Recently, one technique, called fast marching tractography (FMT) [Parker et al.,2002b] has generated voxel‐scale connectivity (VSC) maps in vivo within the brain using the information provided by DTI. The FMT‐derived maps provide, at each voxel in the brain, a scalar value that ranks the degree of connection to a particular seed point. Regions of voxels with the highest VSC are interpreted as defining the white matter pathways connected to the seed point. FMT has been validated in part by application to animal data [Parker et al., 2002a], and by comparison with standard atlases [Parker et al.,2002b]. It has been used to reconstruct the major white matter tracts, including the callosal fibers, the corticospinal tracts, and the optic radiations [Ciccarelli et al.,2003a]. In a recent study [Ciccarelli et al.,2003a], we found that the total volumes of the FMT‐derived corticospinal tracts and optic radiations were consistent with postmortem data [Burgel et al.,1999; Rademacher et al.,2001].
The non‐invasive tracking of white matter fibers has important clinical implications and might provide further anatomic insights into the mechanisms of white matter damage occurring in pathologic conditions, such as brain tumors [Mori et al.,2002] and stroke [Pierpaoli et al.,2001]. As a first step toward the investigation of white matter pathology, group maps in a large population of normal volunteers have been created using FMT and statistical parametric mapping (SPM99; Wellcome Department of Cognitive Neurology, Institute of Neurology, London, UK) to determine the normal intersubject variability of white matter pathways [Ciccarelli et al.,2003b]. Two different but complementary techniques have been developed: the first produces maps that demonstrate the intersubject spatial variability, whereas the second provides a statistical image that represents the group effect, i.e., the degree of statistical compatibility within the group. These probabilistic group maps have the potential to identify differences in white matter connectivity between normal and disease groups.
Optic neuritis provides a useful model for studying the effects of inflammatory demyelination on the central nervous system (CNS) through the ability of MR imaging (MRI) to visualize the optic nerves and optic radiations. Postmortem data obtained from patients with multiple sclerosis have suggested that the pathologic processes that affect the optic nerve may include a combination of inflammation, demyelination, astrocytosis, and axonal destruction [de Preux and Mair,1974]. Axonal transection occurring in the acute optic neuritis lesions [Ferguson et al.,1997; Trapp et al.,1998] may lead to Wallerian degeneration and subsequent optic nerve atrophy [Hickman et al.,2001]. Trans‐synaptic changes also occur in the lateral geniculate nucleus (LGN) [Madigan et al.,1996], from which the efferent fibers projecting to the visual cortex and constituting the optic radiations originate. A recent study [Evangelou et al.,2001] showed that axonal loss in the optic nerves of patients with multiple sclerosis correlated strongly with the selective atrophy of the smaller neurons of the parvocellular layer in the LGN.
The present study was carried out to test the hypothesis that the quantitative tract measures (i.e., volume and anisotropy) and the VSC values of the FMT‐derived optic radiations change in patients after an episode of optic neuritis. We used tractography‐based group mapping techniques to carry out statistical comparisons between seven patients and ten controls. The relationship between the presence of incidental lesions in the optic radiations of four patients and the VSC values of the FMT‐derived optic radiations was also explored.
SUBJECTS AND METHODS
Subjects
Seven patients (mean age ± standard deviation [SD], 37.3 ± 9.4 years; all women), 1 year after the first episode of isolated unilateral optic neuritis [Compston et al.,1978], were recruited from the Neuro‐Ophthalmology Clinic at Moorfields Eye Hospital, London. Visual acuity, which was measured as the 4m logMAR acuity [Ferris et al.,1982] using a retro‐illuminated early treatment diabetic retinopathy study (ETDRS) chart, and whole‐field pattern‐reversal visual evoked potentials (VEPs) [Brusa et al.,2001] were recorded at baseline and after 1 year (Table I). The median delays from onset of visual symptoms to the first visit and to 1‐year follow‐up were 14 days (range, 8–23 days) and 368 days (range, 366–375 days), respectively. At the time of the episode of acute unilateral optic neuritis, the patients had no other neurologic signs or history of previous demyelinating episodes. During the follow‐up period, there were no further episodes of optic neuritis or neurologic symptoms in any of the patients. Most patients made a good clinical recovery from the episode of unilateral optic neuritis (Table I; note that a visual acuity of 0.0, equivalent to Snellen 6/6, or less was considered normal). Ten age‐matched controls (mean age ± SD, 33.7 ± 9.7 years; all women) were also imaged. All subjects gave informed, written consent before the study, which was approved by the local research ethics committee.
Table I.
Clinical and radiological parameters of patients
| Patient no. | Age (yr) | Eye | Visual acuity | VEP latency (ms) and amplitude (μV) | Lesion load (cm3) | |||
|---|---|---|---|---|---|---|---|---|
| Baseline | 1‐year | Baseline | 1‐year | Left OR | Right OR | |||
| 1 | 36 | Right | +1.7 | −0.1 | 138.5; 2.4 | 125.9; 8.8 | 0.11 | 0.6 |
| 2 | 30 | Right | +0.36 | −0.2 | 108.4; 3.3 | 111.8; 12.6 | 2.08 | 1.56 |
| 3 | 54 | Left | +1.24 | +0.62 | 108.4; 1.1 | 140.0; 2.8 | 0.14 | 0.29 |
| 4 | 43 | Left | +0.22 | −0.08 | 112.3; 8.4 | 118.6; 11.4 | 0 | 1.01 |
| 5 | 25 | Right | +0.2 | −0.1 | 107.4; 18.1 | 117.1; 35.9 | 0 | 0 |
| 6 | 34 | Right | +0.1 | −0.1 | 130.3; 9.5 | 113.7; 23.5 | 0 | 0 |
| 7 | 39 | Left | +1.12 | −0.1 | 135.6; 1.8 | 108.9; 4.5 | 0 | 0 |
Visual acuity and whole‐field visual evoked potentials (VEPs) are reported for the affected eye. When no letters could be identified correctly, a visual acuity of 1.7 was scored.
Eye, affected eye; OR, optic radiation.
MRI Protocol
All imaging was carried out on a 1.5‐T Signa Echospeed MRI system (GE Medical Systems, Milwaukee, WI). All subjects had axial brain dual echo fast spin echo (FSE) imaging acquired before DTI, providing proton density (PD) and T2‐weighted images (repetition time [TR] 2,000 ms, echo time [TE] 30/120 ms, field of view (FOV) 24 × 24 cm, matrix 256 × 256, 28 contiguous axial slices, and 5‐mm slice thickness). Four patients had demyelinating lesions in the right optic radiation (mean ± SD, 1.6 ± 1.8; range, 0–4), and three also had lesions in the left optic radiation (mean ± SD, 0.6 ± 0.8; range, 0–2). These lesions were located mainly around the trigones of the lateral ventricles. Lesions in the optic radiations were quantified on the PD electronic images by an observer (O.C.) blinded to clinical findings using a semiautomated local thresholding technique incorporating a contour‐based algorithm (Table I).
The diffusion protocol consisted of a single‐shot diffusion‐weighted (DW) echo‐planar imaging (EPI) sequence. The diffusion acquisition parameters were: TE 95 ms, acquisition matrix 96 × 96 reconstructed as 128 × 128, FOV 24 × 24 cm, pixel resolution 2.5 × 2.5 mm2 reconstructed to 1.9 × 1.9 mm2, 3 b ∼ 0 smm−2 images, 60 DW images with diffusion gradients applied along 60 optimized diffusion directions [Jones et al.,1999a], diffusion times of δ = 32 ms and Δ = 40 ms, and max gradient amplitude of 22 × 10−3 Tm−1, giving a maximum b‐factor b = 1,000 smm−2, 42 contiguous axial slices, 2.5‐mm slice thickness, and diffusion data acquisition time of 20–30 min depending on subject's heart rate (cardiac gating was used to reduce motion artefacts due to pulsation of blood and cerebrospinal fluid [CSF]). Correction of eddy‐current distortions in DW‐EPI was carried out using a 2D image registration technique [Symms et al.,1997]. The data were then processed to determine the diffusion tensor on a voxel‐by‐voxel basis, from which fractional anisotropy (FA) maps were calculated [Basser and Pierpaoli,1996; Pierpaoli and Basser,1996].
Quantification of Tract Measures
The FMT algorithm [Parker et al.,2002b] was used to reconstruct the optic radiations using the information contained in the diffusion tensor at each voxel. On the axial slice, where the transition from the posterior limb of the internal capsule to the cerebral peduncle was visible, a voxel within the optic radiation at the apex of the arc (Meyer's loop) around the lateral ventricle, with the main eigenvector in an anterior–medial to posterior–lateral orientation in axial projection, was chosen as the starting point for each optic radiation. Each starting voxel had a FA value >0.5, which ensured that it was located within white matter. Placement was also checked with visual reference to the corresponding slices of the PD and T2‐weighted images. To speed up the FMT analysis, a restricted brain volume was used, which included the hemisphere of interest posterior to the genu of internal capsule. All studies were carried out with a FA threshold of 0.1 and a diffusivity threshold of 2.0 × 10⁻³ mm2/s to ensure that the paths detected would not erroneously enter areas of CSF. The FMT algorithm generates a VSC map of the restricted brain volume that provides at each voxel a quantitative estimate of the degree of connectivity to the chosen starting point. Figure 1 shows the VSC maps of the left and right optic radiations in those patients who had incidental optic radiation lesions. A histogram of each VSC map was created, and a threshold technique defining a group of voxels with the highest VSC to the starting point was identified. This thresholding technique was objective and determined a priori. Every histogram showed a significant peak that contained the greatest number of voxels with the highest VSC values. The threshold for each histogram was defined by selecting the VSC value that isolated this peak. The connectivity threshold varied between subjects, but was specific for each optic radiation [Ciccarelli et al.,2003a]. This threshold was then applied to the VSC map to define regions of interest (ROIs) with the highest VSC values, and subsequent thresholded maps were obtained. These ROIs were then overlaid on the FA maps and they were interpreted as regions defining the optic radiations connected to the starting point [Ciccarelli et al.,2003a]. From these ROIs, two parameters were calculated: (1) the mean FA; and (2) the total volume.
Figure 1.
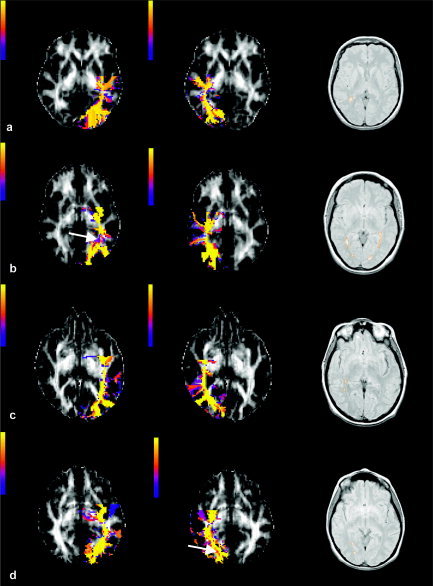
VSC maps of the left and right optic radiations of four patients who showed incidental optic radiation lesions (i.e., the first four patients in Table I) obtained in native space and overlaid on FA maps. Lesions are outlined on the PD images. The color scale indicates the VSC values. Optic radiations show posterior connection to the visual cortex and medial connections to the LGN. There are also false positive tracts that project anteriorly, which represent fronto‐occipital fibers that run close to the optic radiations for a short distance. The reconstructed optic radiations pass through all the lesions, and in two cases (b and d), the VSC of the voxels in the lesions seemed lower than that of voxels outside the lesion (see white arrows in b and d). VSC values of the tract downstream of lesions remained high regardless of local pathology.
Group Mapping
For each optic radiation of each subject, two types of VSC maps were generated in native space: (1) thresholded (masked) VSC maps, which were binary images that indicated where the connected volumes were located; and (2) unthresholded VSC maps, which were raw VSC maps and preserved the VSC value at each voxel.
These maps were normalized into a standardized space (as defined by the Montreal Neurological Institute [MNI]) using SPM99. This was carried out by initially normalizing each non‐DW (b = 0 or b0) image to the default EPI template, which shares similar T2‐weighted contrast. The normalization parameters were estimated with the following settings: 12 parameter affine transformation followed by nonlinear warping with 7 × 8 × 7 basis function sets, 12 nonlinear iterations, medium regularization, and default brain mask. The b0 normalization parameters were then applied to the individual VSC maps (which were in the same stereotactic space as the original b0 images). The resampled voxel size was 2 × 2 × 2 mm for normalization. Nearest‐neighbor interpolation of the VSC maps was used to maintain the connectivity values derived using FMT. The resulting normalized thresholded and unthresholded VSC maps were used to construct the following group maps in patients and controls (for more details see Ciccarelli et al. [2003b]).
Variability group maps
For each group, the normalized, thresholded (i.e., binary) VSC maps were averaged across subjects at each point in standard space to produce a map that indicated the degree of overlap of the tracts between subjects.
SPM analysis of unthresholded maps
The normalized, unthresholded VSC maps were initially smoothed at 7 mm. Smoothing results in the distribution from which the voxel values are drawn being approximately normal (through the central limit theorem) and allows the use of standard parametric statistics to make inferences about differences and similarities between VSC patterns [Ashburner and Friston,2000].
Comparisons Between Groups
Differences in quantitative measures and group maps of the FMT‐derived optic radiations between patients and controls were investigated as described below.
Quantitative tract measures
The Mann‐Whitney U test was used to compare the FA values and the total tract volumes in the left and right optic radiations between patients and controls; P values less than 0.05 were considered significant.
Variability group maps
To investigate the differences in the tract overlap between patients and controls, the variability group map that represented the patient group was subtracted from the control variability group map. The resulting “difference” map illustrated the degree of spatial overlap between the two groups.
Because the location of the reconstructed optic radiations depends on starting point placement, the consistency of seed voxel location within the standardized reference frame (MNI space) was assessed for each optic radiation across subjects. Each seed voxel coordinate (defined in native space) was normalized with the same spatial transformation parameters as the VSC maps. In each group, the mean and the standard deviations of the x, y, and z coordinates for the normalized starting voxels were calculated.
SPM‐derived unthresholded maps
Differences in the group maps obtained by the SPM analysis of the unthresholded VSC maps between patients and controls were investigated. The individual smoothed map of each optic radiation was entered into a design matrix for a two‐sample t test. After model estimation, a one‐tailed t contrast was used to test whether VSC was reduced in the patient group. Uncorrected SPM(T) maps were generated at P < 0.001. Statistical inferences were then carried out from the SPM(T) maps by correcting for multiple comparisons within a mask volume, using P < 0.05 corrected at voxel level. This mask volume was generated a priori for the left and right optic radiation using MRIcro [Rorden and Brett,2000]. The main cerebral sulci and the labeling of the Talairach and Tournoux atlas [Talairach and Tournoux,1988] were used to draw these masks on the high‐resolution T1‐weighted images.
Systematic differences in the accuracy of spatial normalization may contribute to differences found in the statistical comparisons between the patient and control group VSC maps. For example, spatial normalization in the patient group may be influenced by the presence of lesions around the trigones, whereas the control group would have no such influences. We therefore tested for differences in the voxel intensity of the normalized b0 images between patients and controls. Individual normalized b0 images were first smoothed at 7 mm, and then subject‐specific b0 images were entered into a design matrix for a two‐sample t test. Two contrasts, e.g., patients greater than controls and controls greater than patients, were estimated. Statistical SPM(T) images were thresholded at P < 0.05 corrected at voxel level for multiple comparisons within the optic radiation mask volumes.
Effect of Incidental Optic Radiation Lesions on VSC
To investigate whether the presence of incidental lesions in the optic radiation had a significant effect on the VSC values, a linear regression analysis was carried out using SPM99. The lesion load of the right optic radiation was included as regressor, and a negative correlation between the right VSC maps and the lesion load was investigated. A separate analysis was repeated in the same way for the left optic radiation. Statistical inferences were carried out using P < 0.05 corrected at voxel level for multiple comparisons within the optic radiation mask volumes. We also carried out comparisons between the optic radiation VSC of those patients who had lesions within the optic radiation with those who did not using a two‐sample t test. P < 0.05 corrected at voxel level for multiple comparisons within the tract mask volumes was used to threshold the SPM(T) images.
To investigate whether areas of significant change in VSC corresponded to any of the incidental lesions in the optic radiations, the coordinates of the center of the lesions were assessed on the normalized b0 images in patients using the T2‐weighted images as guidance. These coordinates were compared to the coordinates of the peak of the differences detected using the group maps.
RESULTS
FMT‐Derived VSC Maps
The VSC maps of optic radiations derived from FMT in native space were consistent with known anatomy of the tracts studied [Crosby et al.,1962]: they showed posterior connections to the visual areas and medial connections to the lateral geniculate nuclei. The FMT‐derived optic radiations of those patients who had lesions in the optic radiations clearly passed through the lesions (Fig. 1). In two cases, lesions showed a reduced VSC value compared to that of voxels in the adjacent white matter (Fig. 1b,d). The VSC of the tract downstream of the lesion was not affected by the presence of the lesion itself.
Comparisons Between Groups
Tract measures
There were no significant differences in the mean FA of the FMT‐derived left and right optic radiations between patients and controls (Table II). Patients had lower volumes of both left and right optic radiations compared with controls, but these differences were not significant (Table II).
Table II.
Differences in fractional anisotropy and tract volume of the left and right optic radiations between patients and controls
| Parameter | Patients | Controls | ||
|---|---|---|---|---|
| Left OR | Right OR | Left OR | Right OR | |
| Fractional anisotropy | 0.30 ± 0.04 | 0.29 ± 0.02 | 0.32 ± 0.04 | 0.31 ± 0.03 |
| Tract volume (cm3) | 4.7 ± 1.5 | 4.2 ± 1.2 | 5.6 ± 1.6 | 5.6 ± 1.4 |
Values are given as means ± SD.
OR, optic radiations.
Variability group maps
The difference map, which represented the degree of tract overlap between patients and controls, was overlaid onto a structural template (Fig. 2A). The “hot” color scale indicates the proportional degree of overlap between the two groups. For example, 0.8 indicates that the voxel in question is within the optic radiation in 80% more controls than patients, −0.4 represents 40% more patients than controls, and 0 represents no difference between the two groups (i.e., the voxel is within the optic radiation in the same proportion of patients and controls).
Figure 2.
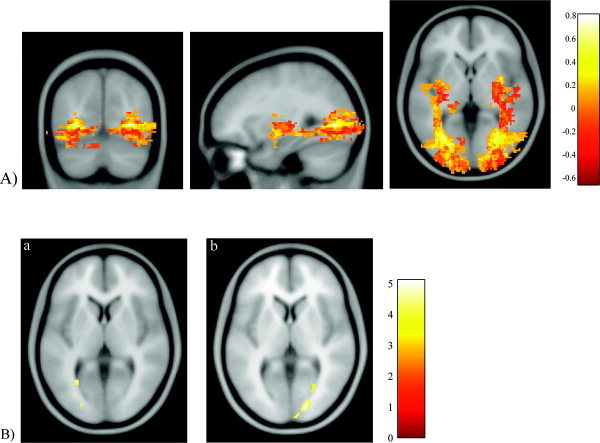
A: Difference in the degree of spatial variability between patients and controls overlaid onto a structural template (MNI coordinates x, y, z [in mm] = −30.2, −70.1, and 0.4). The hot color scale indicates the difference in overlapping between the two groups, with yellow representing a bias toward the control group and red representing a bias toward the patient group. Reconstructed optic radiations do not show only posterior connections to the visual areas and medial connections to the LGN, but also some false positive connections, as anterior and superior projections from the LGN, which may reflect inferior fronto‐occipital fibers, and are known to accompany optic radiations for a short distance. B: Left optic radiation (a). Patients show reduced voxel‐scale connectivity (VSC) compared to that in controls with the peak of the difference posterior and adjacent to the trigone (corrected P = 0.04; MNI coordinates x, y, z [in mm] = −28, −62, and 4). A second area localized more distally shows a trend for reduced VSC in patients (corrected P = 0.06; MNI coordinates x, y, z [in mm] = −24, −88, and 6). Right optic radiation (b). Patients show reduced VSC compared to that in controls with the peak localized in the distal part of the tract (corrected P = 0.01; MNI coordinates x, y, z [in mm] = 18, −88, and 4). A second area posterior and adjacent to the trigone also shows reduced VSC in patients (corrected P = 0.04; MNI coordinates x, y, z [in mm] = 28, −66, and 2). At the termination of the right optic radiation, a third area shows a trend for reduced VSC in patients (corrected P = 0.07; MNI coordinates x, y, z [in mm] = 10, −96, and 6). The color scales indicate the t scores.
This difference group map showed that in the patient group, the optic radiations were localized more laterally in the posterior part of the tracts and more inferiorly than in the control group.
There were no significant differences in starting point placement between the two groups (Table III), which could have affected the location of the reconstructed optic radiations.
Table III.
Assessment of starting point placement in normalized space (MNI) for each optic radiation in each group of subjects
| Parameter | Starting voxel coordinates | ||
|---|---|---|---|
| x | y | z | |
| Left optic radiation | |||
| Patients | 20.6 ± 1.1 | 42.7 ± 3.0 | 22.7 ± 1.9 |
| Controls | 20.0 ± 0.9 | 43.1 ± 3.2 | 23.1 ± 1.2 |
| Right optic radiation | |||
| Patients | 56.3 ± 1 | 43.6 ± 2.3 | 24.1 ± 1.8 |
| Controls | 57.2 ± 1 | 45.5 ± 2.2 | 22.7 ± 1.8 |
Values are given as mean ± SD for x (left–right), y (posterior–anterior), and z (inferior–superior) coordinates (in voxel units). The normalized voxel size was 2 × 2 × 2 mm.
SPM‐derived unthresholded maps
Optic neuritis patients demonstrated significantly reduced VSC in both optic radiations when compared to that in controls. In the left optic radiation, the peak difference was adjacent to the trigone (P = 0.04), whereas in the right optic radiation the peak was in the distal part of the tract (P = 0.01) (Fig. 2B). In the right optic radiation, there was a second area posterior and adjacent to the trigone, with reduced VSC in patients (P = 0.04) (Fig. 2B). Finally, the comparison of the normalized b0 images between patients and controls did not show any differences.
Effect of Incidental Optic Radiation Lesions on VSC
We found no significant correlation between the VSC of both the left and right optic radiations and the tract lesion loads. In addition, patients who showed lesions in the optic radiations did not have different VSC compared to that in those without lesions. The coordinates of peaks of significant lower VSC in patients did not correspond to the coordinates of the center of the lesions visible on the normalized b0 images.
DISCUSSION
We investigated the hypothesis that differences in anisotropy, volume, location, and VSC of the optic radiations reconstructed using FMT [Ciccarelli et al.,2003a; Parker et al., 2002a,b] can be found between controls and patients after their first and isolated episode of optic neuritis. Our measure of anatomic connectivity or VSC [Ciccarelli et al.,2003a,b] was derived from a “local” approach, which is based on the fast marching algorithm. Substantially different approaches to cerebral white matter connectivity mapping have been described recently and rely on global approaches to the acquired diffusion tensor MRI data [Lenglet et al.,2004; O'Donnell et al.,2002]. These methods can potentially track fibers across areas with multiple fiber orientations, but applications to groups of healthy subjects and patients with white matter diseases have not yet been reported.
The group mapping techniques used in this study comprise novel applications of diffusion tractography that enable statistical comparisons between groups [Ciccarelli et al.,2003b]. Previous work has generated probability group maps of the callosal fibers in a group of 10 subjects by directly applying spatial normalization to the tracked fibers to remove gross interindividual anatomic variability [Xu et al.,2002], although the tracking and normalization methods were different from those applied in our study. An alternative group mapping approach has been proposed recently by Jones et al. [2002]; it consists of registering the DTIs of several subjects to obtain a group tensor atlas before tracking white matters fibers. This group atlas can be used to explore white matter abnormalities in patients with neurological disease, as proposed by Park et al. [2003]. Investigations of differences in group mapping measures, such as tract VSC, shape, and location, between patients with demyelinating disorders and controls, have not yet been carried out. Only qualitative group comparisons using SPM99 have been reported [Guye et al.,2003].
We found that the optic radiations of patients were localized more laterally in the posterior part of the tracts and more inferiorly (Fig. 2A), and that patients had reduced VSC values in both optic radiations, compared with controls (Fig. 2B).
These results were not related to the starting point placement, or to a difference in the normalization process between patients and controls. In fact, group mapping techniques, which put tractography outputs into a standardized space, rely on the spatial normalization used to bring them into a common space. The spatial transformation of the images into a standardized space inevitably introduces errors. We tested whether these errors significantly affect comparisons between patients and controls by comparing the normalized b0 images between the two groups. We found no significant differences, suggesting that the normalization errors if present would have been distributed evenly and did not account for the observed differences between groups. Spatial normalization of the diffusion tensor has been evaluated recently [Park et al.,2003], and it would be of interest to compare it to the errors that may be produced by spatial transformation of connectivity maps (after having applied tractography using the diffusion tensor maps in native space).
The striking finding of reduced VSC in the optic radiations of patients may be explained by the mechanism of trans‐synaptic dystrophy secondary to the optic nerve damage and loss of afferent axons in the LGN, which has been detected in postmortem studies [Evangelou et al.,2001]. The reduced VSC may therefore reflect a reduction in axonal density and volume of the optic radiation fibers, which originate in the LGN.
We also examined whether lesions in the optic radiations, which are well described in optic neuritis [Hornabrook et al.,1992], could have contributed to reduce optic radiation VSC values as a result of local axonal degeneration [Ferguson et al.,1997; Trapp et al.,1998]. We did not find a significant relationship between optic radiation lesion load and the tract VSC, and there were no differences in optic radiation VSC between patients who had lesions compared with those who did not. In addition, the peaks of lower VSC in patients did not correspond to coordinates of the center of the lesions on normalized b0 images, although the optic radiation VSC of patients with lesions in native space showed that two lesions had reduced VSC compared to that of voxels in the adjacent white matter (Fig. 1b,d). The VSC maps derived from FMT showed that the algorithm is able to track through lesions and that in our cases, the VSC values of the tract downstream of the lesions remained high, regardless of the presence or absence of local pathology.
No differences were found between patients and controls in the estimated anisotropy and tract volumes, although in the patient group a reduction of both types of measures, as a result of axonal degeneration or dystrophy, was expected. This may relate to technical limitations, such as the low spatial resolution of DTI (which provides information concerning the average orientation of fibers within the same voxel), or to the low value of FA in controls. This FA value might be due to the presence within the identified optic radiation volume of gray‐matter regions, which contain the points of origin and termination of the fibers, or to the presence of crossing or curving fibers within voxels. The fact that there were no significant differences in the estimated tract volume might relate to dystrophy of the smaller neurons, which are preferentially susceptible to trans‐synaptic damage of the LGN [Evangelou et al.,2001]. Moreover, the patient group sample size was small and may well have limited the detection of subtle group differences in both measures.
Previous studies have shown a reorganization of the cerebral response to visual stimuli after optic neuritis [Toosy et al.,2002; Werring et al.,2000], and have suggested that this may represent an adaptive response to an abnormal input. It is possible that at least part of this functional reorganization is associated with changes in the structural connections that participate in the transmission of the visual stimuli. An interesting question is whether the tract structural changes contribute to the recovery of visual acuity, and future longitudinal studies looking at the relationships between clinical recovery and structural and functional changes may help to answer this.
In conclusion, our findings showed that tractography‐based group mapping detects subtle pathologic abnormalities beyond macroscopic lesions in the optic radiations of patients affected previously by optic neuritis, and can provide further anatomic insights into mechanisms of white matter damage. We have explored the possible impact of lesions on the tractography‐derived tract measures, which is a potential issue for any other tractography algorithm, and concluded that the observed differences in VSC between patients and controls is secondary to the optic nerve damage rather than to local pathology. We have also demonstrated that FMT is able to track through lesions. Longitudinal studies in a larger patient group will aim to investigate whether the structural changes occurring in the optic radiation after optic neuritis, together with the functional changes, contribute to the patients' clinical recovery.
Acknowledgements
The NMR Unit is supported by a generous grant from the Multiple Sclerosis Society of Great Britain and Northern Ireland. Dr. O. Ciccarelli was supported during this study by the Department of Headache, Brain Injury and Neurorehabilitation, Institute of Neurology, UCL, London. Dr. S.J. Hickman was supported by The Wellcome Trust, and Dr. A.T. Toosy was supported by the Brain Research Trust.
We thank D. MacManus, R. Gordon, and C. Benton for technical assistance with MR imaging, Dr. S.J. Jones, who carried out the VEPs, Prof. G. Plant for his help with the recruitment of patients, Prof. G.J. Barker and Dr. P.A. Boulby for their contribution to the pulse sequence implementation, and subjects for kindly agreeing to take part in this study.
REFERENCES
- Ashburner J, Friston KJ (2000): Voxel‐based morphometry—the methods. Neuroimage 11: 805–821. [DOI] [PubMed] [Google Scholar]
- Basser PJ, Mattiello J, LeBihan D (1994): Estimation of the effective self‐diffusion tensor from the NMR spin echo. J Magn Reson B 103: 247–254. [DOI] [PubMed] [Google Scholar]
- Basser PJ, Pajevic S, Pierpaoli C, Duda J, Aldroubi A (2000): In vivo fiber tractography using DT‐MRI data. Magn Reson Med 44: 625–632. [DOI] [PubMed] [Google Scholar]
- Basser PJ, Pierpaoli C (1996): Microstructural and physiological features of tissues elucidated by quantitative‐diffusion‐tensor MRI. J Magn Reson B 111: 209–219. [DOI] [PubMed] [Google Scholar]
- Brusa A, Jones SJ, Plant GT (2001): Long‐term remyelination after optic neuritis: A 2‐year visual evoked potential and psychophysical serial study. Brain 124: 468–479. [DOI] [PubMed] [Google Scholar]
- Burgel U, Schormann T, Schleicher A, Zilles K (1999): Mapping of histologically identified long fiber tracts in human cerebral hemispheres to the MRI volume of a reference brain: position and spatial variability of the optic radiation. Neuroimage 10: 489–499. [DOI] [PubMed] [Google Scholar]
- Ciccarelli O, Parker GJ, Toosy AT, Wheeler‐Kingshott CA, Barker GJ, Boulby PA, Miller DH, Thompson AJ (2003a): From diffusion tractography to quantitative white matter tract measures: a reproducibility study. Neuroimage 18: 348–359. [DOI] [PubMed] [Google Scholar]
- Ciccarelli O, Toosy AT, Parker GJ, Wheeler‐Kingshott CA, Barker GJ, Miller DH, Thompson AJ (2003b): Diffusion tractography based group mapping of major white‐matter pathways in the human brain. Neuroimage 19: 1545–1555. [DOI] [PubMed] [Google Scholar]
- Compston DA, Batchelor JR, Earl CJ, McDonald WI (1978): Factors influencing the risk of multiple sclerosis developing in patients with optic neuritis. Brain 101: 495–511. [DOI] [PubMed] [Google Scholar]
- Conturo TE, Lori NF, Cull TS, Akbudak E, Snyder AZ, Shimony JS, McKinstry RC, Burton H, Raichle ME (1999): Tracking neuronal fiber pathways in the living human brain. Proc Natl Acad Sci USA 96: 10422–10427. [DOI] [PMC free article] [PubMed] [Google Scholar]
- Crosby EC, Humphrey T, Lauer EW (1962): Correlative anatomy of the nervous system. New York: Macmillian Co. [Google Scholar]
- de Preux J, Mair WG (1974): Ultrastructure of the optic nerve in Schilder's disease, Devic's disease and disseminated sclerosis. Acta Neuropathol (Berl) 30: 225–242. [DOI] [PubMed] [Google Scholar]
- Evangelou N, Konz D, Esiri MM, Smith S, Palace J, Matthews PM (2001): Size‐selective neuronal changes in the anterior optic pathways suggest a differential susceptibility to injury in multiple sclerosis. Brain 124: 1813–1820. [DOI] [PubMed] [Google Scholar]
- Ferguson B, Matyszak MK, Esiri MM, Perry VH (1997): Axonal damage in acute multiple sclerosis lesions. Brain 120: 393–399. [DOI] [PubMed] [Google Scholar]
- Ferris FL 3rd, Kassoff A, Bresnick GH, Bailey I (1982): New visual acuity charts for clinical research. Am J Ophthalmol 94: 91–96. [PubMed] [Google Scholar]
- Gossl C, Fahrmeir L, Putz B, Auer LM, Auer DP (2002): Fiber tracking from DTI using linear state space models: detectability of the pyramidal tract. Neuroimage 16: 378–388. [DOI] [PubMed] [Google Scholar]
- Guye M, Parker GJ, Symms M, Boulby P, Wheeler‐Kingshott CA, Salek‐Haddadi A, Barker GJ, Duncan JS (2003): Combined functional MRI and tractography to demonstrate the connectivity of the human primary motor cortex in vivo. Neuroimage 19: 1349–1360. [DOI] [PubMed] [Google Scholar]
- Hickman SJ, Brex PA, Brierley CM, Silver NC, Barker GJ, Scolding NJ, Compston DA, Moseley IF, Plant GT, Miller DH (2001): Detection of optic nerve atrophy following a single episode of unilateral optic neuritis by MRI using a fat‐saturated short‐echo fast FLAIR sequence. Neuroradiology 43: 123–128. [DOI] [PubMed] [Google Scholar]
- Hornabrook RS, Miller DH, Newton MR, MacManus DG, du Boulay GH, Halliday AM, McDonald WI (1992): Frequent involvement of the optic radiation in patients with acute isolated optic neuritis. Neurology 42: 77–79. [DOI] [PubMed] [Google Scholar]
- Jones DK, Griffin LD, Alexander DC, Catani M, Horsfield MA, Howard R, Williams SC (2002): Spatial normalization and averaging of diffusion tensor MRI data sets. Neuroimage 17: 592–617. [PubMed] [Google Scholar]
- Jones DK, Horsfield MA, Simmons A (1999a): Optimal strategies for measuring diffusion in anisotropic systems by magnetic resonance imaging. Magn Reson Med 42: 515–525. [PubMed] [Google Scholar]
- Jones DK, Simmons A, Williams SC, Horsfield MA (1999b): Non‐invasive assessment of axonal fiber connectivity in the human brain via diffusion tensor MRI. Magn Reson Med 42: 37–41. [DOI] [PubMed] [Google Scholar]
- Lenglet C, Deriche R, Faugeras O (2004): Anatomical connectivity mapping inferred from DTI‐based white matter geometry. Proceedings of the 10th Annual Meeting of the Organization of Human Brain Mapping. June 13–17, 2004, Budapest, Hungary.
- Madigan MC, Rao NS, Tenhula WN, Sadun AA (1996): Preliminary morphometric study of tumor necrosis factor‐alpha (TNF alpha)‐induced rabbit optic neuropathy. Neurol Res 18: 233–236. [DOI] [PubMed] [Google Scholar]
- Mori S, Crain BJ, Chacko VP, van Zijl PC (1999): Three‐dimensional tracking of axonal projections in the brain by magnetic resonance imaging. Ann Neurol 45: 265–269. [DOI] [PubMed] [Google Scholar]
- Mori S, Frederiksen K, van Zijl PC, Stieltjes B, Kraut MA, Solaiyappan M, Pomper MG (2002): Brain white matter anatomy of tumor patients evaluated with diffusion tensor imaging. Ann Neurol 51: 377–380. [DOI] [PubMed] [Google Scholar]
- Mori S, Kaufmann WE, Pearlson GD, Crain BJ, Stieltjes B, Solaiyappan M, van Zijl PC (2000): In vivo visualization of human neural pathways by magnetic resonance imaging. Ann Neurol 47: 412–414. [PubMed] [Google Scholar]
- O'Donnell L, Haker S, Westin CF (2002): New approaches to estimation of white matter connectivity in diffusion tensor MRI: elliptic PDEs and Geodesics in a tensor‐warped space. 5th International Conference on Medical Image Computing and Computer‐Assisted Intervention (MICCAI). LNCS 2488: 459–466. [Google Scholar]
- Park HJ, Kubicki M, Shenton ME, Guimond A, McCarley RW, Maier SE, Kikinis R, Jolesz FA, Westin CF (2003): Spatial normalization of diffusion tensor MRI using multiple channels. Neuroimage 20: 1995–2009. [DOI] [PMC free article] [PubMed] [Google Scholar]
- Parker GJ, Stephan KE, Barker GJ, Rowe JB, MacManus DG, Wheeler‐Kingshott CA, Ciccarelli O, Passingham RE, Spinks RL, Lemon RN, Turner R (2002): Initial demonstration of in vivo tracing of axonal projections in the macaque brain and comparison with the human brain using diffusion tensor imaging and fast marching tractography. Neuroimage 15: 797–809. [DOI] [PubMed] [Google Scholar]
- Parker GJ, Wheeler‐Kingshott CA, Barker GJ ( 2002b): Estimating distributed anatomical connectivity using fast marching methods and diffusion tensor imaging. IEEE Trans Med Imaging 21: 505–512. [DOI] [PubMed] [Google Scholar]
- Pierpaoli C, Barnett A, Pajevic S, Chen R, Penix LR, Virta A, Basser P (2001): Water diffusion changes in Wallerian degeneration and their dependence on white matter architecture. Neuroimage 13: 1174–1185. [DOI] [PubMed] [Google Scholar]
- Pierpaoli C, Basser PJ (1996): Toward a quantitative assessment of diffusion anisotropy. Magn Reson Med 36: 893–906. [DOI] [PubMed] [Google Scholar]
- Poupon C, Clark CA, Frouin V, Regis J, Bloch I, Le Bihan D, Manging J (2000): Regularization of diffusion‐based direction maps for the tracking of brain white matter fascicles. Neuroimage 12: 184–195. [DOI] [PubMed] [Google Scholar]
- Rademacher J, Burgel U, Geyer S, et al (2001): Variability and asymmetry in the human precentral motor system. A cytoarchitectonic and myeloarchitectonic brain mapping study. Brain 124: 2232–2258. [DOI] [PubMed] [Google Scholar]
- Rorden C, Brett M (2000): Stereotaxic display of brain lesions. Behav Neurol 12: 191–200. [DOI] [PubMed] [Google Scholar]
- Stieltjes B, Kaufmann WE, van Zijl PC, Fredericksen K, Pearlson GD, Solaiyappan M, Mori S (2001): Diffusion tensor imaging and axonal tracking in the human brainstem. Neuroimage 14: 723–735. [DOI] [PubMed] [Google Scholar]
- Symms MR, Barker GJ, Franconi F, Clark CA (1997): Correction of eddy‐current distortions in diffusion‐weighted echo‐planar images with a two‐dimensional registration technique. Proc Int Soc Magn Reson Med Abstr 1723.
- Talairach J, Tournoux P (1988): Co‐Planar Stereotactic Atlas of the Human Brain. Stuttgart, Germany: Thieme. [Google Scholar]
- Toosy AT, Werring DJ, Bullmore ET, Plant GT, Barker GJ, Miller DH, Thompson AJ (2002): Functional magnetic resonance imaging of the cortical response to photic stimulation in humans following optic neuritis recovery. Neurosci Lett 330: 255–259. [DOI] [PubMed] [Google Scholar]
- Trapp BD, Peterson J, Ransohoff RM, Rudick R, Mork S, Bo L (1998): Axonal transection in the lesions of multiple sclerosis. N Engl J Med 338: 278–285. [DOI] [PubMed] [Google Scholar]
- Werring DJ, Bullmore ET, Toosy AT, Miller DH, Barker GJ, MacManus DG, Brammer MJ, Giampietro VP, Brusa A, Brex PA, Moseley IF, Plant GT, McDonald WI, Thompson AJ (2000): Recovery from optic neuritis is associated with a change in the distribution of cerebral response to visual stimulation: a functional magnetic resonance imaging study. J Neurol Neurosurg Psychiatry 68: 441–449. [DOI] [PMC free article] [PubMed] [Google Scholar]
- Xu D, Mori S, Solaiyappan M, van Zijl PC, Davatzikos C (2002): A framework for callosal fiber distribution analysis. Neuroimage 17: 1131–1143. [DOI] [PubMed] [Google Scholar]
- Xue R, van Zijl PC, Crain BJ, Solaiyappan M, Mori S (1999): In vivo three‐dimensional reconstruction of rat brain axonal projections by diffusion tensor imaging. Magn Reson Med 42: 1123–1127. [DOI] [PubMed] [Google Scholar]