

Abstract
We used functional magnetic resonance imaging (fMRI) to investigate within‐subject reproducibility of activation in higher level, category‐specific visual areas to validate the functional localization approach widely used for these areas. The brain areas investigated included the extrastriate body area (EBA), which responds selectively to human bodies, the fusiform face area (FFA) and the occipital face area (OFA), which respond selectively to faces, and the parahippocampal place area (PPA), which responds selectively to places and scenes. All six subjects showed significant bilateral activation in the four areas. Reproducibility was very high for all areas, both within a scanning session and between scanning sessions separated by 3 weeks. Within sessions, the mean distance between peak voxels of the same area localized by using different functional runs was 1.5 mm. The mean distance between peak voxels of areas localized in different sessions was 2.9 mm. Functional reproducibility, as expressed by the stability of T‐values across sessions, was high for both within‐session and between‐session comparisons. We conclude that within subjects, high‐level category‐specific visual areas can be localized robustly across scanning sessions. Hum Brain Mapp, 2005. © 2005 Wiley‐Liss, Inc.
Keywords: visual stimuli, functional localization, reproducibility, fMRI, category‐specific
INTRODUCTION
Functional magnetic resonance imaging (fMRI) research on visual perception has revealed several distinct bilateral occipitotemporal brain areas that respond selectively to certain categories of visual stimuli. These include the extrastriate body area (EBA), which responds selectively to human bodies and body parts [Downing et al., 2001a], the fusiform face area (FFA) and the occipital face area (OFA), which respond selectively to faces [Halgren et al., 1999; Kanwisher et al., 1997; Puce et al., 1996], and the parahippocampal place area (PPA), which responds selectively to places and scenes [Epstein and Kanwisher, 1998].
The discovery of these category‐selective visual areas has initiated further research into their response properties [e.g., Chan et al., 2004; Chao et al., 1999; Epstein et al., 2003; Kanwisher et al., 1999; Tong et al., 2000], their role in cognitive functions like working memory [Druzgal and D'Esposito, 2003] and imagery [Ishai et al., 2002; O'Craven and Kanwisher, 2000], and factors that may modulate their activity, such as attention [Avidan et al., 2003; O'Craven et al., 1999; Wojciulik et al., 1998] and familiarity [Epstein et al., 1999; Rossion et al., 2003]. These areas have also proven useful for testing cognitive models of visual attention [Downing et al., 2001b; de Fockert et al., 2001; O'Craven et al., 1999; Yantis and Serences, 2003].
However, category‐specific responses in a region do not necessarily indicate a special role for that region in object recognition. According to one account of ventral stream organization, these selective “peaks” simply form one part of a large distributed network and do not contribute more or less than other regions to object recognition [Haxby et al., 2001; but see Spiridon and Kanwisher, 2002]. Recently, however, it has been shown that activity in the FFA correlates with successful detection and identification of faces, but not with other stimulus categories [Grill‐Spector et al., 2004]. This correlation was not observed in other ventral visual areas, even those (such as the PPA) where the response to faces is consistently low and could in principle provide information relevant to face processing. Although this debate remains to be conclusively resolved, there is thus at least some evidence that category‐selective peaks have a privileged role in vision.
A widely used strategy for studying the properties of category‐specific visual areas, or the influence of cognitive factors on these areas, is to functionally define the region of interest (ROI) for each subject with a localization experiment (e.g., by contrasting faces with other objects to define the FFA). Within these ROIs, effects of subsequent experimental manipulations can then be measured. The localizer measurement and the experimental manipulation of interest are usually carried out in separate runs of the same fMRI session. In some cases it would be advantageous to carry out the localizer in a different scanning session, for three reasons: (1) more time is left for the experiment of interest, allowing the inclusion of more conditions or increased power; (2) when testing the same group of subjects on multiple experiments involving the same ROIs, localization can be carried out only once for each subject; and (3) localizing across sessions makes it possible to test the response in newly localized areas to experimental conditions of previously acquired data.
The functional localization approach relies on the assumption that the location and selectivity of the ROIs are reliable across runs, either within or between scanning sessions. Stable measurement of ROIs is critical to maximize statistical power and validity in an ROI experiment. Moreover, as some of the category‐specific areas mentioned above are situated in very crowded neural “neighborhoods” (e.g., the EBA partially overlaps middle temporal area (MT) and the dorsolateral focus of LOC [Downing et al., 2001a; Malach et al., 1995]), a reliable estimate of the location of ROIs is crucial for the interpretation of experimental results. The aim of the present study was thus to establish an estimate of the within‐subject reliability of category‐specific visual areas, within and between scanning sessions.
Previous work investigating within‐subject reproducibility of fMRI activation has focused on activation in primary visual cortex [Miki et al., 2000, 2001a, b; Rombouts et al., 1998], motor cortex [Ramsey et al., 1996; Tegeler et al., 1999; Yetkin et al., 1996], somatosensory cortex [Yetkin et al., 1996], and medial temporal lobe [Machielsen et al., 2000]. These studies assessed the reproducibility of all activation produced by some stimulus or task, rather than the reliability of specific, focal a priori ROIs. The measure of reproducibility used in these previous studies tested the amount of spatial overlap of activation across different data sets. Because we were interested in the reliability of the location and selectivity of category‐specific ROIs, we calculated the following measures of reproducibility: (1) the distance between peak voxels; and (2) the reproducibility of statistical values within the ROI.
SUBJECTS AND METHODS
Participants
Six healthy volunteers (five male; age range, 21–33 years) with normal or corrected‐to‐normal vision participated in the experiment. All subjects gave informed consent, and experimental procedures were approved by the ethical board of the School of Psychology at the University of Wales, Bangor and the North‐West Wales Health Trust.
Experimental Paradigm
Subjects were scanned on two occasions (Session A and B) separated by 21–23 days (median, 21 days). The stimulation protocol was identical in the two sessions. No technical or software updates were carried out between the two scanning sessions. Each session consisted of four runs. Each run consisted of 21 15‐s blocks. Of these 21 blocks, five were fixation‐only baseline conditions, occurring on block 1, 6, 11, 16, and 21. During the other 16 blocks, subjects were presented with pictures of faces, bodies, tools, or scenes. Forty full‐color exemplars of each category were tested (see Fig. 1 for examples). These were divided into two sets of 20 stimuli, which were presented during Runs 1 and 2 and Runs 3 and 4, respectively. The order of blocks was symmetrically counterbalanced within each run. Two versions of the block order were adopted. The first half and second half of one version were swapped to create the second version. The block order of the first run matched the block order of the third run, and the same was true for the second and fourth runs. In the picture blocks, each stimulus was presented for 300 ms, with an ISI of 450 ms. Stimuli were back‐projected on the center of a screen, which was viewed by the subjects through an angled mirror positioned on top of the head coil. Subjects had to press a button whenever a stimulus appeared twice in immediate succession (a “one back” task), which happened twice per block.
Figure 1.
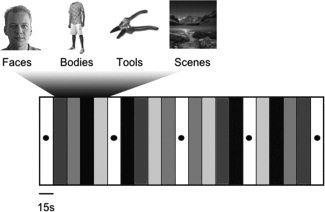
Example stimuli and overview of the design.
Functional Imaging and Analysis
Brain imaging was carried out on a Philips Gyroscan Intera 1.5‐T scanner equipped with a SENSE head coil [Pruessmann et al., 1999]. An echo‐planar imaging (EPI) sequence was used to image functional activation. Within subjects, the same scanning protocol was used in both sessions. Thirty oblique slices were collected per image covering the whole brain. Scanning parameters were: repetition time/echo time (TR/TE) = 3,000/50 ms; flip angle (FA) = 90 degrees; slice thickness = 4 or 5 mm (no gap); acquisition matrix = 64 × 64; and in‐plane resolution = 4 × 4 mm. For anatomic localization, a structural scan was made for each subject using a T1‐weighted sequence. Scanning parameters were: TR/TE = 11.5/2.95 ms; FA = 8 degrees; coronal slice thickness = 1.3 mm, no gap; acquisition matrix = 256 × 256; and in‐plane resolution = 1 × 1 mm.
Preprocessing and statistical analysis of fMRI data were carried out using BrainVoyager v4.9 (Brain Innovation, Maastricht, The Netherlands). The first three volumes of each run were discarded to avoid differences in T1 saturation. The first volume of each functional run was aligned to the first volume of the first functional run (intrasession alignment). Functional data were motion corrected, low‐frequency drifts were removed with a temporal high‐pass filter (0.006 Hz), and the data were spatially smoothed with a Gaussian kernel (6 mm full‐width half‐maximum [FWHM]). Functional data were then manually coregistered with the individual 3‐D anatomic scans. The 3‐D scans were transformed into Talairach space [Talairach and Tournoux, 1988], and the parameters for this transformation were subsequently applied to the coregistered functional data. Voxel time courses were resampled to a resolution of 3 × 3 × 3 mm using trilinear interpolation. Note that spatial normalization is unlikely to affect within‐subject reliability [Swallow et al., 2003].
To generate predictors for the multiple‐regression analyses, the event time series were convolved with a delayed γ function (δ = 2.5 s; τ = 1.25 s) to model the hemodynamic response [Boynton et al., 1996]. Voxel time series were z‐normalized for each run, and additional predictors accounting for baseline differences between runs were included in the design matrix.
ROIs (EBA, FFA, OFA, and PPA) were defined for each subject by carrying out three multiple‐regression analyses. To localize the EBA, activation caused by images of bodies was contrasted with the average activation of the remaining three stimulus categories. Similarly, faces were contrasted with the other categories to localize the FFA and OFA, and scenes were contrasted with the other categories to localize the PPA. For each contrast, we located the most significantly activated voxel near previously described locations of the ROIs (EBA, posterior end of the inferior temporal sulcus [Downing et al., 2001a]; FFA, mid‐fusiform gyrus [Kanwisher et al., 1997]; OFA, inferior occipital sulcus [Puce et al., 1996]; PPA, parahippocampal gyrus [Epstein and Kanwisher, 1998]). ROIs were defined as the set of contiguous voxels that were significantly (P < 0.0001, uncorrected for multiple comparisons) activated within 8 mm in the anterior/posterior, superior/inferior, and medial/lateral direction of the most significantly activated voxel. We limited the number of included voxels instead of including all contiguous voxels that are activated at a certain threshold because the group of contiguous voxels that are activated by a contrast can be very large and extend up to the primary visual cortex in the case of scenes (due to the larger image size of scenes compared to the other categories). Additionally, for the contrast involving faces, the FFA and OFA often merge together, only being separated at a certain threshold that differs for each subject and for the two hemispheres within a subject. To avoid setting different thresholds for each subject and ROI, we therefore selected only the group of significantly active voxels that were close to the peak voxel, ensuring that only the most selective voxels were included.
Reproducibility Measures
We assessed both within‐session and between‐session reproducibility of the activation in the EBA, FFA, OFA, and PPA. For between‐session reproducibility, we compared the activation in Session A with that in Session B. To create a comparable within‐session comparison, we combined Runs 1 and 3 of Session A with Runs 2 and 4 of Session B. This dataset will be referred to as Session AB. Similarly, we combined Runs 2 and 4 of Session A with Runs 1 and 3 of Session B. This dataset will be referred to as Session BA. Within‐session reproducibility was assessed by comparing Session AB with BA. In this way, both between‐ and within‐session comparisons had an equal amount of runs, identical stimuli, and the same stimulus orders on both sides of the comparison.
Distance Between Peak Voxels
The first measure of reproducibility concerned the spatial reliability of the ROIs. We calculated the linear distance between the most significantly activated voxels in the different sessions, for each ROI and hemisphere separately. For the between‐session comparison, we thus calculated the distance between peak voxels in Sessions A and B. Similarly, for the within‐session comparison we calculated the distance between peak voxels in Session AB and BA. A Session × ROI × Hemisphere repeated‐measures analysis of variance (ANOVA) was carried out to test differences in linear distance.
Functional Reproducibility
For each session (i.e., A, B, AB, and BA), we defined the category‐specific ROIs and T‐values of the ensemble response of the voxels in these ROIs. T‐values were based on the same statistical contrasts used to define the ROIs. To assess functional reproducibility, we compared the T‐values of different runs in the following way. First, the T‐value of the ROIs was computed for the runs that were also used for defining these ROIs (e.g., the T‐value was computed for the data from Session A based on the ROI defined by Session A). T‐values were then computed for the remaining session (e.g., the T‐value of Session B in the ROI defined by Session A). The comparison of the T‐values of ROIs that were defined in the same runs with the T‐values of ROIs that were defined in different runs gives an indication of the functional reproducibility of the ROIs. If category‐selective activations are highly stable, we expect similar T‐values in both cases. We compared Sessions A and B (between‐session comparison) and Sessions AB and BA (within‐session comparison). Sign tests were carried out to test differences in reproducibility between ROIs.
RESULTS
Category‐Specific Activation
Figure 2 shows the category‐specific activations in a representative subject for the four different sessions (A, B, AB, and BA). As can be seen, bodies (top panel), faces (middle panel), and scenes (bottom panel) selectively activated the hypothesized regions (EBA, FFA, OFA, and PPA). On visual inspection, the activations seemed to be very similar across sessions. All areas could be localized bilaterally in all sessions for all six subjects. Mean Talairach coordinates (averaged across sessions and subjects) for the regions were: EBA (left: −43, −72, −2; right: 46, −70, −1); FFA (left: −38, −46, −16; right: 41, −47, −17); OFA (left: −36, −73, −17; right: 37, −74, −17); and PPA (left: −23, −44, −9; right: 27, −40, −7).
Figure 2.
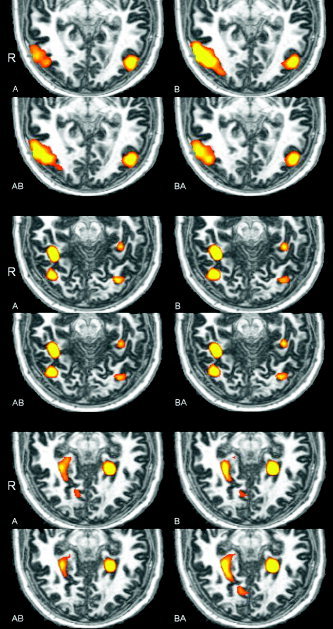
Transverse slices showing category‐specific activity for bodies (top panel; z = −4, T > 6), faces (middle panel; z = −18, T > 6), and scenes (bottom panel; z = −8, T > 12) in the four sessions. The left side of the image corresponds to the right side of the brain.
Mean T‐Values
Figure 3 gives the T‐values (averaged across subjects) of the four ROIs for each session and hemisphere. The highest T‐values were observed in the PPA and high but somewhat lower T‐values in the EBA, FFA, and OFA.
Figure 3.
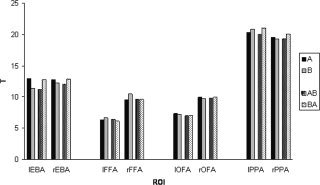
Mean T‐values (averaged across subjects) for each ROI in the four sessions. T‐values were computed by using the same contrasts as those used for defining the ROIs (e.g., bodies vs. other categories for the EBA).
The mean T‐values (averaged across ROIs) of Sessions A (T = 12.3) and B (T = 12.2), and Sessions AB (T = 11.9) and BA (T = 12.4) were comparable. Within subjects, the absolute difference of T‐values between Sessions A and B was larger than was the absolute difference between Sessions AB and BA (2.1 vs. 1.5, respectively). Within subjects, T‐values thus differed more between sessions than within sessions, but not in a systematic direction (that is, for some subjects TA > TB whereas for others, TB > TA).
Distance Between Peak Voxels
Figure 4 shows the distances between peak voxels for each session (within or between), ROI, and hemisphere. A 2 × 4 × 2 repeated‐measures ANOVA (session × ROI × hemisphere) on the distance between peak voxels revealed only a significant effect of session (F 1,5 = 12.5; P < 0.05). There was a larger distance between scanning sessions (mean = 2.9 mm; standard error [SE] = 0.40) than there was within scanning sessions (mean = 1.5 mm; SE = 0.34). This effect did not depend on the ROI or hemisphere, or the interaction between ROI and hemisphere. That is, there were no significant interactions between session and ROI (P = 0.18), between session and hemisphere (P = 0.77), or between session and ROI × hemisphere (P = 0.36).
Figure 4.
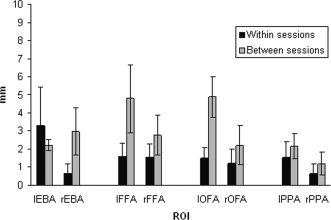
Linear distance between peak voxels for each ROI, for within‐ and between‐session comparisons. Error bars indicate standard errors of the mean.
Functional Reproducibility
Figure 5 shows the T‐values of the ROIs as a function of the runs in which the ROIs were defined (same or different) for both within‐ and between‐session comparisons. Within sessions, the average T‐value when the ROIs were defined in the same runs was 12.2, compared to 12.0 when the ROIs were defined across runs (a reduction of 1.6%). Between sessions, the average T‐value when the ROIs were defined in the same runs was 12.3, compared to 11.6 when the ROIs were defined across runs separated by three weeks (a reduction of 5.7%). A sign test comparing the reduction in T between sessions with that within sessions was significant (P < 0.05), indicating higher reproducibility within sessions.
Figure 5.
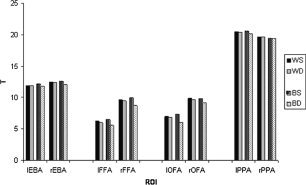
Mean T‐values (averaged across subjects) for each ROI as a function of whether the ROI was defined in the same or different runs, for within‐ and between‐session comparisons. WS, within‐session, same runs; WD, within‐session, different runs; BS, between‐session, same runs; BD, between‐session, different runs.
The four ROIs (averaged across hemispheres) did not differ in reproducibility (as expressed by the reduction in T‐value) for the within‐session comparisons (all P > 0.10). Between sessions, we found higher reproducibility for the PPA than for the FFA and OFA (both P < 0.05).
DISCUSSION
The present study investigated the within‐subject reproducibility of category‐specific ROIs in ventral occipitotemporal cortex. As expected, pictures of bodies selectively activated the EBA [Downing et al., 2001a], faces activated the FFA and OFA [Halgren et al., 1999; Kanwisher et al., 1997; Puce et al., 1996], and scenes activated the PPA [Epstein and Kanwisher, 1998]. All six subjects showed significant bilateral activation in all ROIs.
To test a key assumption of the functional localization method, that the location and selectivity of ROIs are stable, we assessed the reliability of ROI definition by looking at the consistency of activation across runs. Within a scanning session, ROIs could be localized very consistently, with the mean distance between peak voxels in separate data sets being only 1.5 mm, accompanied by an average reduction in T‐value of 1.6%. Between scanning sessions, distances between peak voxels were slightly higher (2.9 mm), and the reduction in T‐value was greater (5.7%). Even across scanning sessions, the mean distance between peaks is less than is the linear distance between adjacent voxels under typical scanning protocols. From these results, we conclude that category‐specific ROIs can be localized very consistently across runs and across sessions separated by weeks, thus providing a validation of the functional localization approach for higher order visual areas.
Why is between‐session reproducibility worse than within‐session reproducibility? This could be due to coregistration errors, attention and arousal differences, or priming effects.
The coregistration of functional to structural data is a likely contributor to the reduction in reproducibility between scanning sessions, as errors in coregistration will only affect between‐session comparisons. Automatic coregistration algorithms are now becoming available, and these may reduce the differences between within‐ and between‐session reproducibility.
Another reason for lower reproducibility between sessions compared to that within sessions could be a greater variability in attention and arousal across the two scanning sessions, resulting in greater variability of selectivity between sessions. Indeed, we found a greater absolute difference in T‐values between sessions compared to that within sessions.
Finally, it is possible that object‐selective areas of the brain change over time, for example by forming sparser representations of stimuli after repetition [e.g., van Turennout et al., 2000]. Repetition of stimuli can thus result in a reduction of brain activity to these stimuli, a phenomenon known as priming [see Henson, 2003 for a review]. Although most studies reporting priming effects have used relatively short interstimulus intervals compared to that in the present study, it is possible that priming occurred even after 3 weeks. However, the finding that T‐values remained nearly constant between scanning sessions argues against priming as an explanation of the present results.
We found some evidence for differences in reproducibility between ROIs: between scanning sessions the PPA showed less reduction in T‐value than did the FFA and OFA. As the reliability of a finding is reflected in the statistical significance of this finding, we might expect higher T‐values in the PPA than in the FFA and OFA. Indeed, we found the highest T‐values in the PPA, and the lowest T‐values in the FFA and OFA. In the present study, high T‐values indicate a large difference in the response of a ROI to the preferred category compared to that to the control categories, or small within‐subject variance of this difference. It thus may be that perceptual or cognitive differences between the preferred category and the remaining categories were lowest in the FFA and OFA. A recent finding showing strong body selectivity in the fusiform gyrus close to the FFA, indicates that the representation of bodies and faces may partially overlap, suggesting that contrasts between faces and bodies may be less effective than contrasts between faces and other categories [Peelen and Downing, 2005]. More generally, choosing control categories that produce a low response in a ROI could enhance the within‐subject reproducibility of the ROI.
To conclude, we find that category‐specific visual areas can be localized very reliably within subjects, even across sessions separated by 3 weeks. This supports the validity of the functional localization approach for investigating these theoretically important regions of extrastriate visual cortex. Future studies could use the methods adopted here to investigate the reproducibility of other areas. In particular, it would be interesting to compare the reproducibility of higher cognitive areas (e.g., memory‐related areas in prefrontal cortex) with lower level areas. Activations in higher level areas may be relatively variable between subjects, but equally reproducible within subjects [Miller et al., 2002; Noll et al., 1997].
Acknowledgements
We thank A. Chan and C. Dodds for help with the scanning and production of the stimuli, T. Bedson for scanning assistance, and D. Linden for helpful comments on the article.
REFERENCES
- Avidan G, Levy I, Hendler T, Zohary E, Malach R (2003): Spatial vs. object specific attention in high‐order visual areas. Neuroimage 19: 308–318. [DOI] [PubMed] [Google Scholar]
- Boynton GM, Engel SA, Glover GH, Heeger DJ (1996): Linear systems analysis of functional magnetic resonance imaging in human V1. J Neurosci 16: 4207–4221. [DOI] [PMC free article] [PubMed] [Google Scholar]
- Chan AW‐Y, Peelen MV, Downing PE (2004): The effect of viewpoint on body representation in the extrastriate body area. Neuroreport 15: 2407–2410. [DOI] [PubMed] [Google Scholar]
- Chao LL, Haxby JV, Martin A (1999): Attribute‐based neural substrates in temporal cortex for perceiving and knowing about objects. Nat Neurosci 2: 913–919. [DOI] [PubMed] [Google Scholar]
- de Fockert JW, Rees G, Frith CD, Lavie N (2001): The role of working memory in visual selective attention. Science 291: 1803–1806. [DOI] [PubMed] [Google Scholar]
- Downing PE, Jiang Y, Shuman M, Kanwisher N (2001a): A cortical area selective for visual processing of the human body. Science 293: 2470–2473. [DOI] [PubMed] [Google Scholar]
- Downing P, Liu J, Kanwisher N (2001b): Testing cognitive models of visual attention with fMRI and MEG. Neuropsychologia 39: 1329–1342. [DOI] [PubMed] [Google Scholar]
- Druzgal TJ, D'Esposito M (2003): Dissecting contributions of prefrontal cortex and fusiform face area to face working memory. J Cogn Neurosci 15: 771–784. [DOI] [PubMed] [Google Scholar]
- Epstein R, Kanwisher N (1998): A cortical representation of the local visual environment. Nature 392: 598–601. [DOI] [PubMed] [Google Scholar]
- Epstein R, Harris A, Stanley D, Kanwisher N (1999): The parahippocampal place area: recognition, navigation, or encoding? Neuron 23: 115–125. [DOI] [PubMed] [Google Scholar]
- Epstein R, Graham KS, Downing PE (2003): Viewpoint‐specific scene representations in human parahippocampal cortex. Neuron 37: 865–876. [DOI] [PubMed] [Google Scholar]
- Grill‐Spector K, Knouf N, Kanwisher N (2004): The fusiform face area subserves face perception, not generic within‐category identification. Nat Neurosci 7: 555–562. [DOI] [PubMed] [Google Scholar]
- Halgren E, Dale AM, Sereno MI, Tootell RB, Marinkovic K, Rosen BR (1999): Location of human face‐selective cortex with respect to retinotopic areas. Hum Brain Mapp 7: 29–37. [DOI] [PMC free article] [PubMed] [Google Scholar]
- Haxby JV, Gobbini MI, Furey ML, Ishai A, Schouten JL, Pietrini P (2001): Distributed and overlapping representations of faces and objects in ventral temporal cortex. Science 293: 2425–2430. [DOI] [PubMed] [Google Scholar]
- Henson R (2003): Neuroimaging studies of priming. Prog Neurobiol 70: 53–81. [DOI] [PubMed] [Google Scholar]
- Ishai A, Haxby JV, Ungerleider LG (2002): Visual imagery of famous faces: effects of memory and attention revealed by fMRI. Neuroimage 17: 1729–1741. [DOI] [PubMed] [Google Scholar]
- Kanwisher N, McDermott J, Chun MM (1997): The fusiform face area: a module in human extrastriate cortex specialized for face perception. J Neurosci 17: 4302–4311. [DOI] [PMC free article] [PubMed] [Google Scholar]
- Kanwisher N, Stanley D, Harris A (1999): The fusiform face area is selective for faces not animals. Neuroreport 10: 183–187. [DOI] [PubMed] [Google Scholar]
- Machielsen WC, Rombouts SA, Barkhof F, Scheltens P, Witter MP (2000): FMRI of visual encoding: reproducibility of activation. Hum Brain Mapp 9: 156–164. [DOI] [PMC free article] [PubMed] [Google Scholar]
- Malach R, Reppas JB, Benson RR, Kwong KK, Jiang H, Kennedy WA, Ledden PJ, Brady TJ, Rosen BR, Tootell RB (1995): Object‐related activity revealed by functional magnetic resonance imaging in human occipital cortex. Proc Natl Acad Sci USA 92: 8135–8139. [DOI] [PMC free article] [PubMed] [Google Scholar]
- Miki A, Liu GT, Englander SA, Raz J, van Erp TG, Modestino EJ, Liu CJ, Haselgrove JC (2001a): Reproducibility of visual activation during checkerboard stimulation in functional magnetic resonance imaging at 4 Tesla. Jpn J Ophthalmol 45: 151–155. [DOI] [PubMed] [Google Scholar]
- Miki A, Raz J, Englander SA, Butler NS, van Erp TG, Haselgrove JC, Liu GT (2001b): Reproducibility of visual activation in functional magnetic resonance imaging at very high field strength (4 Tesla). Jpn J Ophthalmol 45: 1–4. [DOI] [PubMed] [Google Scholar]
- Miki A, Raz J, van Erp TG, Liu CS, Haselgrove JC, Liu GT (2000): Reproducibility of visual activation in functional MR imaging and effects of postprocessing. AJNR Am J Neuroradiol 21: 910–915. [PMC free article] [PubMed] [Google Scholar]
- Miller MB, Van Horn JD, Wolford GL, Handy TC, Valsangkar‐Smyth M, Inati S, Grafton S, Gazzaniga MS (2002): Extensive individual differences in brain activations associated with episodic retrieval are reliable over time. J Cogn Neurosci 14: 1200–1214. [DOI] [PubMed] [Google Scholar]
- Noll DC, Genovese CR, Nystrom LE, Vazquez AL, Forman SD, Eddy WF, Cohen JD (1997): Estimating test‐retest reliability in functional MR imaging. II: Application to motor and cognitive activation studies. Magn Reson Med 38: 508–517. [DOI] [PubMed] [Google Scholar]
- O'Craven KM, Downing PE, Kanwisher N (1999): fMRI evidence for objects as the units of attentional selection. Nature 401: 584–587. [DOI] [PubMed] [Google Scholar]
- O'Craven KM, Kanwisher N (2000): Mental imagery of faces and places activates corresponding stimulus‐specific brain regions. J Cogn Neurosci 12: 1013–1023. [DOI] [PubMed] [Google Scholar]
- Peelen MV, Downing PE (2005): Selectivity for the human body in the fusiform gyrus. J Neurophysiol 93: 603–608. [DOI] [PubMed] [Google Scholar]
- Pruessmann KP, Weiger M, Scheidegger MB, Boesiger P (1999): SENSE: sensitivity encoding for fast MRI. Magn Reson Med 42: 952–962. [PubMed] [Google Scholar]
- Puce A, Allison T, Asgari M, Gore JC, McCarthy G (1996): Differential sensitivity of human visual cortex to faces, letterstrings, and textures: a functional magnetic resonance imaging study. J Neurosci 16: 5205–5215. [DOI] [PMC free article] [PubMed] [Google Scholar]
- Ramsey NF, Kirkby BS, Van Gelderen P, Berman KF, Duyn JH, Frank JA, Mattay VS, Van Horn JD, Esposito G, Moonen CT, Weinberger DR (1996): Functional mapping of human sensorimotor cortex with 3D BOLD fMRI correlates highly with H2(15)O PET rCBF. J Cereb Blood Flow Metab 16: 755–764. [DOI] [PubMed] [Google Scholar]
- Rombouts SA, Barkhof F, Hoogenraad FG, Sprenger M, Scheltens P (1998): Within‐subject reproducibility of visual activation patterns with functional magnetic resonance imaging using multislice echo planar imaging. Magn Reson Imaging 16: 105–113. [DOI] [PubMed] [Google Scholar]
- Rossion B, Schiltz C, Crommelinck M (2003): The functionally defined right occipital and fusiform “face areas” discriminate novel from visually familiar faces. Neuroimage 19: 877–883. [DOI] [PubMed] [Google Scholar]
- Spiridon M, Kanwisher N (2002): How distributed is visual category information in human occipito‐temporal cortex? An fMRI study. Neuron 35: 1157–1165. [DOI] [PubMed] [Google Scholar]
- Swallow KM, Braver TS, Snyder AZ, Speer NK, Zacks JM (2003): Reliability of functional localization using fMRI. Neuroimage 20: 1561–1577. [DOI] [PubMed] [Google Scholar]
- Talairach J, Tournoux P (1988): Co‐planar stereotaxic atlas of the human brain. New York: Thieme; 122 p. [Google Scholar]
- Tegeler C, Strother SC, Anderson JR, Kim SG (1999): Reproducibility of BOLD‐based functional MRI obtained at 4 T. Hum Brain Mapp 7: 267–283. [DOI] [PMC free article] [PubMed] [Google Scholar]
- Tong F, Nakayama K, Moscovitch M, Weinrib O, Kanwisher N (2000): Response properties of the human fusiform face area. Cogn Neuropsychol 17: 257–279. [DOI] [PubMed] [Google Scholar]
- van Turennout M, Ellmore T, Martin A (2000): Long‐lasting cortical plasticity in the object naming system. Nat Neurosci 3: 1329–1334. [DOI] [PubMed] [Google Scholar]
- Wojciulik E, Kanwisher N, Driver J (1998): Covert visual attention modulates face‐specific activity in the human fusiform gyrus: fMRI study. J Neurophysiol 79: 1574–1578. [DOI] [PubMed] [Google Scholar]
- Yantis S, Serences JT (2003): Cortical mechanisms of space‐based and object‐based attentional control. Curr Opin Neurobiol 13: 187–193. [DOI] [PubMed] [Google Scholar]
- Yetkin FZ, McAuliffe TL, Cox R, Haughton VM (1996): Test–retest precision of functional MR in sensory and motor task activation. AJNR Am J Neuroradiol 17: 95–98. [PMC free article] [PubMed] [Google Scholar]