

Abstract
Current analysis of diffusion tensor imaging (DTI) is based mostly on a region of interest (ROI) in an image dataset, which is specified by users. This method is not always reliable, however, because of the uncertainty of manual specification. We introduce an improved fiber‐based scheme rather than an ROI‐based analysis to study in DTI datasets of 31 normal subjects the asymmetry of the cingulum, which is one of the most prominent white matter fiber tracts of the limbic system. The present method can automatically extract the quantitative anisotropy properties along the cingulum bundles from tractography. Moreover, statistical analysis was carried out after anatomic correspondence specific to the cingulum across subjects was established, rather than the traditional whole‐brain registration. The main merit of our method compared to existing counterparts is that to find such anatomic correspondence in cingulum, a scale‐invariant parameterization method by arc‐angle was proposed. It can give a continuous and exact description on any segment of cingulum. More interestingly, a significant left‐greater‐than‐right asymmetry pattern was obtained in most segments of cingulum bundle (−50–25 degrees), except in the most posterior portion of cingulum (25–50 degrees). Hum Brain Mapp 24:92–98, 2005. © 2004 Wiley‐Liss, Inc.
Keywords: asymmetry, cingulum, DTI, fiber‐based analysis, diffusion anisotropy
INTRODUCTION
Brain asymmetry has been studied widely in terms of structure and function [Toga and Thompson, 2003]. Most studies focused on gray matter [Amunts et al., 1996; Kertesz et al., 1986; Steinmetz, 1996]. Recently, with the rapid development of diffusion tensor imaging (DTI), a new imaging technique providing some meaningful measure for white fiber tract organization, increasing attention has been focused on exploring asymmetry of white matter structure. Such asymmetry may be relevant to specific functions of the brain, which are lateralized in humans [Chi et al., 1977; Galaburda et al., 1978]. Some progresses have been made in this field. For instance, left–right asymmetry of diffusion anisotropy in white matter beneath the subinsular cortex has been found, which was considered as a possible reason for the asymmetry of auditory cortex and Wernicke's area [Cao et al., 2003].
It has been shown that cingulate cortex is involved in many higher‐level cognitive functions [Badgaiyan and Posner, 1998; Posner and Petersen, 1990]. Moreover, several studies demonstrated that abnormality in the cingulate region might be an important factor in the pathophysiology of schizophrenia [Carter et al., 2001; Kiehl et al., 2000]. Such studies also suggested that some function of the cingulate gyrus depends on connections with other parts of the neuronal network [Benes, 1993]. In addition, evidence has shown that some symptoms and cognitive dysfunction in schizophrenia may be explained partly by disconnections between cingulate cortex and other regions [Cohen et al., 1999]. It would therefore be significant to ascertain the characteristics of cingulum known as the main white fiber that connects cingulate cortex with other regions.
Although the cingulum bundle is the most prominent white matter fiber tract of the limbic system, few conventional magnetic resonance (MR) studies have focused on this structure because there is no clear boundary on conventional MR images between the cingulum bundle and its adjacent white matter. There have been a few works thus far in which cingulum was studied with DTI and a difference of cingulum anisotropy asymmetry was found between control subjects and schizophrenic patients [Kubicki et al., 2003; Wang et al., 2004]. Uncertainty might be increased, however, by manually specifying regions of interest (ROIs) for anterior and posterior parts of cingulum, respectively, in several slices [Wang et al., 2004]. Kubicki et al. [ 2003] took the cingulum as a whole. To our knowledge, there is no study on the asymmetry of different parts along the cingulum.
We improved the fiber‐based scheme to analyze the asymmetry of different parts along the cingulum in a group of 31 subjects. First, cingulum bundles were reconstructed by fiber‐tracking algorithm and then were parameterized with a scale‐invariant method. All bundles centered at a common origin, and anatomic correspondence in cingulum was established. Fiber‐based statistical analysis was then carried out.
SUBJECTS AND METHODS
Subjects
Of 37 healthy, right‐handed subjects enrolled, 31 subjects participated in the final analysis (20 men, 11 women; mean age, 25.6 ± 3.6 years; age range, 20–40 years). Informed consent was obtained after a complete description of the study.
MR Data Acquisition
All MR imaging was carried out on a 1.5‐Tesla MR scanner (GE Signa 1.5T Twinspeed) equipped with shielded magnetic field gradients of up to 40 mT/m. A standard head coil was used for radio frequency (RF) transmission and reception of the nuclear magnetic resonance (NMR) signal. Head motion was minimized with restraining foam pads offered by the manufacturer.
Diffusion‐weighted imaging was acquired with single‐shot echo planar imaging (EPI) sequence in alignment with anterior–posterior commissure plane (Fig. 1). The diffusion sensitizing gradients were applied along 25 non‐collinear directions with b value = 1,000 s/mm2, together with an acquisition without diffusion weighting (b = 0). In total, 12 slices were gathered with the most caudal slice passing through the genu of corpus callosum to cover as many cingulum bundles as possible. The acquisition parameters were as follows: TR = 4, 000 ms; TE = 80 ms; matrix = 128 × 128; field of view (FOV) = 24 × 24 cm; number of excitation (NEX) = 3; slice thickness = 3 mm without gap. Total scan time for the DTI sequence was 5 min 20 s. High‐resolution 3‐D T1‐weighted image (TR = 11.3 ms; TE = 4.2 ms; FOV = 24 × 24 mm; matrix = 128 × 128; slice thickness = 2.4 mm; NEX = 2) was also obtained.
Figure 1.
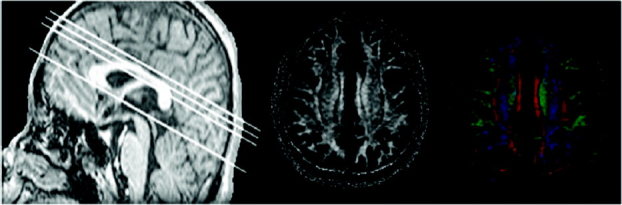
Left: Localizer image showing some parts of scan locations. Baseline denotes the AC–PC line, and the other three parallel lines are parts of scan location. FA map is the middle; at right is the corresponding color‐coded tensor image. All figures came from one subject.
DTI Data Calculation
Diffusion tensor matrix was calculated according to the Stejskal and Tanner equation [Stejskal and Tanner, 1965]. Three pairs of eigenvalues (λ1, λ2, and λ3) and eigenvectors were obtained by diagonalization of the tensor matrix. The principal direction at each point was given by the eigenvector that corresponds to the largest eigenvalue, and fractional anisotropy (FA) [Basser and Pierpaoli, 1996] was calculated according to the following formula:
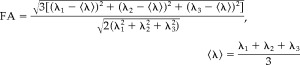 |
(1) |
Tractography
The fiber‐tracking algorithm used in our study is similar to the method proposed by Lazar et al. [ 2003]. Briefly, a 2‐D seed region including the fascicules of interest was first placed manually and seed points were defined in this region. The tracking algorithm then moved a fixed distance (in this case 0.3 mm) along the principal direction from each seed point. With diffusion tensor deflection, new diffusion orientation was estimated from the continuous tensor field at this new point, and the algorithm then moved the distance along the new direction. The forward movement continued until the FA was below some threshold (in this case 0.2). The other section of the tract passing through these seed points in the opposite direction was then reconstructed according to the same procedure. The algorithm parameters were as follows: deflection operator n = 2; α1 = 1, α2 = α3 = 0.5 (equation [3] of Lazar et al. 2003]); and f = 0.5, g = 0.5 (equation [4] of Lazar et al. [ 2003]). Color‐coded tensor image [Pajevic and Pierpaoli, 1999] could provide rough information to distinguish different white fibers, and for this reason it was used to specify the seed regions. Seed points were then defined on a regular grid in these regions. In fact, the traced fibers from tractography include some artifact pathways due to noise and partial volume effect. To address this problem, a multi‐ROI approach was introduced [Catani et al., 2002; Conturo et al., 1999]. In this study, those trajectories that had not passed through all these regions were removed.
Mapping of Fibers Onto a Standardized Coordinate Frame and Parameterization
For population analysis, a standardized coordinate frame is necessary for all tracked cingulum bundles to reduce anatomic variability across subjects. To this end, all cingulum bundles were analyzed in a common polar coordinate system. Specifically, the coronal slice passing the anterior commissure (AC) point and perpendicular to the anterior commissure–posterior commissure (PC) line was taken as the reference plane (i.e., S0 in Fig. 2). To identify the AC point, the 3‐D T1‐weighted image was registered to the corresponding DTI data of the same subject. We registered the 3‐D T1‐weighted image to the image without diffusion weighting (i.e., b = 0 image) by a rigid transformation manually in Analysis of Functional Neuroimages (AFNI) [Cox, 1996]. The AC point then was identified interactively by an expert in the transformed 3‐D T1‐weighted image. The position of seed regions would partly influence the tractography; therefore, such a position should be approximately uniform for all subjects. In this case, we chose the reference plane (i.e., S0 in Fig. 2) for placement of seed regions, which was relatively unchangeable for the population and located nearly across the middle of the cingulum.
Figure 2.
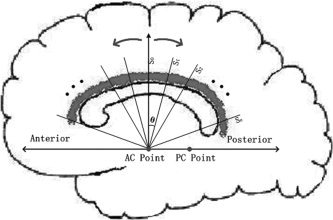
The sketch map for parameterized procedure: The left–right line passing the AC point was assigned as the axis of rotation; Seed plane (S0) denotes the reference plane; sampling plane is denoted by S0, S1, …, Sn. Cingulum, which was marked by gray, was parameterized by arc angle (θ) in the new polar coordinate system.
Besides the spatially common position of seed regions, correspondence of the other different parts of cingulum is also needed across subjects. The traced fibers by tractography with the common origin were parameterized by arc angle, rather than arc length [Fillard et al., 2003]. The whole process is shown in Figure 2. The left–right line passing the AC point was taken as the axis of rotation, seed plane (S0) denoted the reference plane, and S0, S1, …, Sn denoted the sampling plane. The cingulum, which was marked by gray, was then parameterized by arc angle (θ) in this polar coordinate system.
Statistical Analysis
For traced cingulum bundles, the FA value that each location point has can be used as its characteristics. FA values for unilateral cingulum bundles with the same arc angle were averaged to obtain a typical FA for that arc angle; thus, the typical FA distribution along the cingulum as a function of arc angle could be obtained for each subject. For each arc angle, repeated measures analysis of variance (ANOVA) with gender (males, females) as an inter‐subject factor and side (left, right) as an intra‐subject factor, was used to test for differences of FA values.
RESULTS
Cingulum bundles are dispersed widely in the most anterior and posterior portions, which prohibits reliable measurement of diffusion, and for this reason we concentrated our analysis on the part of the tract dorsal to corpus callosum. We chose a sampling interval (θ) = 1 degree, and the angle range of anterior and posterior was 50 degrees, respectively. The traced cingulum bundles in six subjects were not long enough to cover the arc angle range (−50 to 50 degrees); these six subjects were excluded from the final analysis.
Figure 3A illustrates the reconstruction of the left and right cingulum tracts in one subject. Red and white indicate anterior and posterior portion of cingulum bundles, respectively. The FA value distribution along bilateral cingulum bundles as a function of arc angle was plotted for this subject in Figure 3B.
Figure 3.

A: Reconstruction of the cingulum tracts for one subject is illustrated. Red and white denote anterior and posterior part of cingulum, respectively. B: FA values for left and right side are plotted corresponding to arc angle. For horizontal axis, left to right represent anterior to posterior.
Repeated measures ANOVA, with gender (males, females) as an inter‐subject factor and side (left, right) as an intra‐subject factor, was carried out using SPSS v.11.5 for each arc angle. Figure 4A and 4B illustrate the mean and standard deviation (SD) of FA distribution for males and females in both sides, respectively. The P‐value distribution corresponding to side effect was plotted in Figure 4C. There were no contiguous significant differences by gender effect or gender‐by‐side interaction; thus, the corresponding P‐value distribution was not plotted; however, the side difference was significant (F[1, 29] > 4.18, P < 0.05) in most segments of cingulum bundles (−50 to 25 degrees), except in the most posterior portion of cingulum (25–50 degrees) (Fig. 4C). Figure 4A and 4B also demonstrated such a left‐greater‐than‐right asymmetry pattern in both males and females. Although the mean of FA values shows some difference between males and females in some posterior parts of left cingulum and anterior parts of right cingulum, statistical analysis revealed no significant difference. In addition, Figure 4A and 4B also show a decrease of FA value from the middle to the anterior and the posterior cingulum.
Figure 4.
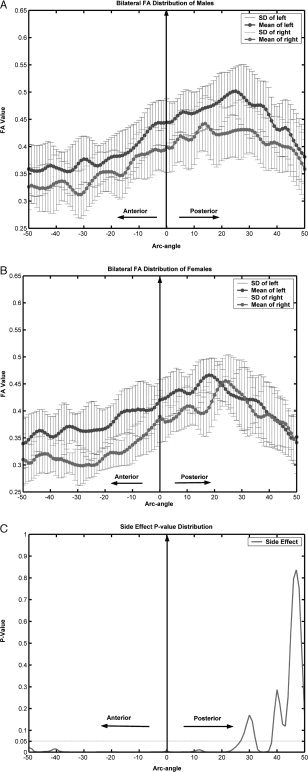
Statistical analysis using repeated measures ANOVA. A: Averaged FA and SD distribution in males; black denotes left and gray denotes right. B: Averaged FA and SD distribution in females; black denoted left and gray denoted right. C: Significance of repeated measures ANOVA by side effect. For horizontal axis, left to right represent anterior to posterior.
DISCUSSION
Diffusion anisotropy was investigated to ascertain asymmetry of cingulum. A marked left‐greater‐than‐right asymmetry pattern was observed in the most segments of cingulum bundles, except in the most posterior segment. No significant differences between males and females were found. These results were obtained by FA value comparison along the cingulum. We used anatomic alignment with a scale‐invariant parameterization to establish correspondence in cingulum across subjects. To test for differences of FA values along the cingulum, we used repeated measures ANOVA with gender (males and females) as an inter‐subject factor and side (left and right) as an intra‐subject factor. Our results were obtained without correction for multiple comparisons. With strict correction, such an asymmetry pattern would not be evident in the vicinity of 41 degrees anteriorly and 12 degrees posteriorly (Fig. 4C).
Diffusion tensor imaging, as a relatively new MRI technique, provides information about the random displacement of water molecules in the brain tissue [Basser et al., 1996]. Using this information, investigation of the white matter characteristics and anatomic connections between different regions could be carried out noninvasively [Catani et al., 2003; Peled et al., 1998]. Using DTI, much progress has been made in the studies of brain development, normal aging, brain asymmetry, brain function connectivity, and neurologic and psychiatric diseases [Filippi et al., 2001; Kubicki et al., 2002a, b]. Most results with DTI were found either by comparison of some indexes in ROIs or voxel‐based analysis of registered image datasets [Lim et al., 1999]. However, ROI‐based methods are not always reliable because of the uncertainty of ROI specification. DTI image registration across individuals is very complicated and continues to be developed.
With the development of tracking algorithms, MR index quantification based on tractography was introduced alternatively [Mori et al., 2002; Stieltjes et al., 2001; Xue et al., 1999]. Jones et al. [ 2003a, b] applied a fiber‐based method to the study of schizophrenia, and Fillard et al. [ 2003] recently proposed a similar scheme to study white matter structure. This method could automatically analyze diffusion properties along the fiber or geodesic path extracted from tractography. In addition, statistical analysis can be carried out along the tracts if anatomic alignment were established. In Fillard et al. [ 2003], traced bundles with the common anatomic origin were parameterized intuitively by arc length. The bundles were expressed by a point set, which was sampled by fixed geodesic path interval from a seed point, and then statistical analysis was used directly. Such parameterization, however, can only establish anatomic correspondence among subjects when the size of cingulum is equivalent. Because the sampling interval is just the fixed movement step mentioned in tractography and the fixed movement step in all subjects remains the same, such parameterization could lead to mismatch of the cingulum when the size of cingulum is variable.
To overcome this problem, a scale‐invariant parameterization method was proposed in this study. Considering the C‐shape of cingulum, we reparameterized the cingulum bundles with the common anatomic origin by arc angle. The AC point was considered as the center of the cingulum arc (i.e., the reference point during parameterization), which was inspired by the regional subdivision model for corpus callosum [Gabrielli et al., 1993]. Such parameterization can eliminate, at least partly, the effect of size variance from subject to subject; thus, cingulum correspondence across subjects could be established. Such an approach can only work for tracts that are approximately circular, such as the cingulum. Indeed, this approach also required manual drawing for the seed regions on 2D slice. To test the reproducibility, two raters, who are blind to the data, placed the seed regions for subjects independently, and then computer implemented the rest procedure with fixed parameters. Six subjects were selected randomly from the group, and the raters drew seed regions for each subject twice independently. For all arc angles, the inter‐rater and intra‐rater reliability ranged from 0.95–0.99.
Anisotropic water diffusion in white matter fibers initially has been explained mainly by the myelin sheath restricting water diffusion across axonal fiber tracks; however, the microscopic pictures that cause the anisotropic water diffusion remains unclear. Factors, which could affect the diffusion tensor, might include the density of white matter fibers, the average fiber diameter, and the directional similarity of the fibers [Westin et al., 1999]. Diffusion tensor is thus a meaningful measure of fiber tract organization [Beaulieu, 2002; Pierpaoli et al., 1996]. Such measurement could therefore be used, at least partly, to ascertain the asymmetry of white matter in the microstructural organization [Peled et al., 1998]. The greater anisotropy found in the left cingulum may reflect a higher density or directional similarity of fibers in the left cingulum. Such asymmetry may be derived from structural and functional differences between the two hemispheres during brain development. More investigation is needed to study the asymmetry related to development, gender, handedness, and age.
White matter fiber tracts are the basis of communications between brain regions. Consequently, studies of white matter fiber tracts may reveal some direct evidence on functional connectivity. Anterior cingulum is related mainly to the anterior cingulate cortex, which is associated with neural implementation of attentional control and other functions [Barch et al., 2000; Smith and Jonides, 1999; Van Veen et al., 2001], and morphologic asymmetry related to gender has been found also in anterior cingulate cortex [Yucel et al., 2001]. Moreover, the anterior cingulate cortex has been studied widely by psychiatrists, and much evidence has shown an asymmetry disturbance in anterior cingulate cortex in schizophrenia [Benes, 1993, 2000; Le Provost et al., 2003]. As mentioned previously, an asymmetry difference in cingulum between normal and schizophrenic patients bilaterally has been reported by ROI‐based method [Kubicki et al., 2003; Wang et al., 2004]. Kubicki et al. [ 2003] measured FA in the portion of the tract dorsal to the body of the corpus callosum as a whole. The FA of this region in normal subjects showed a left‐greater‐than‐right asymmetry pattern, which was consistent with our finding. The posterior cingulum, however, did not show such a pattern in the study by Wang et al. [ 2004]. The asymmetry of cingulum observed in our study may contribute to some functional difference between bilateral anterior cingulate cortices and posterior cingulate cortices, and thus could lead to a better understanding of the brain functional connectivity.
Although a left‐greater‐than‐right asymmetry pattern was observed in most parts of cingulum in our study, the interpretation of these results requires some caution. For example, the validation of tractography remains a common problem in DTI. One interesting issue is the interaction between the fractional anisotropy and the thickness of the bilateral cingulum bundles that might be naturally variable. For tractography, change of FA‐threshold can affect the thickness and the length of cingulum, but it does not affect the radius of cingulum. In our method, the change of the cingulum length does not affect the FA measurement, although the thickness may have an impact on the FA measurement. The interaction between FA‐threshold for tractography and the FA measurement can therefore be viewed as the interaction between the cingulum thickness and the FA measurement. We have not studied such an interaction in the present research because measurement of cingulum thickness is beyond the scope of this research; however, we would like to study this issue in the future.
In summary, the asymmetry of cingulum bundles was analyzed systematically based on a new scale‐invariant parameterization, and a left‐greater‐than‐right asymmetry pattern along the cingulum was observed in this study.
Acknowledgements
We thank the anonymous referees for their significant and constructive comments and suggestions, which greatly improved the article. We thank Prof. J. Zhang at University of Kentucky for checking the use of English language, as well as Y. He, Y. Lu, J. Wang, and F. Qian for their comments and support for this work.
REFERENCES
- Amunts K, Schlaug G, Schleicher A, Steinmetz H, Dabringhaus A, Roland PE, Zilles K ( 1996): Asymmetry in the human motor cortex and handedness. Neuroimage 4: 216–222. [DOI] [PubMed] [Google Scholar]
- Badgaiyan RD, Posner MI ( 1998): Mapping the cingulate cortex in response selection and monitoring. Neuroimage 7: 255–260. [DOI] [PubMed] [Google Scholar]
- Barch DM, Braver TS, Sabb FW, Noll DC ( 2000): Anterior cingulate and the monitoring of response conflict: evidence from an fMRI study of overt word generation. J Cogn Neurosci 12: 298–309. [DOI] [PubMed] [Google Scholar]
- Basser P, Pierpaoli C ( 1996): Microstructural and physiological features of tissues elucidated by quantitative‐diffusion‐tensor MRI. J Magn Reson B 111: 209–219. [DOI] [PubMed] [Google Scholar]
- Beaulieu C ( 2002): The basis of anisotropic water diffusion in the nervous system—a technical review. NMR Biomed 15: 435–455. [DOI] [PubMed] [Google Scholar]
- Benes FM ( 1993): Neurobiological investigations in cingulate cortex of schizophrenic brain. Schizophr Bull 19: 537–549. [DOI] [PubMed] [Google Scholar]
- Benes FM ( 2000): Emerging principles of altered neural circuitry in schizophrenia. Brain Res Brain Res Rev 31: 251–269. [DOI] [PubMed] [Google Scholar]
- Cao Y, Whalen S, Huang J, Berger KL, DeLano MC ( 2003): Asymmetry of subinsular anisotropy by in vivo diffusion tensor imaging. Hum Brain Mapp 20: 82–90. [DOI] [PMC free article] [PubMed] [Google Scholar]
- Carter CS, MacDonald AW, Ross LL, Stenger VA ( 2001): Anterior cingulate cortex activity and impaired self‐monitoring of performance in patients with schizophrenia: an event‐related fMRI study. Am J Psychiatry 158: 1423–1428. [DOI] [PubMed] [Google Scholar]
- Catani M, Howard RJ, Pajevic S, Jones DK ( 2002): Virtual in vivo interactive dissection of white matter fasciculi in the human brain. Neuroimage 17: 77–94. [DOI] [PubMed] [Google Scholar]
- Catani M, Jones DK, Donato R, ffytche DH ( 2003): Occipito‐temporal connections in the human brain. Brain 126: 2093–2107. [DOI] [PubMed] [Google Scholar]
- Chi JG, Dooling EC, Gilles FH ( 1977): Left–right asymmetries of the temporal speech areas of the human fetus. Arch Neurol 34: 346–348. [DOI] [PubMed] [Google Scholar]
- Cohen RA, Kaplan RF, Moser DJ, Jenkins MA, Wilkinson H ( 1999): Impairments of attention after cingulotomy. Neurology 53: 819–824. [DOI] [PubMed] [Google Scholar]
- Conturo TE, Lori NF, Cull TS, Akbudak E, Snyder AZ, Shimony JS, Mckinstry RC, Burton H, Raichle ME ( 1999): Tracking neuronal fiber pathways in the living human brain. Proc Natl Acad Sci USA 96: 10422–10427. [DOI] [PMC free article] [PubMed] [Google Scholar]
- Cox RW ( 1996): AFNI software for analysis and visualization of functional magnetic resonance neuroimages. Comput Biomed Res 29: 162–173. [DOI] [PubMed] [Google Scholar]
- Filippi M, Cercignani M, Inglese M, Horsfield MA, Comi G ( 2001): Diffusion tensor magnetic resonance imaging in multiple sclerosis. Neurology 56: 304–311. [DOI] [PubMed] [Google Scholar]
- Fillard P, Gilmore J, Piven J, Lin WL, Gerig G ( 2003): Quantitative analysis of white matter fiber properties along geodesic paths In: Ellis RE, Peters TM, editors. Medical Image Computing and Computer‐Assisted Intervention (MICCAI 03) Lecture Notes in Computer Science, Vol 2879 Heidelberg: Springer‐Verlag; p 16–23. [Google Scholar]
- Gabrielli O, Salvolini U, Bonifazi V, Ciferri L, Lanza R, Rossi R, Coppa GV, Giorgi PL ( 1993): Morphological studies of the corpus callosum by MRI in children with malformative syndromes. Neuroradiology 35: 109–112. [DOI] [PubMed] [Google Scholar]
- Galaburda AM, Sanides F, Geschwind N ( 1978): Human brain: cytoarchitectonic left–right asymmetries in the temporal speech region. Arch Neurol 35: 812–817. [DOI] [PubMed] [Google Scholar]
- Jones DK, Catani M, Reeves SJ, Shergill SS, McGuire P, Horsfield MA, Simmons A, Williams SC, Howard RJ ( 2003a): A tractography approach to studying fronto‐temporal fasciculi in schizophrenia and late onset schizophrenia‐like psychosis In: Proc ISMRM 11th Scientific Meeting. Toronto: ISMRM; p 244. [Google Scholar]
- Jones DK, Catani M, Reeves SJC, Shergill SS, O'Sullivan M, McGuire P, Horsfield MA, Simmons A, Williams S ( 2003b): White matter fasciculi in schizophrenia studied by diffusion tensor MR tractography. Neuroimage 19( Suppl): 748. [Google Scholar]
- Kertesz A, Black SE, Polk M, Howell J ( 1986): Cerebral asymmetries on magnetic resonance imaging. Cortex 22: 117–127. [DOI] [PubMed] [Google Scholar]
- Kiehl KA, Smith AM, Hare RD, Liddle PF ( 2000): An event‐related potential investigation of response inhibition in schizophrenia and psychopathy. Biol Psychiatry 48: 210–221. [DOI] [PubMed] [Google Scholar]
- Kubicki M, Westin CF, Maier SE, Mamata H, Frumin M, Ersner‐Hershfield H, Kikinis R, Jolesz FA, McCarley R, Shenton ME ( 2002a): Diffusion tensor imaging and its application to neuropsychiatric disorders. Harv Rev Psychiatry 10: 324–336. [DOI] [PMC free article] [PubMed] [Google Scholar]
- Kubicki M, Westin CF, Nestor PG, Wible CG, Frumin M, Maier SE, Kikinis R, Jolesz FA, McCarley RW, Shenton ME ( 2003): Cingulate fasciculus integrity disruption in schizophrenia: a magnetic resonance diffusion tensor imaging study. Biol Psychiatry 54: 1171–1180. [DOI] [PMC free article] [PubMed] [Google Scholar]
- Kubicki M, Westin CF, Maier SE, Frumin M, Nestor PG, Salisbury DF, Kikinis R, Jolesz FA, McCarley RW, Shenton ME ( 2002b): Uncinate fasciculus findings in schizophrenia: a magnetic resonance diffusion tensor imaging study. Am J Psychiatry 159: 813–820. [DOI] [PMC free article] [PubMed] [Google Scholar]
- Lazar M, Weinstein DM, Tsuruda JS, Hasan KM, Arfanakis K, Meyerand ME, Badie B, Rowley HA, Haughton V, Field A, Alexander AL ( 2003): White matter tractography using diffusion tensor deflection. Hum Brain Mapp 18: 306–321. [DOI] [PMC free article] [PubMed] [Google Scholar]
- Le Provost JB, Bartrees‐Faz D, Paillere‐Martinot ML, Artiges E, Pappata S, Recasens C, Perez‐Gomez M, Bernardo M, Baeza I, Bayle F, Martinot JL ( 2003): Paracingulate sulcus morphology in men with early‐onset schizophrenia. Brit J Psychiatry 182: 228–232. [DOI] [PubMed] [Google Scholar]
- Lim KO, Hedehus M, Moseley M, de Crespigny A, Sullivan EV, Pfefferbaum A ( 1999): Compromised white matter tract integrity in schizophrenia inferred from diffusion tensor imaging. Arch Gen Psychiatry 56: 367–374. [DOI] [PubMed] [Google Scholar]
- Mori S, Kaufmann WE, Davatzikos C, Stieltjes B, Amodei L, Fredericksen K, Pearlson GD, Melhem ER, Solaiyappan M, Raymond GV, Moser HW, van Zijl PCM ( 2002): Imaging cortical association tracts in the human brain using diffusion‐tensor‐based axonal tracking. Magn Reson Med 47: 215–223. [DOI] [PubMed] [Google Scholar]
- Pajevic S, Pierpaoli C ( 1999): Color schemes to represent the orientation of anisotropic tissues from diffusion tensor data: application to white matter. Magn Reson Med 42: 526–540. [PubMed] [Google Scholar]
- Peled S, Gudbjartsson H, Westin CF, Kikinis R, Jolesz FA ( 1998): Magnetic resonance imaging shows orientation and asymmetry of white matter fiber tracts. Brain Res 780: 27–33. [DOI] [PubMed] [Google Scholar]
- Pierpaoli C, Jezzard P, Basser PJ, Barnett AS, Di Chiro G ( 1996): Diffusion tensor MR imaging of the human brain. Radiology 201: 637–648. [DOI] [PubMed] [Google Scholar]
- Posner MI, Petersen SE ( 1990): The attention system of the human brain. Annu Rev Neurosci 13: 25–42. [DOI] [PubMed] [Google Scholar]
- Smith EE, Jonides J ( 1999): Storage and executive processes in the frontal lobes. Science 283: 1657–1661. [DOI] [PubMed] [Google Scholar]
- Steinmetz H ( 1996): Structure, functional and cerebral asymmetry: in vivo morphometry of the planum temporale. Neurosci Biobehav Rev 20: 587–591. [DOI] [PubMed] [Google Scholar]
- Stejskal EO, Tanner JE ( 1965): Spin diffusion measurements: spin echoes in the presence of a time‐dependent field gradient. J Chem Phys 42: 288–292. [Google Scholar]
- Stieltjes B, Kaufmann WE, van Zijl PCM, Fredericksen K, Pearlson GD, Solaiyappan M, Mori S ( 2001): Diffusion tensor imaging and axonal tracking in the human brainstem. Neuroimage 14: 723–735. [DOI] [PubMed] [Google Scholar]
- Toga AW, Thompson PM ( 2003): Mapping brain asymmetry. Nat Neurosci 4: 37–48. [DOI] [PubMed] [Google Scholar]
- Van Veen V, Cohen JD, Botvinick MM, Stenger VA, Carter CS ( 2001): Anterior cingulate cortex, conflict monitoring, and levels of processing. Neuroimage 14: 1302–1308. [DOI] [PubMed] [Google Scholar]
- Wang F, Sun ZG, Cui LW, Du XK, Hong N, Zhang D ( 2004): Anterior cingulum abnormalities in male schizophrenia with diffusion tensor imaging. Am J Psychiatry 161: 573–575. [DOI] [PubMed] [Google Scholar]
- Westin CF, Maier S, Khidhir B, Everett P, Jolesz F, Kikinis R ( 1999): Image processing for diffusion tensor magnetic resonance imaging In: Ellis RE, Peters TM, editors. Medical image computing and computer‐assisted intervention (MICCAI 03) Lecture notes in computer science. Vol. 2879 Heidelberg: Springer‐Verlag; p 441–452. [Google Scholar]
- Xue R, van Zijl PCM, Crain BJ, Solaiyappan M, Mori S ( 1999): In vivo three‐dimensional reconstruction of rat brain axonal projections by diffusion tensor imaging. Magn Reson Med 42: 1123–1127. [DOI] [PubMed] [Google Scholar]
- Yucel M, Stuart GW, Maruff P, Velakoulis D, Crowe SF, Savage G, Pantelis C ( 2001): Hemispheric and gender‐related differences in the gross morphology of the anterior cingulate/paracingulate cortex in normal volunteers: an MRI morphometric study. Cereb Cortex 11: 17–25. [DOI] [PubMed] [Google Scholar]