

Abstract
Although there is considerable evidence that patients with schizophrenia fail to activate the dorsolateral prefrontal cortex (DLPFC) to the degree seen in normal comparison subjects when performing working memory or executive tasks, hypofrontality may be coupled with relatively increased activity in other brain regions. However, most imaging studies of working memory in schizophrenia have focused on DLPFC activity. The goal of this work is to review functional neuroimaging studies that contrasted patients with schizophrenia and healthy comparison subjects during a prototypical working memory task, the n‐back paradigm, to highlight areas of hyper‐ and hypoactivation in schizophrenia. We utilize a quantitative meta‐analysis method to review 12 imaging studies where patients with schizophrenia were contrasted with healthy comparison subjects while performing the n‐back paradigm. Although we find clear support for hypofrontality, we also document consistently increased activation in anterior cingulate and left frontal pole regions in patients with schizophrenia compared to that in controls. These data suggest that whereas reduced DLPFC activation is reported consistently in patients with schizophrenia relative to healthy subjects, abnormal activation patterns are not restricted to this region, raising questions as to whether the pathophysiological dysfunction in schizophrenia is specific to the DLPFC and about the relationship between impaired performance and aberrant activation patterns. The complex pattern of hyper‐ and hypoactivation consistently found across studies implies that rather than focusing on DLPFC dysregulation, researchers should consider the entire network of regions involved in a given task when making inferences about the biological mechanisms of schizophrenia. Hum Brain Mapp 25:60–69, 2005. © 2005 Wiley‐Liss, Inc.
Keywords: schizophrenia, hypofrontality, working memory, n‐back, executive functioning, dorsolateral prefrontal cortex, DLPFC
INTRODUCTION
Dysregulation of dorsolateral prefrontal cortex (DLPFC) is thought to be central to the neurophysiology of schizophrenia [Goldman‐Rakic,1994; Weinberger and Berman,1996]. Although initial reports of reduced resting prefrontal metabolism in schizophrenia [Ingvar and Franzén,1974] were not reproduced consistently [Gur and Gur,1995], experiments that include executive or working memory challenges typically demonstrate reduced DLPFC activation in patients, relative to matched comparison subjects [Spitzer,1993]. The link between DLPFC dysfunction and disrupted working memory is a prominent feature of leading cognitive neuroscience models of schizophrenia, which propose that working memory disturbances disrupt guidance of ongoing behavior and lead to the cognitive fractionation and psychiatric symptoms characteristic of schizophrenia [Cohen and Servan‐Schreiber,1993; Goldman‐Rakic,1996]. The notion of a functional DLPFC “lesion” in schizophrenia is consistent with cytoarchitectural findings of reduced dendritic arborization without evidence of a reduction in the total number of prefrontal neurons [Selemon et al.,1995]. This pattern of results suggests a reduction in interneuronal neuropil that is thought to be associated with hypoactive dopaminergic modulation of pyramidal cell activity, especially within the frontal lobes [Glantz and Lewis,1997; Goldman‐Rakic and Selemon,1997]. Selemon and Goldman‐Rakic [1999] proposed that reduced neuropil reflects a form of impoverished neuronal connectivity that “appears to be a sufficient substrate for cognitive dysfunction” and schizophrenic symptomatology (p. 17).
Although there is considerable evidence that patients with schizophrenia fail to activate DLPFC to the degree seen in normal comparison subjects (termed hypofrontality) on a host of working memory or executive tasks including the Wisconsin Card‐Sorting Task [Weinberger et al.,1986], the Tower of London [Andreasen et al.,1992], the n‐back task [Carter et al.,1998], and verbal fluency [Yurgelun‐Todd et al.,1996], more recent studies have stressed that DLPFC activation in patients is linked to performance deficits, with good performance associated with relatively greater DLPFC activity and marked behavioral deficits linked to relatively reduced DLPFC signal [Callicott et al.,2000; Perlstein et al.,2001; Ragland et al.,1998; Ramsey et al.,2002]. Manoach [2003] recently argued that task‐related hypofrontality may be secondary to methodological issues or to between‐group performance or motivational differences, and suggests that until the exact role of the prefrontal cortex in executive and working memory tasks is delineated, interpretation of reduced DLPFC activity in patients with schizophrenia is confounded.
Working memory tasks, like most complex behaviors, activate a spatially distributed large‐scale network of cortical and subcortical brain regions [Mesulam,1998; Smith and Jonides,1998]. Each of these regions is thought to enjoy a relative functional specialization [Chafee and Goldman‐Rakic,2000; Goldman‐Rakic,1996; Quintana and Fuster,1999], that can be best considered in terms of a continuum, where several regions may be responsible, to varying degrees, for similar types of processing [O'Reilly et al.,1999]. For example, Chafee and Goldman‐Rakic [2000] simultaneously recorded activity from prefrontal and posterior parietal neurons of nonhuman primates performing a working memory task. They report almost identical firing patterns in these regions, suggesting that prefrontal and parietal neurons achieve matched activation during working memory performance through a symmetrical exchange of neuronal signals. Indeed, the functional relevance of a specific brain region may depend upon the patterns of interactions between that region and other areas within large‐scale network that, in aggregate, subserve working memory [McIntosh,2000]. An implication of this network architecture is that aberrant DLPFC activation in patients with schizophrenia during the performance of working memory or executive tasks may reflect failures in any other brain region within the network, or poor integration of regions within the network. Indeed, reduced DLPFC activity in schizophrenia may be coupled with a relative increase in activity in other brain regions [Callicott et al.,2000]. Changes in the relative level of activation within brain regions of the working memory network have been reported in better‐ and worse‐performing healthy subjects [Callicott et al.,1999; Jansma et al.,2001; Ragland et al.,1997] and across genders [Gur et al.,1995,2000]. In patients with schizophrenia, shifts in the relative amount of activation within specific brain regions comprising the working memory network could be related to altered performance levels [Manoach,2003] or be secondary to reductions in interregional connectivity that disrupt normal activation levels throughout the network [Selemon and Goldman‐Rakic,1999]. Although the network approach to interpreting functional neuroimaging data has gained prevalence in the field as a whole, most imaging studies of working memory in schizophrenia have focused primarily on DLPFC activity. Consideration of the working memory network as a whole may substantially aid the development of better cognitive neuroscience models of schizophrenia and improve the utility of these models for informing basic and clinical research. The primary goal of the present study is to review functional neuroimaging studies that contrasted patients with schizophrenia and healthy comparison subjects during a prototypical and well‐validated working memory task, the n‐back paradigm, to highlight areas of hyper‐ and hypoactivation in schizophrenia associated with task performance.
As part of this special issue on quantitative meta‐analysis for functional neuroimaging experiments, the current review utilizes voxel‐based methods to consolidate imaging studies reported in Talairach coordinates to provide insights into the consistency of activation foci across experiments [Laird et al.,2005a]. Although prefrontal dysregulation in patients with schizophrenia was observed initially with the Wisconsin Card‐Sorting Task [Weinberger et al.,1986], we restrict our review to experiments employing the n‐back paradigm as it has been administered in a standard way across studies and results tend to be reported in a more contemporary framework (e.g., Talairach coordinates). Furthermore, as part of this special issue, Owen et al. [2005] present a normative review of n‐back experiments that was used to aid interpretation of potential differences between patients with schizophrenia and healthy comparison subjects. We hypothesize that, in addition to finding evidence of reduced DLPFC activation in patients with schizophrenia, we will also find areas of hyperactivity consistently reported across articles.
MATERIALS AND METHODS
The N‐Back Paradigm
In the n‐back paradigm, subjects are required to monitor a series of quickly changing stimuli, responding whenever a stimulus is presented that is the same as the one presented n trials previously, where memory demand (or n) is usually 1, 2, or 3 [Gevins and Cutillo,1993]. Many functional imaging studies also include a 0‐back condition, where subjects respond to a prespecified stimulus (analogous to an X‐version of the continuous performance test [Nuechterlein et al.,1983]), as a sensorimotor and attentional control. Typically, imaging experiments contrast signal associated with various memory demands (e.g., 2 vs. 0 or 3 vs. 1), although some investigators contrast memory performance with rest. The n‐back paradigm is thought to evoke a number of working memory processes, including maintenance, monitoring, updating, and manipulation of remembered information [Cohen et al.,1997].
Literature Search
Multiple Medline literature searches were conducted to find all functional magnetic resonance imaging (fMRI) and positron emission topography (PET) studies applying a variant of the n‐back working memory paradigm in patients with schizophrenia and matched comparison subjects. The reference lists of these articles were reviewed for relevant studies not identified by the initial database search. This combined approach identified 21 potential articles. As primary source data must be reported in standard stereotactic coordinates (either Talairach or MNI space) to be used in voxel‐level quantitative meta‐analyses [Laird et al.,2005a; Turkeltaub et al.,2002], only 17 articles could be included in the review. Of these articles, only those that reported coordinates from patients with schizophrenia alone (n = 7) or coordinates from patient–control contrasts were included (n = 6; total n = 12; see Table I).
Table I.
Articles included in meta‐analysis
| Manuscript | Stimuli | Load | Subjects (healthy/patients) | Healthy alone | Patients alone | Healthy > patients | Patients > healthy |
|---|---|---|---|---|---|---|---|
| Callicott et al.,2000 | Numbers, location | 0,1,2 | 18/13 | ✓ | ✓ | ||
| Callicott et al.,2003 | Numbers, location | 0,2 | 14/14 | ✓ | ✓ | ||
| Honey et al.,2003 | Letters | 0,2 | 27/30 | ✓ | ✓ | ✓ | ✓ |
| Honey et al.,1999 | Letters | 0,2 | 10/20 | ✓ | ✓ | ||
| Honey et al.,2002 | Letters | 0,2 | 20/20 | ✓ | ✓ | ||
| Jacobsen et al.,2004 | Auditory nonwords | 1,2 | 13/13 | ✓ | |||
| Kim et al.,2003 | Object | 0,2 | 12/12 | ✓ | ✓ | ||
| Kindermann et al.,2004 | Location | 2,3,4 | 12/10 | ✓ | ✓ | ||
| Perlstein et al.,2003 | Letters | 0,1,2 | 15/16 | ✓ | ✓ | ||
| Sabri et al.,2003 | Numbers | 0,2 | 10/11 | ✓ | |||
| Walter et al.,2003 | Letters, Location | 0,2 | 15/15 | ✓ | ✓ | ||
| Wykes et al.,2002 | Letters | 0,2 | 6/12 | ✓ | ✓ |
As can be seen in Table I, the experiments included in this meta‐analysis examined behavior while subjects processed verbal (numbers/letters; n = 11), spatial (location; n = 4) and object (n = 1) information. Although Jacobsen et al. [2004] presented subjects with auditory stimuli, all other experiments presented visual stimuli. Differences in information modality and stimulus presentation methods between studies could increase experiment‐specific variance. Given that the cognitive requirements of the n‐back paradigm are identical in each experiment, we anticipate that brain regions associated with these common processes (e.g., DLPFC, posterior parietal, and anterior cingulate) will be consistent across studies [Nystrom et al.,2000]. This assumption is justified given the results of Owen et al. [2005], whose meta‐analysis showed that common brain systems were activated during n‐back paradigms regardless of information modality in healthy subjects.
Quantitative Meta‐Analysis Procedures
Several studies reported coordinates of activation defined by contrasting multiple working memory demands (levels of the n‐back) versus resting or active control conditions. In these cases, each set of coordinates was considered individually for inclusion in the quantitative meta‐analysis. Because the Talairach system is defined such that left is negative, x‐coordinates based on the radiological convention were reversed. Finally, the spatial normalization template was determined for each article and all foci reported in Montreal Neurological Institute (MNI) space were converted to Talairach space.
Four separate meta‐analyses were conducted with coordinates from: (1) healthy comparison subjects alone; (2) patients with schizophrenia alone; (3) healthy subjects greater than patients; and (4) patients greater than controls. The meta‐analysis comprised all coordinates of n‐back task related activation reported in the general population as described by Owen et al. [2005] to help guide interpretation.
Activation likelihood estimation (ALE) is a relatively new method of quantitative meta‐analysis of functional neuroimaging data developed by Turkeltaub et al. [2002] and significantly expanded by Laird et al. [2005a]. ALE is a voxel‐based method for finding concordance within a neuroimaging literature that does not rely upon author‐assigned anatomical labels [Laird et al.,2005b]. Rather, the ALE method requires only that activation foci be reported in standard stereotactic space. During an ALE analysis, each activation focus from each article is modeled as the center of a Gaussian probability distribution. These 3D Gaussian distributions are subsequently summed to create a statistical map that estimates the likelihood of activation for each voxel as determined by the entire set of studies. This map is then thresholded using standard imaging methodologies (e.g., random Gaussian field theory and permutation tests).
In the current study, equally weighted coordinates were used to form estimates of the activation likelihood for each brain voxel. To allow for error in spatial localization related to intersubject variation in functional anatomy and interstudy differences in data smoothing and registration, the reported loci of maximal activation were modeled as the peaks of 3D Gaussian probability density functions with full‐width half‐maximum (FWHM) of 10 mm. The probabilities of each voxel in standard space representing each primary locus of activation were combined to form a map of the ALE score at each voxel. Statistical significance was determined using a permutation test of randomly generated foci. No assumptions were made concerning the distribution or spatial separation of these random foci; however, clusters of activity were required to exceed 200 mm3 in volume. Five thousand permutations were computed using the same FWHM value and the same number of foci used in computing the ALE values. The test was corrected for multiple comparisons using the false discovery rate (FDR) method [Genovese et al.,2002; Laird et al.,2005a]. All data processing was carried out using an in‐house Java version of ALE developed at the Research Imaging Center.
RESULTS
Healthy Comparison Subjects Alone
Seven of the articles reported activation for matched comparison subjects alone, resulting in 60 total foci. Healthy individuals consistently activated six distinct brain regions (see Fig. 1). These regions included bilateral premotor cortex (Brodmann area [BA] 6); right rostral prefrontal cortex (BA10); left ventrolateral/insular cortex (BA45, 13); dorsal cingulate/medial premotor cortex, including supplementary motor area (SMA; BA32, 6); bilateral occipital regions (BA19); and left posterior parietal cortex, predominantly inferior parietal lobule (BA40). With the exception of the occipital regions, this network is a subset of those regions found in the larger meta‐analysis of all healthy subjects performing the n‐back paradigm (listed as functional atlas in Fig. 1) (Table 2) [Owen et al.,2005].
Figure 1.
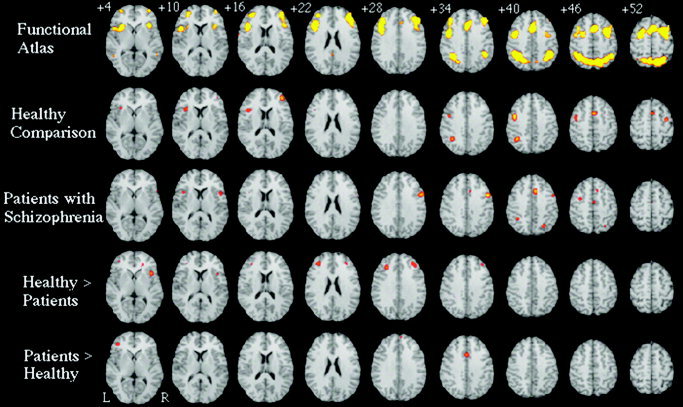
Meta‐analytic activation maps, based on: all primary normative studies of the n‐back working memory paradigm (Functional Atlas; as reported in Owen et al. [2005]), activation foci reported for healthy subjects recruited as controls in psychiatric neuroimaging studies (Healthy Comparison), activation foci for patients with schizophrenia alone (Patients with Schizophrenia), activation foci for contrasts of healthy comparison subjects greater than patients (Healthy > Patients), and for regions where patients with schizophrenia activate more than comparison subjects (Patients > Healthy). Slices are spaced 6 mm apart, begin 4 mm above the anterior commissure–posterior commissure line and are presented according to neurological convention (right = right).
Table II.
Healthy comparison subjects alone
| Hemisphere | Lobe | Gyrus | BA | Volume (mm3) | Center | ||
|---|---|---|---|---|---|---|---|
| Left | Frontal | Middle frontal | 6 | 1968 | −43 | 0 | 40 |
| Right | Frontal | Middle frontal | 6 | 584 | 32 | −6 | 53 |
| Right | Frontal | Middle frontal | 10 | 1136 | 37 | 43 | 16 |
| Left | Frontal | Inferior frontal and insula | 45,13 | 1240 | −38 | 17 | 12 |
| Midline | Frontal | Superior frontal and cingulate | 6,32 | 984 | 0 | 8 | 48 |
| Left | Occipital | Fusiform | 19 | 1792 | −36 | −68 | −14 |
| Right | Occipital | Fusiform | 19 | 800 | 29 | −66 | −16 |
| Left | Parietal | Inferior parietal lobule | 40 | 1376 | −37 | −52 | 38 |
| Left | Subcortical | Insula | 13 | 1240 | −38 | 17 | 12 |
BA, Brodmann area; center, center of mass in Talairach coordinates.
Patients With Schizophrenia Alone
Seven articles reported activation for patients with schizophrenia alone, resulting in 62 total foci (see Fig. 1). Patients with schizophrenia consistently activated a network of six regions, including right dorsolateral prefrontal cortex (BA9); left premotor cortex (BA6); bilateral ventrolateral/insular cortex (BA45, 13); anterior cingulate cortex (BA32); bilateral occipital regions (BA19); and bilateral posterior parietal cortex including left inferior parietal lobule (BA40) and right superior parietal lobule (BA7). This network is also a subset of those found in the larger meta‐analysis [Owen et al.,2005], suggesting that patients with schizophrenia consistently engage brain regions similar to those observed in healthy subjects when performing the n‐back task (Table III).
Table III.
Patients with schizophrenia alone
| Hemisphere | Lobe | Gyrus | BA | Volume (mm3) | Center | ||
|---|---|---|---|---|---|---|---|
| Right | Frontal | Inferior frontal | 9 | 2,096 | 49 | 8 | 32 |
| Left | Frontal | Medial frontal | 6 | 376 | −1 | −9 | 48 |
| Left | Frontal | Middle frontal | 6 | 280 | −33 | −2 | 45 |
| Right | Frontal | Inferior frontal and precentral | 44,45 | 368 | 46 | 13 | 10 |
| Left | Frontal | Inferior frontal and insula | 13,45 | 256 | −41 | 15 | 12 |
| Midline | Limbic | Cingulate | 32 | 1080 | 6 | 17 | 40 |
| Left | Occipital | Fusiform | 19 | 728 | −37 | −64 | −12 |
| Right | Occipital | Fusiform | 19 | 248 | 37 | −65 | −16 |
| Left | Parietal | Inferior parietal lobule | 40 | 312 | −36 | −48 | 40 |
| Right | Parietal | Superior parietal lobule | 7 | 568 | 25 | −64 | 42 |
BA, Brodmann area; center, center of mass in Talairach coordinates.
Healthy Subjects > Patients With Schizophrenia
Four articles report relative increases in activation in healthy subjects compared to that in patients with schizophrenia while performing the n‐back task during functional neuroimaging (40 foci). Healthy subjects consistently activated bilateral dorsolateral prefrontal cortex (BA9), rostral prefrontal cortex (BA11), and right ventrolateral/insular cortex (BA13) more than patients with schizophrenia did. Each of these frontal regions was significantly more activated in healthy subjects than in patients in at least three of four available articles (see Table IV).
Table IV.
Healthy subjects > patients with schizophrenia
| Hemisphere | Lobe | Gyrus | BA | Volume (mm3) | Center of mass | ||
|---|---|---|---|---|---|---|---|
| Right | Frontal | Medial frontal | 11 | 472 | 7 | 44 | −13 |
| Right | Frontal | Middle and inferior frontal | 9 | 1,200 | 33 | 37 | 28 |
| Left | Frontal | Middle frontal | 9 | 1,736 | −33 | 35 | 23 |
| Right | Frontal | Inferior frontal and insula | 13 | 936 | 38 | 16 | 5 |
BA, Brodmann area; center, center of mass in Talairach coordinates.
Patients With Schizophrenia > Healthy Subjects
Six articles directly modeled relative increases in activation in patients with schizophrenia compared to healthy subjects (38 foci). Three frontal regions were consistently activated in patients with schizophrenia more than they were in healthy subjects: left frontal pole (BA10), right dorsomedial prefrontal cortex (BA9), and anterior cingulate (BA32). Of these regions, the dorsomedial prefrontal area was not found in the larger meta‐analysis of healthy subjects or the patient‐alone contrast, making inferences about the role of this region difficult (Table V).
Table V.
Patients with schizophrenia > healthy subjects
| Hemisphere | Lobe | Gyrus | BA | Volume (mm3) | Center of mass | ||
|---|---|---|---|---|---|---|---|
| Left | Frontal | Middle frontal | 10 | 560 | −44 | 42 | −3 |
| Right | Frontal | Superior frontal | 9 | 264 | 4 | 57 | 26 |
| Midline | Frontal | Cingulate | 32 | 656 | −2 | 14 | 35 |
BA, Brodmann area; center, center of mass in Talairach coordinates.
DISCUSSION
Although we find clear support for hypofrontality in patients with schizophrenia contrasted with healthy subjects, we also document consistently increased activation in anterior cingulate and left frontal pole regions in patients relative to controls (Fig. 2). These data suggest that although reduced DLPFC activation is reported consistently in patients with schizophrenia relative to healthy subjects, abnormal activation patterns are not restricted to this region, raising questions as to whether the pathophysiological dysfunction in schizophrenia is specific to the DLPFC. The complex pattern of hyper‐ and hypoactivation consistently found across studies implies that rather than focusing exclusively on DLPFC dysregulation, researchers should consider DLPFC dysfunction in the context of the larger network supporting a given task when making inferences about the biological mechanisms of schizophrenia.
Figure 2.
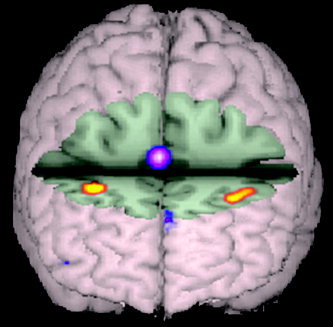
Volume rendering of between‐group contrasts where relative increased activity for healthy subjects is presented in red‐yellow (DLPFC; BA9) and relative increased activity for patients with schizophrenia is shown in purple‐pink (anterior cingulate; BA32). Although patients with schizophrenia engaged the DLPFC less than comparison subjects, they overactivated a portion of the anterior cingulate. Evidence of reduced DLPFC activation and increased activity in the anterior cingulate may be consistent with the notion that schizophrenia disrupts or reverses the normal functional connectivity of prefrontal and limbic structures.
Evidence of reduced DLPFC activation and increased activity in the anterior cingulate may be consistent with the notion that schizophrenia disrupts or reverses the normal functional connectivity of prefrontal and limbic structures and represents a disconnection syndrome [Andreasen et al.,1999; Friston and Frith,1995; Hoffman,1997; Weinberger et al.,1992]. Given the role of the anterior cingulate in monitoring of error commission [Ghering et al.,1993], Carter et al. [2001] speculated that increased activity in the anterior cingulate and decreased activity in the DLPFC might occur if patients have impaired attentional control leading to greater response conflict and demands for error monitoring. The increased frontal pole activity found in the current study has also been seen in previous studies of verbal episodic memory [Heckers et al.,1998; Ragland et al.,2001] and attributed to increased retrieval effort in the patient sample. Consistent evidence for reciprocal effects of schizophrenia on prefrontal and temporal‐limbic regions indicates the importance of utilizing methods for network analysis of functional imaging data. Such methods assess voxel‐level covariance to quantify the functional relationship between brain regions and determine potential functional (nondirectional) or effective (directional) connectivity (e.g., path analysis [McIntosh and Gonzalez‐Lima,1994], principal component analysis [Moeller and Strother,1991], and independent component analysis [McKeown et al.,1998]). These methods provide a means of testing for interregional correlations in functional activity that show the largest changes across diagnostic groups or task conditions; strongly positive or negative correlations between regions imply that these regions are connected functionally [McKeown et al.,1998]. This approach has been applied with some success to studies of schizophrenia [Jacobsen et al.,2004; Jennings et al.,1998; Lawrie et al.,2002; Meyer‐Lindenberg et al.,2001; Schlosser et al.,2003]. These studies provide increasing evidence that cognitive dysfunction in schizophrenia may involve not only impaired function of specific neuroanatomical regions, but also impairment in the ability to engage functional networks subserving specific cognitive challenges [e.g., Friston and Frith,1995]. For example, Jacobsen et al. [2004] found that in patients with schizophrenia, nicotine enhanced performance a on a dichotic listening 2‐back task, corresponding with increased activation of a network of brain regions, including the anterior cingulate and bilateral thalamus. Nicotine also modulated thalamocortical functional connectivity to a greater degree in schizophrenics than it did in controls, suggesting a mechanism by which nicotine may differentially enhance cognitive performance in patients with schizophrenia; namely, by allowing more effective recruitment and coordination of necessary brain regions [Jacobsen et al.,2004]. When assessing connectivity, particularly effective connectivity, it is useful to limit the number of model parameters included in the analysis [Bullmore et al.,2000]. This is accomplished typically by choosing, a priori, a set of brain regions thought to be involved in a specific task. To that end, the current review, in conjunction with the one presented by Owen et al. [2005], could be used to nominate specific brain regions for the analysis of novel data. Alternatively, one could determine the covariance or connectivity between areas found to be hypoactive in the current review (e.g., DLPFC) within a healthy population and determine if a similar variance structure is present in individuals with schizophrenia.
Performance differences complicate interpretation of between‐group differences in functional activation patterns. Early reports suggested that better task performance on working memory or executive measures resulted in relatively more brain activity in key brain regions [Haier et al.,1992; Ragland et al.,1997]. In contrast, Jansma et al. [2001] reported that for some brain areas, better performance was related to less activity, potentially due to increased “automation” of for the specific cognitive process. [Callicott et al. [1999,2000,2003] suggested that activation patterns share a nonlinear or biphasic relationship with task performance that is predicted by the working memory or storage capacity of the individual. In this model, imaging signal is maximal at or around the working memory capacity of each individual and decreases when subjects must process sub‐ or suprathreshold amounts of information, suggesting that each individual should be imaged while performing a working memory task at his or her own capacity [Manoach,2003]. Although this approach may maximize imaging signal, it begs the question of why patients with schizophrenia tend to have lower working memory capacities than comparison subjects do [Gold et al.,2003]. Nonetheless, functional imaging studies comparing two or more groups of subjects need to carefully consider performance differences when interpreting results. By extension, group behavioral differences are an important consideration for quantitative meta‐analyses of multigroup imaging studies. Indeed, in the current meta‐analysis, patients with schizophrenia performed worse than comparison subjects did in all but one reviewed articles and the imaging differences reported here are certainly influenced by between‐group performance differences. Unfortunately, current meta‐analysis algorithms do not allow for weighting of studies based on behavioral performance, significantly limiting their utility for combining clinical studies to obtain pooled neural activation results. Although we are currently developing a system for modeling behavioral differences in meta‐analytic studies, the nonlinear relationship between task performance and imaging signal makes disentangling these factors nontrivial.
Schizophrenia, like most major psychiatric illnesses, is marked by significant heterogeneity in terms of clinical presentation, illness course, and response to pharmacologic or behavioral treatments, even within reliable diagnostic categories [Keefe et al.,1996; Kendler,1990]. Indeed, there is some level of debate about whether the current diagnostic nosology includes several distinct subgroups of patients with markedly different etiologies [Tsuang et al.,2000]. Given concerns about the heterogeneity of individuals diagnosed with schizophrenia, it would seem prudent for functional neuroimaging investigations of schizophrenia to include relatively large well‐characterized samples. Despite the potential heterogeneity of patients within and across studies, most functional imaging studies include small samples and poor clinical descriptions, potentially due to the prohibitive expense of large samples in such experiments. In this climate, quantitative meta‐analytic reviews could significantly improve our understanding of the neuroimaging findings by revealing consistent trends across larger patient samples than could be reasonably collected in any single study. The current analysis combined data from 186 patients with schizophrenia and clearly finds evidence for bilateral reductions in DLPFC activity and increases in anterior cingulate and frontal pole activity when patients with schizophrenia perform an n‐back paradigm. Although this finding was not unexpected, our results broaden the literature by providing the average location and extent of hypofrontality one should expect when conducting an n‐back experiment with patients with schizophrenia. In addition, because quantitative meta‐analytic reviews are carried out upon all of the reported activation foci, it is possible that trends in the data not appreciated in individual studies are delineated more clearly.
Although the quantitative meta‐analytic method used here represents a significant advance for integrating functional neuroimaging data, the method remains subject to the basic limitation of literature reviews; namely, a review can only be as good as the data being reviewed. For a voxel‐level meta‐analysis, this principle is most obvious when comparing reviews with large numbers of activation foci to those with fewer foci. Indeed, contrasting the functional atlas and healthy comparison rows of Figure 1 (top two rows), we see that although both rows reflect healthy subjects performing the n‐back paradigm, the atlas, made up of over 600 foci, includes the entire network of regions putatively involved in working memory. The healthy comparison analysis, made up of 60 foci, includes only a subset of these regions. Because individuals recruited as comparison subjects in functional imaging studies of schizophrenia are presumably similar to those that participated in the studies in the normative analyses carried out by Owen et al. [2005], we believe that the differences between the two analyses is due simply to the limited number of observations (foci) in the comparison subject analysis. The ramifications of this assertion are that: (1) analyses with a larger number of foci will reflect better the total network involved in a cognitive task; and (2) that the absence of a region in an analysis with a limited number of foci should not lead to the assumption that the brain area is not critical for the cognitive process in question. All brain regions found in each of the four meta‐analyses conducted for this review, with the exception of a dorsomedial region found in the “patients greater than comparison subject contrast,” were within the network identified in the normative study by Owen et al. [2005].
Finally, an unexpected finding of the current review was the striking lack of consistency in reporting between‐group imaging results across studies. For voxel‐based meta‐analyses to reach their full potential, it is important to include sufficient information to allow for pooling of data across studies, and there is a need for the development of more consistent standards of reporting data analyses in functional neuroimaging studies.
Acknowledgements
This research was supported by grants from NARSAD (Essel Young Investigator to D.C.G), the National Institute of Mental Health (MH 62850 to D.I.V.) and the UTHSCSA GCRC (M01‐RR‐01346). In addition, A. Abramoff was supported by the National Institutes of Health (MARC‐U*STAR GM07717).
REFERENCES
- Andreasen NC, Nopoulos P, O'Leary DS, Miller DD, Wassink T, Flaum M (1999): Defining the phenotype of schizophrenia: cognitive dysmetria and its neural mechanisms. Biol Psychiatry 46: 908–920. [DOI] [PubMed] [Google Scholar]
- Andreasen NC, Rezai K, Alliger R, Swayze VW (1992): Hypofrontality in neuroleptic‐naive patients and in patients with chronic schizophrenia: Assessment with xenon 133 single‐photon emission computed tomography and the Tower of London. Arch Gen Psychiatry 49: 943–958. [DOI] [PubMed] [Google Scholar]
- Bullmore E, Horwitz B, Honey G, Brammer M, Williams S, Sharma T (2000): How good is good enough in path analysis of fMRI data? Neuroimage 11: 289–301. [DOI] [PubMed] [Google Scholar]
- Callicott J, Bertolino A, Mattay V, Langheim F, Duyn J, Coppola R, Goldberg T, Weinberger D (2000): Physiological dysfunction of the dorsolateral prefrontal cortex in schizophrenia revisited. Cereb Cortex 10: 1078–1092. [DOI] [PubMed] [Google Scholar]
- Callicott J, Mattay V, Verchinski B, Marenco S, Egan M, Weinberger D (2003): Complexity of prefrontal cortical dysfunction in schizophrenia: more than up or down. Am J Psychiatry 160: 2209–2215. [DOI] [PubMed] [Google Scholar]
- Callicott JH, Mattay VS, Bertolino A, Finn K, Coppola R, Frank JA, Goldberg TE, Weinberger DR (1999): Physiological characteristics of capacity constraints in working memory as revealed by functional MRI. Cereb Cortex 9: 20–26. [DOI] [PubMed] [Google Scholar]
- Carter C, MacDonald A 3rd, Ross L, Stenger V (2001): Anterior cingulate cortex activity and impaired self‐monitoring of performance in patients with schizophrenia: an event‐related fMRI study. Am J Psychiatry 158: 1423–1428. [DOI] [PubMed] [Google Scholar]
- Carter CS, Perlstein W, Ganguli R, Brar J, Mintun M, Cohen JD (1998): Functional hypofrontality and working memory dysfunction in schizophrenia. Am J Psychiatry 155: 1285–1287. [DOI] [PubMed] [Google Scholar]
- Chafee MV, Goldman‐Rakic PS (2000): Inactivation of parietal and prefrontal cortex reveals interdependence of neural activity during memory‐guided saccades. J Neurophysiol 83: 1550–1566. [DOI] [PubMed] [Google Scholar]
- Cohen JD, Perlstein WM, Braver TS, Nystrom LE, Noll DC, Jonides J, Smith EE (1997): Temporal dynamics of brain activation during a working memory task. Nature 386: 604–608. [DOI] [PubMed] [Google Scholar]
- Cohen JD, Servan‐Schreiber D (1993): A theory of dopamine function and its role in cognitive deficits in schizophrenia. Schizophr Bull 19: 85–104. [DOI] [PubMed] [Google Scholar]
- Friston K, Frith C (1995): Schizophrenia: a disconnection syndrome? Clin Neurosci 3: 89–97. [PubMed] [Google Scholar]
- Genovese CR, Lazar NA, Nichols TE (2002): Thresholding of statistical maps in functional neuroimaging using the false discovery rate. Neuroimage 15: 870–878. [DOI] [PubMed] [Google Scholar]
- Gevins A, Cutillo B (1993): Neuroelectric evidence for distributed processing in human working memory. Electroencephalogr Clin Neurophysiol 87: 128–143. [DOI] [PubMed] [Google Scholar]
- Ghering W, Gross B, Coles M, Myer D, Donchin E (1993): A neural system for error detection and compensation. Psychol Sci 4: 385–390. [Google Scholar]
- Glantz LA, Lewis DA (1997): Reduction of synaptophysin immunoreactivity in the prefrontal cortex of subjects with schizophrenia: regional and diagnostic specificity. Arch Gen Psychiatry 54: 943–952. [DOI] [PubMed] [Google Scholar]
- Gold J, Wilk C, McMahon R, Buchanan R, Luck S (2003): Working memory for visual features and conjunctions in schizophrenia. J Abnorm Psychol 113: 61–71. [PubMed] [Google Scholar]
- Goldman‐Rakic PS (1994): Working memory dysfunction in schizophrenia. J Neuropsychiatry Clin Neurosci 6: 348–357. [DOI] [PubMed] [Google Scholar]
- Goldman‐Rakic PS (1996): Regional and cellular fractionation of working memory. Proc Natl Acad Sci USA 93: 13473–13480. [DOI] [PMC free article] [PubMed] [Google Scholar]
- Goldman‐Rakic PS, Selemon LD (1997): Functional and anatomical aspects of prefrontal pathology in schizophrenia. Schizophr Bull 23: 437–458. [DOI] [PubMed] [Google Scholar]
- Gur RC, Alsop D, Glahn D, Petty R, Swanson CL, Maldjian JA, Turetsky BI, Detre JA, Gee J, Gur RE (2000): An fMRI study of sex differences in regional activation to a verbal and a spatial task. Brain Lang 74: 157–170. [DOI] [PubMed] [Google Scholar]
- Gur RC, Gur RE (1995): Hypofrontality in schizophrenia: RIP. Lancet 345: 1383–1384. [DOI] [PubMed] [Google Scholar]
- Gur RC, Mozley LH, Mozley PD, Resnick SM, Karp JS, Alavi A, Arnold SE, Gur RE (1995): Sex differences in regional cerebral glucose metabolism during a resting state. Science 267: 528–531. [DOI] [PubMed] [Google Scholar]
- Haier RJ, Siegel BVJ, MacLachlan A, Soderling E, Lottenberg S, Buchsbaum MS (1992): Regional glucose metabolic changes after learning a complex visuospatial/motor task: a positron emission tomographic study. Brain Res 570: 134–143. [DOI] [PubMed] [Google Scholar]
- Heckers S, Rauch S, Goff D, Savage C, Schacter D, Fischman A, Alpert N (1998): Impaired recruitment of the hippocampus during conscious recollection in schizophrenia. Nat Neurosci 1: 318–323. [DOI] [PubMed] [Google Scholar]
- Hoffman RE (1997): Neural network simulations, cortical connectivity, and schizophrenic psychosis. MD Comput 14: 200–208. [PubMed] [Google Scholar]
- Honey GD, Bullmore ET, Sharma T (2002): De‐coupling of cognitive performance and cerebral functional response during working memory in schizophrenia. Schizophr Res 53: 45–56. [DOI] [PubMed] [Google Scholar]
- Honey GD, Bullmore ET, Soni W, Varatheesan M, Williams SC, Sharma T (1999): Differences in frontal cortical activation by a working memory task after substitution of risperidone for typical antipsychotic drugs in patients with schizophrenia. Proc Natl Acad Sci USA 96: 13432–13437. [DOI] [PMC free article] [PubMed] [Google Scholar]
- Honey GD, Sharma T, Suckling J, Giampietro V, Soni W, Williams SC, Bullmore ET (2003): The functional neuroanatomy of schizophrenic subsyndromes. Psychol Med 33: 1007–1018. [DOI] [PubMed] [Google Scholar]
- Ingvar DH, Franzén G (1974): Distribution of cerebral activity in chronic schizophrenia. Lancet 2: 1484–1486. [DOI] [PubMed] [Google Scholar]
- Jacobsen LK, D'Souza DC, Mencl WE, Pugh KR, Skudlarski P, Krystal JH (2004): Nicotine effects on brain function and functional connectivity in schizophrenia. Biol Psychiatry 55: 850–858. [DOI] [PubMed] [Google Scholar]
- Jansma J, Ramsey N, Slagter H, Kahn R (2001): Functional anatomical correlates of controlled and automatic processing. J Cogn Neurosci 13: 730–743. [DOI] [PubMed] [Google Scholar]
- Jennings JM, McIntosh AR, Kapur S, Zipursky RB, Houle S (1998): Functional network differences in schizophrenia: a rCBF study of semantic processing. Neuroreport 9: 1697–1700. [DOI] [PubMed] [Google Scholar]
- Keefe RS, Frescka E, Apter SH, Davidson M, Macaluso JM, Hirschowitz J, Davis KL (1996): Clinical characteristics of Kraepelinian schizophrenia: replication and extension of previous findings. Am J Psychiatry 153: 806–811. [DOI] [PubMed] [Google Scholar]
- Kendler K (1990): Toward a scientific psychiatric nosology: strengths and limitations. Arch Gen Psychiatry 47: 969–973. [DOI] [PubMed] [Google Scholar]
- Kim JJ, Kwon JS, Park HJ, Youn T, Kang do H, Kim MS, Lee DS, Lee MC (2003): Functional disconnection between the prefrontal and parietal cortices during working memory processing in schizophrenia: a[15(O)]H2O PET study. Am J Psychiatry 160: 919–923. [DOI] [PubMed] [Google Scholar]
- Kindermann SS, Brown GG, Zorrilla LE, Olsen RK, Jeste DV (2004): Spatial working memory among middle‐aged and older patients with schizophrenia and volunteers using fMRI. Schizophr Res 68: 203–216. [DOI] [PubMed] [Google Scholar]
- Laird AR, Fox PM, Price CJ, Glahn DC, Uecker AM, Lancaster JL, Turkeltaub PE, Kochunov P, Fox PT (2005a): ALE meta‐analysis: controlling the false discovery rate and performing statistical contrasts. Hum Brain Mapp 25: 155–164. [DOI] [PMC free article] [PubMed] [Google Scholar]
- Laird AR, McMillan KM, Lancaster JL, Kochunov P, Turkeltaub PE, Pardo JV, Fox PT (2005b): A comparison of label‐based review and ALE meta‐analysis in the Stroop task. Hum Brain Mapp 25: 6–21. [DOI] [PMC free article] [PubMed] [Google Scholar]
- Lawrie SM, Buechel C, Whalley HC, Frith CD, Friston KJ, Johnstone EC (2002): Reduced frontotemporal functional connectivity in schizophrenia associated with auditory hallucinations. Biol Psychiatry 51: 1008–1011. [DOI] [PubMed] [Google Scholar]
- Manoach D (2003): Prefrontal cortex dysfunction during working memory performance in schizophrenia: reconciling discrepant findings. Schizophr Res 60: 285–298. [DOI] [PubMed] [Google Scholar]
- McIntosh AR (2000): Towards a network theory of cognition. Neural Netw 13: 861–870. [DOI] [PubMed] [Google Scholar]
- McIntosh AR, Gonzalez‐Lima F (1994): Structural equation modeling and its application to network analysis in functional brain imaging. Hum Brain Mapp 2: 2–22. [Google Scholar]
- McKeown MJ, Makeig S, Brown GG, Jung TP, Kindermann SS, Bell AJ, Sejnowski TJ (1998): Analysis of fMRI data by blind separation into independent spatial components. Hum Brain Mapp 6: 160–188. [DOI] [PMC free article] [PubMed] [Google Scholar]
- Mesulam MM (1998): From sensation to cognition. Brain 121: 1013–1052. [DOI] [PubMed] [Google Scholar]
- Meyer‐Lindenberg A, Poline JB, Kohn PD, Holt JL, Egan MF, Weinberger DR, Berman KF (2001): Evidence for abnormal cortical functional connectivity during working memory in schizophrenia. Am J Psychiatry 158: 1809–1817. [DOI] [PubMed] [Google Scholar]
- Moeller JR, Strother SC (1991): A regional covariance approach to the analysis of functional patterns in position emission tomographic data. J Cereb Blood Flow Metab 11: 121–135. [DOI] [PubMed] [Google Scholar]
- Nuechterlein KH, Parasuraman R, Jiang Q (1983): Visual sustained attention: image degradation produces rapid sensitivity decrement over time. Science 220: 327–329. [DOI] [PubMed] [Google Scholar]
- Nystrom LE, Braver TS, Sabb FW, Delgado MR, Noll DC, Cohen JD (2000): Working memory for letters, shapes, and locations: fMRI evidence against stimulus‐based regional organization in human prefrontal cortex. Neuroimage 11: 424–446. [DOI] [PubMed] [Google Scholar]
- O'Reilly RC, Braver TS, Cohen JD (1999): A biologically based computational model of working memory In: Miyake A, Shah P, et al., editors. Models of working memory: mechanisms of active maintenance and executive control. New York, NY: Cambridge University Press; p 375–411. [Google Scholar]
- Owen A, McMillan K, Laird A, Bullmore E (2005): The n‐back working memory paradigm: a meta‐analysis of normative fMRI studies. Hum Brain Mapp 25: 46–59. [DOI] [PMC free article] [PubMed] [Google Scholar]
- Perlstein WM, Carter CS, Noll DC, Cohen JD (2001): Relation of prefrontal cortex dysfunction to working memory and symptoms in schizophrenia. Am J Psychiatry 158: 1105–1113. [DOI] [PubMed] [Google Scholar]
- Perlstein WM, Dixit NK, Carter CS, Noll DC, Cohen JD (2003): Prefrontal cortex dysfunction mediates deficits in working memory and prepotent responding in schizophrenia. Biol Psychiatry 53: 25–38. [DOI] [PubMed] [Google Scholar]
- Quintana J, Fuster JM (1999): From perception to action: temporal integrative functions of prefrontal and parietal neurons. Cereb Cortex 9: 213–221. [DOI] [PubMed] [Google Scholar]
- Ragland J, Gur R, Raz J, Schroeder L, Smith R, Alavi A, Gur RE (2001): Effect of schizophrenia on frontotemporal activity during word encoding and recognition: a PET cerebral blood flow study. Am J Psychiatry 158: 1114–1125. [DOI] [PMC free article] [PubMed] [Google Scholar]
- Ragland JD, Glahn DC, Gur RC, Censits DM, Smith RJ, Mozley PD, Alavi A, Gur RE (1997): PET regional cerebral blood flow change during working and declarative memory: relationship with task performance. Neuropsychology 11: 222–231. [DOI] [PMC free article] [PubMed] [Google Scholar]
- Ragland JD, Gur RC, Glahn DC, Censits DM, Smith RJ, Lazarev MG, Alavi A, Gur RE (1998): Frontotemporal cerebral blood flow change during executive and declarative memory tasks in schizophrenia: a positron emission tomography study. Neuropsychology 12: 399–413. [DOI] [PMC free article] [PubMed] [Google Scholar]
- Ramsey NF, Koning HA, Welles P, Cahn W, van der Linden JA, Kahn RS (2002): Excessive recruitment of neural systems subserving logical reasoning in schizophrenia. Brain 125: 1793–807. [DOI] [PubMed] [Google Scholar]
- Sabri O, Owega A, Schreckenberger M, Sturz L, Fimm B, Kunert P, Meyer PT, Sander D, Klingelhofer J (2003): A truly simultaneous combination of functional transcranial Doppler sonography and H2 15O PET adds fundamental new information on differences in cognitive activation between schizophrenics and healthy control subjects. J Nucl Med 44: 671–681. [PubMed] [Google Scholar]
- Schlosser R, Gesierich T, Kaufmann B, Vucurevic G, Stoeter P (2003): Altered effective connectivity in drug free schizophrenic patients. Neuroreport 14: 2233–2237. [DOI] [PubMed] [Google Scholar]
- Selemon LD, Goldman‐Rakic PS (1999): The reduced neuropil hypothesis: A circuit based model of schizophrenia. Biol Psychiatry 45: 17–25. [DOI] [PubMed] [Google Scholar]
- Selemon LD, Rajkowska G, Goldman‐Rakic PS (1995): Abnormally high neuronal density in the schizophrenic cortex: A morphometric analysis of prefrontal area 9 and occipital area 17. Arch Gen Psychiatry 52: 805–818. [DOI] [PubMed] [Google Scholar]
- Smith EE, Jonides J (1998): Neuroimaging analyses of human working memory. Proc Natl Acad Sci USA 95: 12061–12068. [DOI] [PMC free article] [PubMed] [Google Scholar]
- Spitzer M (1993): The psychopathology, neuropsychology, and neurobiology of associative and working memory in schizophrenia. Eur Arch Psychiatry Clin Neurosci 243: 57–70. [DOI] [PubMed] [Google Scholar]
- Tsuang MT, Stone WS, Faraone SV (2000): Toward reformulating the diagnosis of schizophrenia. Am J Psychiatry 157: 1041–1050. [DOI] [PubMed] [Google Scholar]
- Turkeltaub P, Eden G, Jones K, Zeffiro T (2002): Meta‐analysis of the functional neuroanatomy of single‐word reading: method and validation. Neuroimage 16: 765–780. [DOI] [PubMed] [Google Scholar]
- Walter H, Wunderlich AP, Blankenhorn M, Schafer S, Tomczak R, Spitzer M, Gron G (2003): No hypofrontality, but absence of prefrontal lateralization comparing verbal and spatial working memory in schizophrenia. Schizophr Res 61: 175–184. [DOI] [PubMed] [Google Scholar]
- Weinberger D, Berman K (1996): Prefrontal function in schizophrenia: confounds and controversies. Philos Trans R Soc Lond B Biol Sci 351: 1495–1503. [DOI] [PubMed] [Google Scholar]
- Weinberger D, Berman K, Suddath R, Torrey E (1992): Evidence of dysfunction of a prefrontal‐limbic network in schizophrenia: a magnetic resonance imaging and regional cerebral blood flow study of discordant monozygotic twins. Am J Psychiatry 149: 890–897. [DOI] [PubMed] [Google Scholar]
- Weinberger DR, Berman KF, Zec RF (1986): Physiologic dysfunction of dorsolateral prefrontal cortex in schizophrenia: I. Regional cerebral blood flow evidence. Arch Gen Psychiatry 43: 114–124. [DOI] [PubMed] [Google Scholar]
- Wykes T, Brammer M, Mellers J, Bray P, Reeder C, Williams C, Corner J (2002): Effects on the brain of a psychological treatment: cognitive remediation therapy: functional magnetic resonance imaging in schizophrenia. Br J Psychiatry 181: 144–152. [DOI] [PubMed] [Google Scholar]
- Yurgelun‐Todd DA, Waternaux CM, Cohen BM, Gruber SA, English CD, Renshaw PF (1996): Functional magnetic resonance imaging of schizophrenic patients and comparison subjects during word production. Am J Psychiatry 153: 200–205. [DOI] [PubMed] [Google Scholar]