

Abstract
Recent animal and human studies indicate the existence of a neural pathway for sound localization, which is similar to the “where” pathway of the visual system and distinct from the sound identification pathway. This study sought to highlight this pathway using a passive listening protocol. We employed fMRI to study cortical areas, activated during the processing of sounds coming from different locations, and MEG to disclose the temporal dynamics of these areas. In addition, the hypothesis of different activation levels in the right and in the left hemispheres, due to hemispheric specialization of the human brain, was investigated. The fMRI results indicate that the processing of sound, coming from different locations, activates a complex neuronal circuit, similar to the sound localization system described in monkeys known as the auditory “where” pathway. This system includes Heschl's gyrus, the superior temporal gyrus, the supramarginal gyrus, and the inferior and middle frontal lobe. The MEG analysis allowed assessment of the timing of this circuit: the activation of Heschl's gyrus was observed 139 ms after the auditory stimulus, the peak latency of the source located in the superior temporal gyrus was at 156 ms, and the inferior parietal lobule and the supramarginal gyrus peaked at 162 ms. Both hemispheres were found to be involved in the processing of sounds coming from different locations, but a stronger activation was observed in the right hemisphere. Hum. Brain Mapping, 2005. © 2005 Wiley‐Liss, Inc.
Keywords: auditory space localization, neuroimaging, fMRI, MEG
INTRODUCTION
Brain areas activated by sound localization tasks have been studied in nonhuman primates, normal human subjects, and patients. Although there is a general agreement on the areas involved in this task, a clear sequence of activation still has to be determined.
Rauschecker and Tian [2000], on the basis of their work mainly carried out on nonhuman primates, suggested that the auditory space is processed in a posterior (caudal) pathway leading dorsally from the primary auditory cortex in Heschl's gyrus up to the inferior parietal cortex through the caudal belt and parabelt in the superior temporal gyrus (STG). The authors also suggest that a similar processing pathway can be found in the human auditory cortex. Similarly, Kaas and Hackett [2000] provide evidence for the existence of such a pathway in their nonhuman primates study. The authors distinguished separate pathways for processing spatial and nonspatial auditory information, respectively originating in the caudal and rostral areas of the nonprimary auditory cortex. The role of the primary auditory cortex in sound localization was previously demonstrated by Jenkins and Merzenich's [1984] in a behavioral study on adult cats with lesions in the primary auditory cortex. Finally, human lesion studies [Clarke et al., 2000; Thiran and Clarke, 2003] also suggest the existence of a sound localization pathway.
Various functional imaging studies on humans observed that sounds coming from different locations activate the prefrontal cortex and the associative parietal cortex, in addition to the auditory cortex [Bushara, et al., 1999; Griffiths, et al., 1998]. The associative parietal cortex, which includes superior and inferior parietal gyri, is involved in complex functions such as human orientation and sensorimotor integration [Andersen, 1995; Nolte, 1991]. In particular, several studies have shown that the right parietal cortex is activated during passive listening to sounds coming from fixed locations or moving in space. However, the precise location of this activation is inconsistent across the studies. For example, some studies showed activation in the inferior parietal lobe [Weeks et al., 1999], while others observed activation in the superior parietal lobe [Griffiths, and Green, 1999]. Hart et al. [2004] found a left superior parietal cortex activation that, as these authors suggest, seemed to depend on the subject attending to the presence or absence of motion. On the other hand, Zatorre et al. [2002a] suggested the involvement of the inferior parietal cortex in tasks requiring the use of sound location information to guide motor responses. Several studies [Alain et al., 2001; Maeder et al., 2000] using a sound localization task found that the parietal region plays a key role in a larger network involved in auditory spatial processing. Alain et al. [2001], using functional MRI (fMRI) and event‐related potential (ERP), showed activation in the auditory cortex, posterior temporal areas, and inferior and superior parietal cortex during a sound localization task. Furthermore, a recent study [Zatorre et al., 2002a] emphasized the role of the posterior auditory cortex in the disambiguation of overlapping auditory sources, also pointing out the involvement of the inferior parietal cortex in auditory spatial processing. Finally, a recent meta‐analysis of PET and fMRI studies of auditory processing [Arnott et al., 2004] underlines the importance of the inferior parietal lobe in sound localization.
The role of hemispheric dominance in sound localization is still debated. According to a PET study [Weeks et al., 1999], sound localization activates the right inferior parietal lobule and the right superior temporal region. Some investigations support lateralization in the processing of acoustic space [Griffiths et al., 1998; Kaiser and Lutzenberger, 2001; Kaiser et al., 2001], while others found no evidence for this type of lateralization [Bushara et al., 1999; Woldorff et al., 1999]. Recently, Palomäki et al. [2002] investigated the cortical processing of spatial broadband noise bursts by means of magnetoencephalography (MEG). These authors found that the N1m response (the first cortical component of the human magnetic evoked response to sound) is maximal in both the left and right cerebral hemispheres for contralaterally located sound sources; however, the right hemisphere is strongly activated in all cases. This activation suggests a wider involvement of this hemisphere in the processing of auditory spatial information. Right hemisphere dominance in sound localization was also suggested by a behavioral study [Zatorre and Penhune, 2001]. In that study, patients with unilateral temporal lobe excisions showed bilaterally impaired performance in a sound localization task: The finding referred predominantly to patients with right temporal excision, with or without encroachment on Heschl's gyrus. The conclusion of Zatorre and collaborators is that the damage to the right anterior superior temporal gyrus, not encroaching the primary auditory cortex, produced a sound localization deficit in both hemifields.
This study is aimed at clarifying: (1) the cortical areas that are activated by sounds coming from different locations during a passive listening task; (2) whether these areas are connected in a circuit functionally similar to the “where” circuit of the visual system; and (3) whether there is a more important involvement of the right hemisphere with respect to the left one. The study focused on the superior temporal and transverse temporal gyri (BA 41, 42) and the supramarginal gyrus, a part of the inferior parietal lobule that extends into the superior temporal gyrus (BA 40). Further, this investigation aimed to assess whether the results from previous studies in nonhuman primates can be extended to human subjects.
In this study fMRI data were supplemented with MEG data in order to take advantage of the specific features of the different neuroimaging techniques. Blood oxygen level‐dependent (BOLD) contrast fMRI allows the localization of event‐related increases of metabolism in active brain regions during sensory events, as reflected by blood flow and oxygen consumption. This technique has an excellent spatial resolution of a few millimeters, but a temporal resolution on the order of 1 s, due to hemodynamic limits. On the other hand, MEG directly investigates event‐related electric cerebral activity with a millisecond time resolution by localizing the sources of the associated magnetic field, but it lacks accuracy in identifying multiple closely located regions. In short, fMRI was used to localize the anatomical sites of activation during auditory stimulation. Subsequently, MEG was employed to investigate the functional temporal dynamics in these areas.
SUBJECTS AND METHODS
Subjects and Stimuli
Eleven healthy volunteers (seven females, four males; mean age: 25 ± 5 years) participated in the fMRI data acquisitions after providing written informed consent. The experimental protocol was approved by the local institutional ethics committee. One of the 11 subjects was not willing to participate in the MEG investigation, and another was excluded from the MEG procedure because his head was too large for our helmet magnetometer. Therefore, only nine of the original subjects were studied with MEG as well. No subjects had anamnestic or clinical auditory impairment and everyone had normal hearing thresholds at pure‐tone audiometry. The volunteers were right‐handed as assessed by the Oldfield questionnaire [Oldfield, 1971] and had no previous history of neurological or psychiatric illness. Before the fMRI sessions the sound localization abilities of each subject were assessed by delivering the same stimuli used during the experiment and asking the subjects to report the position of sounds aloud. During both the fMRI and MEG sessions stimuli were delivered via a nonmagnetic and MRI‐compatible sound system (Commander XG MRI Audio System). The frequency response ranged from 100 Hz to 25 kHz. The electric signals generated by the computer audio‐board were amplified and sent through the shielded room penetration panel to an electropneumatic transducer located outside the scanner. The sounds reached the subject headset via flexible plastic tubes.
The stimulus consisted of a knife tapping on an empty glass. This acoustic source was chosen because it is an environmental stimulus with a clear sound and a broad frequency spectrum. Indeed, the process of sound localization is based on the whole of the waveform (bandwidth and amplitude modulation). It is more efficient when the frequency band of the stimulus is broad and the spectrum undergoes significant amplitude changes in time. However, the changes must be smooth and occur in a continuous way, thus the signal receives a well‐defined shape.
The stimulus used has strong amplitudes before and after the critical threshold of 1.5 kHz (Fig. 1) since the brain uses the interaural time difference for frequencies under 1.5 kHz and the interaural level difference for frequencies above this threshold to localize sounds. The significant frequencies ranged from 1200–7200 Hz. These values lie within the frequency response range of both the computer audiocard and the nonmagnetic headset used in the experiment. The duration of each stimulus was 500 ms.
Figure 1.
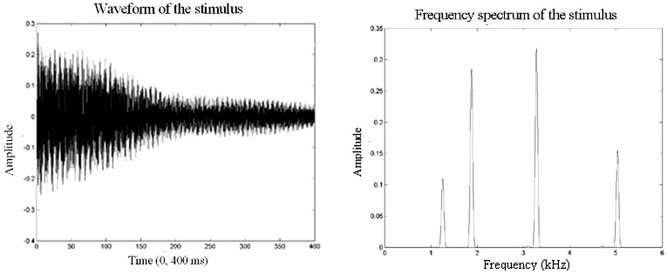
Waveform (left side) and frequency spectrum (right side) of the stimulus.
A virtual 3‐D auditory environment was devised. “Spatial” sounds were generated in an anechoic room at the Institute of Acoustics “O. M. Corbino” of the National Council of Research, in Rome. The stimuli were delivered from five directions to a realistic head dummy that had a microphone placed in each ear via a high‐fidelity loudspeaker placed 1 m from the dummy. The positions were: the vertical head‐centered meridian (0°), right angles to the meridian plane on both sides (left: −90°, right: +90°), and 45° to the meridian plane (left: −45°, right: +45) (Fig. 2a).
Figure 2.
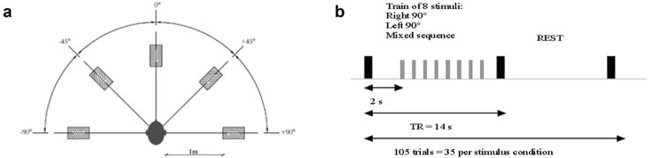
a: Stimuli are delivered from five different spatial locations: the vertical head‐centered meridian (0°), right angles to the meridian plane on both sides (left: −90°, right: +90°), and 45 to the meridian plane (left: −45°, right: +45). b: fMRI experimental paradigm: large black bar represents an fMRI volume acquisition, small gray bar represents the delivery of a stimulus. The sequence was repeated 35 times for each stimulus type. Total number of trials, 105.
fMRI Data Acquisition and Analysis
fMRI recordings during auditory stimulation are hindered by the intense bursts of noise produced by the scanner during image acquisition. To avoid the interference of scanner noise the “sparse” sampling technique proposed by Hall et al. [1999] was used. Following the procedure outlined by those authors, functional volumes at the end of the stimulation periods and of the baseline (silent) periods were acquired. The interval between two consecutive acquisitions (TR) was set at 14 s to allow the hemodynamic response due to the scanner noise to return to baseline before the following image acquisition.
The experimental paradigm in the fMRI sessions was the following (Fig. 2b): sounds were delivered in sequences of 8, with an interval of 1.5 s between two consecutive sounds in a sequence; each sequence was preceded by 2 s without stimuli and followed by a 14‐s silent period (Rest). fMRI data were acquired at the end of each sound sequence and at the end of each Rest period.
We used three types of stimulus sequences. One was a complex sequence consisting of stimuli from all five directions (Mixed). The other two sequences were composed of stimuli coming only from the left (−90°, Left), and only from the right (+90°, Right). The three sequences were presented in random order. The number of trials was the same (35) for the three stimulation sequences, while the number of silent periods was 105, so that a total of 210 functional volumes was acquired.
MRI was carried out with a Siemens Magnetom Vision (Erlangen, Germany) scanner at 1.5 T. A standard head coil was used and the subject's head was held in place with foam pads to reduce involuntary movements. BOLD contrast functional images were acquired by means of T2*‐weighted echo planar imaging (EPI) free induction decay (FID) sequences with the following parameters: TR 14 s, TE 60 ms, matrix size 64 × 64, field of view (FoV) 256 mm, in‐plane voxel size 4 × 4 mm, flip angle 90°, slice thickness 4 mm, and no gap. Functional volumes consisted of 18 transaxial slices parallel to the AC–PC line covering the cortical regions of interest (ROIs). A high‐resolution structural volume was acquired at the end of the session via a 3‐D MPRAGE sequence with the following features: sagittal, matrix 256 × 256, FoV 256 mm, slice thickness 1 mm, no gap, in‐plane voxel size 1 × 1 mm, flip angle 12°, TR = 9.7 ms, TE = 4 ms.
Raw data were analyzed by means of the Brain Voyager software v. 4.6 (Brain Innovation, The Netherlands). Preprocessing of functional scans included motion correction and the removal of linear trends from voxel time series. The preprocessed functional volumes of each subject were recorded at the same time as the corresponding structural dataset from the same session. The coregistration transformation was determined using the slice position parameters of the functional images and the position parameters of the structural volume. After visual inspection, when necessary, this transformation was slightly adjusted to account for subject movement between functional and anatomical scans. Structural and functional volumes were normalized to the Talairach space [Talairach et al., 1988] using a piecewise affine and continuous transformation. Statistical activation maps were generated by means of a t‐test comparing voxel‐by‐voxel images of a given stimulation condition (Left, Right, or Mixed) to those of the Rest condition (baseline condition). These statistical maps were thresholded at P < 0. 0004 at the voxel level and a cluster size of at least four voxels was required. These thresholds and an estimate of the spatial correlation of voxels [3dFWHM routine of AFNI package, Cox, 1996; Forman et al., 1995] were used as input in a Monte‐Carlo simulation [AlphaSim routine of AFNI package, Cox, 1996; Forman et al., 1995] in order to assess the overall significance level (the probability of a false detection of a cluster in the entire functional volume). A corrected P‐value of 0.05 was thus obtained. Thresholded statistical maps were then overlaid on the subject's structural scan to localize significantly activated areas. A statistical group analysis was also performed. The time series obtained from all subjects were z‐normalized and concatenated prior to the computation of the group statistical activation maps. The group activation map was then superimposed on the Talairach transformed structural scan of one of the subjects.
For each subject ROIs were determined on the basis of the individual activation map. Specifically, for every subject the ROI was defined as the cluster of activation above threshold in a given functional area. Rather than defining ROIs on the basis of group activation, this procedure was used in order to take into account interindividual anatomical variability. Further, this procedure avoided underestimating BOLD signals due to a mismatch between a mean ROI and individual activation. The procedure is consistent, since the functional area was always clearly defined. A common ROI (based on group data) was defined only when individual activations were not observed in all subjects. Subject responses in each stimulation condition were characterized by evaluating the BOLD signal intensity variation in each ROI. The strength of the activation was expressed as the mean relative change with respect to the baseline of the BOLD signal of the voxels belonging to a given ROI. A regional comparison of activation was then performed by means of a repeated‐measures analysis of variance (ANOVA). The dependent variable of the ANOVA analysis was the relative variation of the BOLD signal between the stimulation and silent conditions; the factors were the experimental condition (Right, Left, Mixed) and the hemisphere (right and left).
The maximal extension of clusters of activation in the superior temporal gyrus along the anteroposterior direction was evaluated for each subject and compared across experimental conditions by means of a repeated‐measures ANOVA.
MEG Data Acquisition and Analysis
Auditory evoked fields were recorded using the whole head neuromagnetic system operating at the University of Chieti [Pizzella et al., 2001], developed in collaboration with ATB (Advanced Technologies Biomagnetics, Pescara, Italy). This system is located in a magnetically shielded room and is equipped with 165 SQUID magnetometers, 153 of which are placed over a helmet‐shaped surface with an interchannel spacing of about 3.2 cm, providing whole‐scalp coverage. The remaining 12 magnetometers are arranged in orthogonal triplets and can be used for the software rejection of background noise. The noise of the magnetometers is 5fT/√Hz.
In order to determine the position of the subject head with respect to the sensor, the magnetic field generated by four coils placed on the scalp was recorded before and after each measurement session. A coordinate system was defined by digitizing the subject head surface by means of a 3‐D digitizer (Polhemus, 3Space Fastrak). In order to coregister MEG and MRI data, spherical oil capsules were applied at anatomical landmarks before MRI data acquisition.
In the MEG experiment, only Mixed conditions were studied as the stimuli consisted of a random sequence of sounds coming from all five directions, according to an event‐related paradigm. As for fMRI, the need to employ nonmagnetic devices did not allow the use of standard sound stimulators in the MEG room. Therefore, the same apparatus previously used in the fMRI scanner was used, after the removal of the large headphone holder and by directly inserting the tube coming from the loudspeaker into the subjects' ears using a suitable adaptor. The overall magnetic noise of the stimulation apparatus was below the noise level of the sensor. A total of 500 stimuli was presented, with an interstimulus interval of 3.4 s. The auditory evoked magnetic fields were sampled at a 1 kHz rate and filtered between 0.16 Hz and 250 Hz. After artifact rejection, trials were averaged from −100 ms to +1400 ms relative to stimulus onset. Source analysis was performed using BESA (MEGIS software, Germany) multiple source analysis. The location of the bilateral N1m responses was estimated by fitting the averaged magnetic field data in the interval 50–200 ms, with a two ECD (equivalent current dipole) model source. MEG does not allow discriminating two closely located neural populations, due to its lack of spatial resolution. Therefore, possible activations in the superior temporal gyrus and in the supramarginal gyrus were investigated by adding two dipoles to the model based on the fMRI activation in these areas to fit the residual magnetic field, i.e., the measured magnetic field minus the magnetic field generated by the two N1m ECDs. The coordinates of these two ECDs were constrained in a cube with 6 mm sides, centered on the “center of mass” of the corresponding fMRI activations [on this method, see also Ahlfors et al., 1999]. The explained variance before and after the addition of each of the two ECDs were compared, and the new source model was accepted if the increase in variance was larger than zero.
RESULTS
fMRI: Group Analysis
The group analysis showed activation in the superior temporal gyrus, in Heschl's gyrus, and in the supramarginal gyrus (Table 1). The clusters of activation in the superior temporal gyrus and in supramarginal gyrus were larger in the Mixed condition than in the Left and Right conditions. The group activation maps during the three different conditions are shown in Figure 3. During the Mixed condition (upper), we observed two probability maxima in a large cluster of activation in the supratemporal region of the right hemisphere: a medial region, corresponding to the Heschl's gyrus, and a more lateral region corresponding to the posterior aspect of the superior temporal gyrus. The same regions were observed in the Right and Left conditions, but they had a smaller extension and were separated. In the Mixed condition the activation of the superior temporal gyrus extended caudally to a greater extent than in the other experimental conditions, reaching y = −49. The Mixed condition also activated the left Heschl's gyrus and the supramarginal gyrus. In the Right condition, two different activations were observed in the right supratemporal region, respectively located in the right Heschl's gyrus and in the posterior aspect of the superior temporal gyrus. Significant activation in the left hemisphere was observed only in the Heschl's gyrus. In the Left condition the same pattern of cortical activation condition was observed in the supratemporal region as in the Right condition. A first visual inspection suggested that all three conditions (Right, Left, and Mixed) activated the right more than the left hemisphere. Finally, the group statistical maps of activation, resulting from the contrast between the Mixed and Right conditions and between the Mixed and Left conditions, respectively, are shown in Figure 4. The result of this contrast is a significantly larger activation in the caudal aspect of the superior temporal gyrus in the Mixed condition.
Table I.
Regional activation in conventional Talairach space together with cluster size and maximal Z score
| Experimental conditions | Cerebral regions | Cluster size (in mm3) | x, y, z | Maximal Z score in cluster* |
|---|---|---|---|---|
| Mixed | R Heschl's gyrus | 2,400 | 32, −24, 7 | 8.39 |
| R posterior superior temporal gyrus | 1,744 | 58, −30, 11 | 11.18 | |
| L Heschl's gyrus | 1,194 | −41, −26, 7 | 8.52 | |
| R supramarginal gyrus | 348 | 52, −35, 30 | 6.39 | |
| Right | R Heschl's gyrus | 1,480 | 35, −28, 9 | 7.31 |
| R posterior superior temporal gyrus | 1,354 | 55, −27, 9 | 7.80 | |
| L Heschl's gyrus | 886 | −34, −29, 13 | 6.93 | |
| Left | R Heschl's gyrus | 2,245 | 44, −27, 8 | 7.22 |
| R posterior superior temporal gyrus | 1,171 | 57, −33, 9 | 9.99 | |
| L Heschl's gyrus | 767 | −34, −28, 7 | 6.45 | |
| Mixed vs. Right | R posterior superior temporal gyrus | 1,121 | 56, −40, 18 | 5.46 |
| L posterior superior temporal gyrus | 475 | −54, −39, 18 | 4.31 | |
| Mixed vs. Left | R posterior superior temporal gyrus | 949 | 56, −45, 18 | 3.85 |
| L posterior superior temporal gyrus | 1,977 | −57, −33, 9 | 4.06 |
P < 0.0001.
Figure 3.
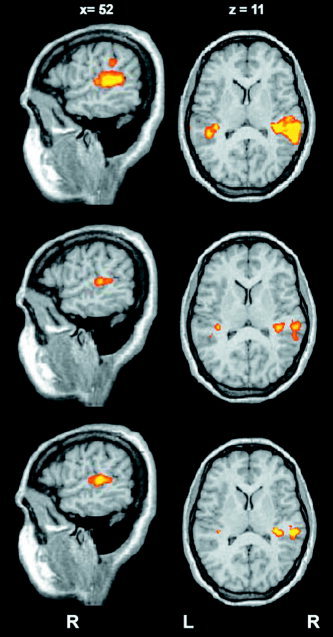
Results from the group analysis (P < 0.05, corr.): activated areas during auditory stimulation in the three conditions: Mixed (upper), Right (middle), and Left (lower). In the Mixed condition the bilateral Heschl's gyrus and right posterior superior temporal gyrus were activated and activation was greater than in the Left and Right conditions. The superior temporal gyrus activation extends caudally (y = −49). Activation in the supramarginal gyrus is present in this condition only. During both the Right and the Left conditions, bilateral auditory cortex (Heschl's gyrus) and the right posterior superior temporal gyrus were activated.
Figure 4.
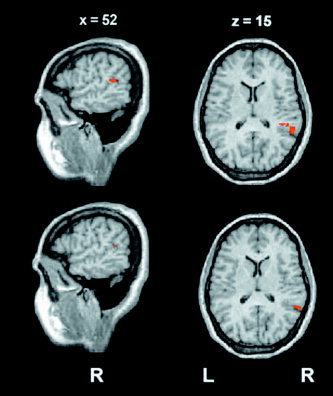
Results from the group analysis (P < 0.05, corr.). Areas with significant different activations in the contrasts between the Mixed and the Right conditions (upper), and between the Mixed and the Left conditions (lower). In both statistical maps a significant difference was observed in the posterior aspect of the superior temporal gyrus in the right hemisphere.
fMRI: Individual Subject Analysis
In all subjects activation in Heschl's gyrus was observed bilaterally and in the posterior aspect of the superior temporal gyrus bilaterally. For these regions, individual ROIs were defined as described in Subjects and Methods. The supramarginal gyrus was activated in 6 out of 11 subjects, but was observed in the group statistical map. This allowed us to define a ROI on the basis of group data.
A repeated‐measures ANOVA across subjects was performed in order to assess differences in activation in three cortical areas (superior temporal gyrus, Heschl's gyrus, and supramarginal gyrus) across the two hemispheres and the three experimental conditions (Left, Right, and Mixed). No significant differences were observed in Heschl's gyrus, neither across conditions nor across hemispheres. The caudal aspect of the superior temporal gyrus showed a larger relative variation of the fMRI signal in the right hemisphere compared to the left (P < 0.02) (Fig. 5a). In both hemispheres the relative variation of the fMRI signal of this region was significantly different (P < 0.02) across the three experimental conditions. Post‐hoc analysis (Tukey HSD test) in this region showed that the activation in the Mixed condition was stronger (larger relative signal variation) than in the Right (P < 0.02) and in the Left (P < 0.05) conditions (Fig. 5b).
Figure 5.
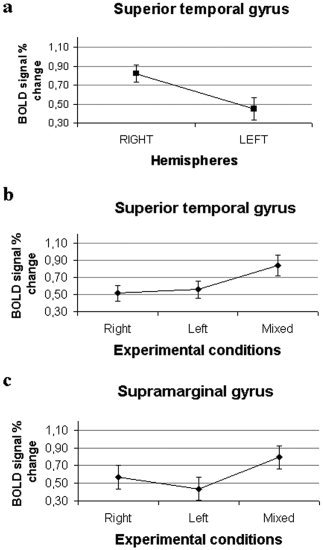
a: BOLD signal relative variation and standard error in the caudal superior temporal gyrus between the two hemispheres. ANOVA analysis shows a relative variation of fMRI signal, higher in the right hemisphere than in the left, with P < 0.02. b: BOLD signal relative variation and standard error in the same area between the three experimental conditions; the ANOVA shows a significant interaction (P < 0.02) between conditions. c: BOLD signal relative variation and standard error in the supramarginal gyrus between the three experimental conditions; ANOVA shows a significant interaction (P < 0.02).
Figure 5c shows the results of the statistical analysis for the activation in the supramarginal gyrus in both hemispheres: in this area the ANOVA analysis showed a significantly larger relative signal increase during the Mixed condition, with respect to the Left and Right conditions (P < 0.02). The post‐hoc analysis (Tukey HSD test) in this region showed the following results: Right vs. Mixed P < 0.02; Left vs. Mixed P < 0.02.
Additionally, a repeated‐measures ANOVA of the maximal extension of clusters of activation along the anteroposterior direction was performed between the experimental conditions (Fig. 6). A significant difference was found for the anteroposterior extension of the caudal superior temporal gyrus in the right hemisphere (P < 0.02); a post‐hoc Tukey HSD test showed that the anteroposterior extension was larger in the Mixed condition than in the Right (P < 0.05) or in the Left (P < 0.05) conditions.
Figure 6.
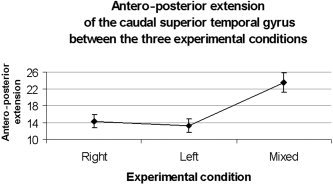
Antero‐posterior extension and standard error of the posterior aspect of the superior temporal gyrus in the right hemisphere between the three experimental conditions (P < 0.02).
Other Activated Cortical Areas
A widespread activation was also observed in the precentral (for four subjects in the Left condition and for seven subjects in the Mixed condition) and the postcentral (six subjects in the Left condition and three subjects in the Right and in the Mixed condition) gyri and in the inferior (three subjects in the Mixed condition) and the middle (four subjects in the Mixed condition) frontal regions. Since activation in these regions showed a large variability across subjects, their assignment to a common functional area was questionable. Therefore, further statistical analysis was not performed.
MEG
MEG data analysis aimed to investigate the time sequence of the activation of areas that had been significantly activated in the fMRI session. All nine subjects who underwent MEG investigation showed a bilateral dipolar distribution over the right and left temporal regions, peaking at about 140 ms after stimulus presentation. Source analysis, based on MEG data alone, disclosed bilateral ECD in Heschl's gyrus (N1), the location of which was consistent with the fMRI activation in Heschl's gyrus. Figure 7 shows the dipole locations for one subject. In all subjects the intensity of the N1 source in the right hemisphere was significantly stronger than the intensity of the corresponding one located in the left hemisphere (P < 0.05). The mean intensity of the N1m dipoles (Fig. 7a) was 60 nAm and 40 nAm for the right and left hemispheres, respectively, and the mean peak latency from stimulus onset was 139 ms. However, on average the variance explained by the two ECDs in Heschl's gyrus was only 82%. Therefore, in the right hemisphere two constrained ECDs were added in the caudal aspect of the superior temporal gyrus (CSTG) and in the supramarginal gyrus, respectively, at locations corresponding to the fMRI activation in the Mixed stimulation condition in these areas.
Figure 7.
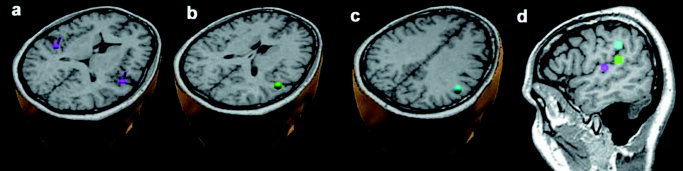
Subject 1. The four ECDs of the source model are superimposed on the individual structural MRI: (a) bilateral sources in the Heschl's gyrus; (b) one source in the caudal region of the superior temporal gyrus; (c) one source in the supramarginal gyrus. d: The three ECDs in the right hemisphere are shown in a sagittal view. The positions of the two ECDs in (b) and (c) were constrained in a cube with 6 mm side centered on the “center of mass” of the corresponding fMRI activation.
In six out of nine subjects the addition of the constrained ECD in the caudal aspect of the right superior temporal gyrus increased the explained variance to 89% on average. This increase is significant (P < 0.05), indicating that, in these subjects, an ECD in this specific location substantially improved goodness of fit. With the second constrained ECD in the supramarginal gyrus the explained variance increased to 94% on average (P < 0.03). Thus, the total average increase in the explained variance was 12% with respect to the model with only two dipole sources in bilateral N1. In the remaining three subjects the addition of the constrained ECDs in the CSTG and in the supramarginal gyrus did not increase the variance explained. As a consequence, these subjects were not considered in further analyses. The amplitude time course of the ECDs in the CSTG and in the supramarginal gyrus were analyzed in the former six subjects. The observed mean strength of the CSTG source was 43 nAm and the mean peak latency was 156 ms from the stimulus onset. The CSTG source for Subject 1 is shown in Figure 7b. The mean strength of the ECD in the right supramarginal gyrus, shown in Figure 7c, was 29 nAm and the mean peak latency was 162 ms. Note that the mean peak latency of the dipoles constrained in the caudal region of the right superior temporal gyrus (CSTG source) and in the supramarginal gyrus were 156 ms and 162 ms, respectively, 17 ms and 23 ms longer than the peak latencies of the response in Heschl's gyrus (N1 source).
Figure 8a indicates the time courses of the three dipoles (N1, CSTG, supramarginal gyrus) in the right hemisphere for a representative subject. A one‐way repeated‐measures ANOVA was performed on the peak latencies and confirmed the statistical significance of these differences (P < 0.02). The post‐hoc test indicates that the latency of the right N1 (mean value 138.5 ms) was significantly smaller (P < 0.02) than the latency of the right supramarginal gyrus (mean value 161.6 ms). The latency of the right CSTG (mean value 155.7 ms) tended to be larger than the right N1 (P = 0.06). The comparison between the latencies of the right CSTG and the right supramarginal gyrus was not significant. Figure 8b illustrates the mean latencies of the three sources.
Figure 8.
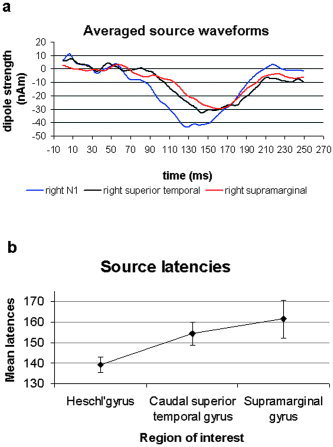
a: Averaged source waveforms for the group of right N1, right CSTG, and right supramarginal gyrus activation. b: Mean latencies and standard error of the three sources. The ANOVA revealed a statistical difference between the latencies of the three sources, with P < 0.02 and the following post‐hoc test results: right N1 vs. right supramarginal gyrus P < 0.02; right CSTG vs. right supramarginal gyrus and right N1 vs. right CSTG were not significant.
DISCUSSION
Evidence from single‐unit studies in nonhuman primates and neuroimaging studies suggests that specific cortical processing of auditory space takes place independently from cortical processing of auditory patterns. However, the specific spatiotemporal dynamics of brain activity during sound localization processing still needs to be clearly determined. Our results suggest that the auditory space is processed in a posterior pathway that includes different areas in the parietal and temporal lobes. In relation to the parietal cortex, our results show the specific involvement of the supramarginal gyrus of the inferior parietal cortex, mainly in the right hemisphere. The fMRI data show that this region is more strongly activated during the Mixed condition than during the Left and Right conditions. This observation suggests an involvement of the inferior parietal lobule during the processing of different sound locations compared to the processing of sounds at a fixed location. In six out of nine subjects the MEG results confirmed the involvement of the inferior parietal lobule in sound localization. The lack of activation in some of the subjects could be due to the orientation of the supramarginal gyrus: the source of the MEG signal in this area may have a radial orientation and thus be magnetically silent. The inferior parietal cortex activation in the right hemisphere is in agreement with several studies [Weeks et al., 1999] that suggest that this area of the parietal cortex is more active during auditory spatial processing than during frequency discrimination. The activation in the inferior parietal lobule during the auditory processing in space is consistent with results from studies of visuospatial processing [Jonides et al., 1993].
The fMRI results show two distinct areas of activation in the right supratemporal region, corresponding respectively to the Heschl's gyrus and the posterior aspect of the superior temporal gyrus. In the left hemisphere only the Heschl's gyrus was activated. In all experimental conditions larger activation was found in the right supratemporal region with respect to the left one. During the Mixed condition the activation of the right superior temporal gyrus extended more caudally, compared to the stimulation from fixed positions (Right and Left conditions). A posterior activation of the superior temporal cortex during sound localization has also been suggested in an fMRI/ERP study [Alain et al., 2001]. Those authors suggest that sound localization specifically activates posterior temporal areas, parietal cortex, and dorsal frontal regions. In their nonhuman primates study, Rauschecker and Tian [2000] concluded that the caudal part of the superior temporal gyrus of the rhesus monkey can be considered the origin of a dorsal stream for auditory processing. They suggest a “where” auditory spatial processing pathway that leads up from the primary auditory cortex in Heschl's gyrus to the inferior parietal cortex, through the caudal belt and parabelt in the superior temporal gyrus. Since the role of the caudal region of the superior temporal gyrus in sound localization is still debated, we checked the temporal dynamics of the responses observed in this area during the passive listening of sounds, delivered from different locations. The fMRI results, supported by MEG data on the latencies of activations, confirm the involvement of this region during sound localization processing, and suggest that the information is first processed in the Heschl's gyrus (N1), and then proceeds from this area to the superior temporal gyrus and to the supramarginal gyrus.
The fMRI results confirm an activation path moving from the Heschl's gyrus to the caudal portion of the superior temporal gyrus and to the supramarginal gyrus, as in the “where” auditory system described by several authors [Alain et al., 2001; Zatorre et al., 2002b; Maeder et al., 2001]. The results from the present study suggest the involvement of the caudal aspect of the superior temporal gyrus in a “where” auditory pathway, in terms of a specific processing stream for sound localization.
Considering lateralization, the findings show that both cortical hemispheres are sensitive to sound localization, but there is an asymmetry between the hemispheres. According to the data, the right hemisphere has a more significant role than the left one for auditory spatial processing. In the fMRI study a larger activation was observed in the posterior aspect of the superior temporal gyrus in the right compared to the left hemisphere. Statistical comparison in individual subjects confirmed this difference between the left and right hemispheres, with a larger relative signal increase in the right hemisphere. This result is consistent with the commonly accepted view of the functional division between the hemispheres: that is, the language processing specialization of the left hemisphere and the importance of the right hemisphere in analyzing spatial and spatiotemporal information [Gazzaniga, 1998]. Previous studies [Palomäki et al., 2002; Altman et al., 1979] emphasized the importance of the right hemisphere, as suggested by the larger amplitude of the N1m responses (in the right hemisphere). The asymmetry between hemispheres, in favor of the right one, is confirmed by the MEG data indicating a stronger source intensity of the right N1m when compared to the left N1m.
CONCLUSIONS
This study was primarily designed to investigate whether the localization of natural sounds coming from different sources generates different signal intensity in the involved brain areas. fMRI showed an activation in the Heschl's gyrus in the more caudal aspect of the superior temporal gyrus, in the supramarginal gyrus, and, unevenly, among subjects in the frontal lobe. The activation of the Heschl's gyrus, the caudal superior temporal gyrus, and the supramarginal gyrus is an fMRI result confirmed by those MEG assessments showing an activation moving from the Heschl's gyrus to the supramarginal gyrus through the superior temporal gyrus. The observed activation delineates a pathway similar to the one described as the “where” system in macaque monkeys, involving the sequential activation of the Heschl's gyrus, superior temporal gyrus, and, finally, of the inferior parietal lobule and the supramarginal gyrus.
Finally, in relation to a possible greater involvement of the right hemisphere in a localization task, the above‐described findings show that both cortical hemispheres are sensitive to sound location; however, there is an asymmetry, the right hemisphere being more activated than the left one in auditory localization.
Acknowledgements
We thank Dr. Giovanni Brambilla, Institute of Acoustics “O. M. Corbino” of the National Council of Research, for the stimuli recordings in the anechoic room. We also thank Prof. Maurizio Bonori, Department of Physics, University of Rome “La Sapienza,” for his invaluable suggestions about the method of virtual sound environment generation. Finally, we thank Dr. Angela Tagini for editing the manuscript.
REFERENCES
- Ahlfors SP, Simpson GV, Dale AM, Belliveau JW, Liu AK, Korvenoja A, Virtanen J, Huotilainen M, Tootell RB, Aronen HJ, Ilmoniemi RJ (1999): Spatiotemporal activity of a cortical network for processing visual motion revealed by MEG and fMRI. J Neurophysiol 82: 2545–2555. [DOI] [PubMed] [Google Scholar]
- Alain C, Arnott SR, Hevenor S, Graham S, Grady CL (2001): “What” and “where” in the human auditory system. Proc Natl Acad Sci U S A 98: 12301–12306. [DOI] [PMC free article] [PubMed] [Google Scholar]
- Altman J, Balanov L, Delgin V (1979): Effects of unilateral disorder of the brain hemisphere function in man on directional hearing. Neuropsychologica 17: 295–310. [DOI] [PubMed] [Google Scholar]
- Andersen RA (1995): Encoding of intention and spatial location in the posterior parietal cortex. Cereb Cortex 5: 457–469. [DOI] [PubMed] [Google Scholar]
- Arnott SR, Binns MA, Grady CL, Alain C (2004): Assessing the auditory dual‐pathway model in humans. Neuroimage 22: 401–408. [DOI] [PubMed] [Google Scholar]
- Bushara KO, Weeks RA, Ishii K, Catalan MJ, Tian B, Rauschecker JP, Hallett M (1999): Modality‐specific frontal and parietal areas for auditory and visual spatial localization in humans. Nat Neurosci 2: 759–766. [DOI] [PubMed] [Google Scholar]
- Clarke S, Bellmann A, Meuli RA, Assal G, Steck AJ (2000): Auditory agnosia and auditory spatial deficits following left hemispheric lesions: evidence for distinct processing pathways. Neuropsychologia 38: 797–807. [DOI] [PubMed] [Google Scholar]
- Cox RW (1996): AFNI: software for analysis and visualization of functional magnetic resonance neuroimages. Comput Biomed Res 29: 162–173. [DOI] [PubMed] [Google Scholar]
- Forman SD, Cohen JD, Fitzgerald M, Eddy WF, Mintun MA, Noll DC (1995): Improved assessment of significant activation in functional magnetic resonance imaging (fMRI): use of a cluster‐size threshold. Magn Reson Med 33: 636–647. [DOI] [PubMed] [Google Scholar]
- Gazzaniga MS, Ivry RB, Mangun GR (1998): Cognitive neuroscience: the biology of the mind. New York: W.W. Norton. [Google Scholar]
- Griffiths TD, Rees G, Rees A, Green GGR, Witton C, Rowe D, Büchel C, Turner R, Frackowiak RSJ (1998): Right parietal cortex is involved in the perception of sound movement in humans. Nat Neurosci 1: 74–79. [DOI] [PubMed] [Google Scholar]
- Griffiths TD, Green GGR, Rees A, Rees G (2000): Human brain areas involved in the analysis of auditory movement. Hum Brain Mapp 9: 72–80. [DOI] [PMC free article] [PubMed] [Google Scholar]
- Hall DA, Haggard MP, Akeroyd MA, Palmer AR, Summerfield AQ, Elliot MR, Gurney EM, Bowtell RW (1999): Sparse temporal sampling in auditory fMRI. Hum Brain Mapp 7: 213–223. [DOI] [PMC free article] [PubMed] [Google Scholar]
- Hart HC, Palmer AR, Hall DA (2004): Different areas of human non‐primary auditory cortex are activated by sounds with spatial and nonspatial properties. Hum Brain Mapp 21: 178–190. [DOI] [PMC free article] [PubMed] [Google Scholar]
- Jenkins W, Merzenich M (1984): Role of the cat primary auditory cortex for sound‐localization behavior. J Neurophysiol 52: 819–847. [DOI] [PubMed] [Google Scholar]
- Jonides J, Smith EE, Koeppe RA, Awh E, Minoshima S, Mintun MA (1993): Uniqueness of abrupt visual onset in capturing attention. Nature 363: 623–625. [DOI] [PubMed] [Google Scholar]
- Kaas JH, Hackett TA (2000): Subdivision of auditory cortex and processing streams in primates. Proc Natl Acad Sci U S A 97: 11793–11799. [DOI] [PMC free article] [PubMed] [Google Scholar]
- Kaiser J, Lutzenberger W (2001): Location changes enhance hemispheric asymmetry of magnetic fields evoked by lateralized sounds in humans. Neurosci Lett 314: 17–20. [DOI] [PubMed] [Google Scholar]
- Kaiser J, Lutzenberger W, Preissl H, Ackermann H, Birbaumer N (2000): Right‐hemisphere dominance for the processing of sound‐source lateralization. J Neurosci 20: 6631–6639. [DOI] [PMC free article] [PubMed] [Google Scholar]
- Maeder PP, Meuli RA, Adriani M, Bellmann A, Fornari E, Thiran JP, Pittet A, Clarke S (2001): Distinct pathways involved in sound recognition and localization: a human fMRI study. Neuroimage 14: 802–816. [DOI] [PubMed] [Google Scholar]
- Nolte J (1998): A human brain. An introduction to its functional anatomy. New York: C.V. Mosby. [Google Scholar]
- Oldfield RC (1971): The assessment and analysis of handedness: The Edinburgh Inventory. Neuropsychologia 9: 97–113. [DOI] [PubMed] [Google Scholar]
- Palomäki KJ, Tiitinen H, Mäkinen V, May P, Alku P (2002): Cortical processing of speech sounds and their analogues in a spatial auditory environment. Cogn Brain Res 14: 294–299. [DOI] [PubMed] [Google Scholar]
- Pizzella V, Della Penna S, Del Gratta C, Romani GL (2001): SQUID systems for biomagnetic imaging. Supercond Sci Technol 14: R79–R114. [Google Scholar]
- Rauschecker JP, Tian B (2000): Mechanisms and streams for processing of “what” and “where” in auditory cortex. Proc Natl Acad Sci U S A 97: 11800–11806. [DOI] [PMC free article] [PubMed] [Google Scholar]
- Talairach J, Tournoux P (1988): Co‐planar stereotaxic atlas of the human brain. New York: Thieme. [Google Scholar]
- Thiran AB, Clarke S (2003): Preserved use of spatial cues for sound segregation in a acase of spatial deafness. Neuropsychologia 41: 1254–1261. [DOI] [PubMed] [Google Scholar]
- Weeks RA, Aziz‐Sultan A, Bushara KO, Tian B, Wessinger CM, Dang N, Rauschecker JP, Hallett M (1999): A PET study of human auditory spatial processing. Neurosci Lett 262: 155–158. [DOI] [PubMed] [Google Scholar]
- Woldorff MG, Tempelmann C, Fell J, Tegeler C, Gaschler‐Markefski B, Hinrichs H, Heinze HJ, Scheich H (1999): Lateralized auditory spatial perception and the contralaterality of cortical processing as studied with functional magnetic resonance imaging and magnetoencephalografy. Hum Brain Mapp 7: 49–66. [DOI] [PMC free article] [PubMed] [Google Scholar]
- Zatorre RJ, Penhune VB (2001): Spatial localization after excision of human auditory cortex. J Neurosci 21: 6321–6328. [DOI] [PMC free article] [PubMed] [Google Scholar]
- Zatorre RJ, Belin P, Penhune VB (2002a): Structure and function of auditory cortex: music and speech. Trends Cogn Sci 6: 37–46. [DOI] [PubMed] [Google Scholar]
- Zatorre RJ, Bouffard M, Ahad P, Belin P (2002b): Where is ‘where’ in the human auditory cortex? Nat Neurosci 5: 905–909. [DOI] [PubMed] [Google Scholar]