

Abstract
Human vision is an active process that involves shifting attention across the visual scene, with or without moving the eyes. Such shifts of attention can be generated at will (endogenously) or be triggered automatically, i.e., generated in response to exogenous stimuli including socially relevant cues such as someone else's gaze. What are the common and distinct brain mechanisms involved in these processes? To address this question, we carried out a quantitative effect‐location meta‐analysis of 59 brain‐imaging experiments whose results were published using standardized coordinates. For each condition of interest, namely voluntary and visually triggered eye movements, voluntary and visually triggered (covert) shifts of attention, and perception of someone else's gaze, we computed activation likelihood estimation (ALE) maps. Those maps represent at each voxel of the brain the probability of reporting a signal change related to the condition of interest. For eye movements, this analysis confirmed the spatial location of the frontal eye fields, supplementary eye fields, and parietal saccade‐related regions. The map of covert shifts of attention demonstrated highest similarity with the map of saccadic eye movements. Gaze perception showed common activation likelihood with the other conditions in the right intraparietal sulcus and in the lateral precentral gyrus. It demonstrated more similarity with the reflexive than with the voluntary saccades and shifts of attention. We propose that a core network of frontoparietal and temporal brain regions is recruited when we shift the focus of our attention with or without eye movements in response to the appearance of a visual target, as well as when we see someone else shift his or her gaze. Hum Brain Mapp 25:140–154, 2005. © 2005 Wiley‐Liss, Inc.
Keywords: vision, shifts of attention, gaze perception, eye movements, meta‐analysis, ALE, activation likelihood estimation
INTRODUCTION
The goal of this study is to use quantitative effect–location meta‐analysis to provide a synthesis of brain‐imaging results regarding the following three aspects of spatial exploration: (1) the control of eye movements; (2) the control of spatial attention; and (3) the displacement of attention triggered by other people's gaze.
To explore the visual world, we make a succession of rapid eye movements, called saccades, which bring each object of interest successively on the fovea where high‐accuracy vision can occur. The neural substrate of saccade control has been investigated for more than a century by observing perturbations of various aspects of the oculomotor behavior after lesions in the parietal or frontal lobe [Leigh and Zee,1999]. Over the past 20 years, functional brain imaging has accumulated a wealth of data about the exact location in healthy subjects of cortical regions engaged during the performance of various oculomotor tasks. We sought to provide a quantitative synthesis of the relevant results.
Positron emission tomography (PET) and functional magnetic resonance imaging (fMRI) reveal brain regions showing a response to a given task in comparison to a control condition. Normalization of each individual brain image to a template in a standard space allows the authors to identify each point in the brain by three coordinates. Within‐study group averages as well as comparisons between studies therefore are possible within this common frame of reference.
Previous meta‐analyses of brain‐imaging studies of eye movements tabulated the published coordinates and assessed the dispersion of the reported loci of activation. Paus [1996] reviewed eight PET studies that employed eye movement tasks. He focused his interest on the frontal eye‐field, the main cortical region involved in eye movements, and plotted on a brain template the reported 3‐D coordinates of the group‐averaged maximal blood‐flow increase associated with eye movements. A tight clustering in the rostrocaudal and dorsoventral axis could be observed, whereas the results were much more spread on the mediolateral direction. Grosbras et al. [2003] carried out a similar analysis for the parietal oculomotor region, reviewing 26 brain‐imaging studies of eye movements. They observed that the reported maxima of signal change were dispersed in the superior parietal cortex, but seemed to cluster in three relatively focused regions. The above reviews did not carry out any statistical evaluation of the results concordance across the individual studies and did not assess thoroughly whether any task parameter could account for the dispersion of the foci.
One can hypothesize that the dispersion of the maxima reflects the recruitment of different brain regions for different processes. Evidence from psychophysical and neurophysiological studies in nonhuman primates suggests that there exists a dichotomy in terms of processes and neural substrates involved for voluntary saccadic eye movements and those that are triggered by the sudden appearance of a visual stimulus. One early PET study found no difference in the frontal and supplementary eye fields for saccades made toward a flashed visual target and saccades made toward a fixed target in response to an auditory cue [Fox et al.,1985], although no direct comparison was carried out. Two other PET studies found greater blood‐flow in the three cortical eye fields (frontal, supplementary, and parietal) for saccades made in response to an instructional cue toward the remembered location of a target than for visually triggered saccades [Anderson et al.,1994; Sweeney et al.,1996]. More recently, Brown et al. [2004] replicated this finding with block‐design fMRI, but found a difference only in the right frontal and right parietal cortices when using an event‐related design. The present quantitative meta‐analysis of the numerous studies of visually triggered and voluntary‐triggered saccadic eye movements can reveal whether some regions are involved more consistently for one type of saccades than for the other.
The second question we want to address with this meta‐analysis relates to the differences in the networks recruited for shifting the eyes and for shifting attention. It has long been known that humans can examine visual objects without actually moving the eyes directly toward them, but simply by redirecting their attention. It has been proposed that these “covert” shifts of attention rely on similar mechanisms as eye movements do. The premotor theory of attention postulates that covert shifts of attention are saccades that are planned but not executed [Rizzolatti et al.,1987]. Brain‐imaging studies have provided evidence that some cortical and subcortical regions are involved in both saccadic eye movements and covert shifts of attention. In a previous meta‐analysis, Corbetta and Shulman [1998] extracted the reported maxima of signal change from six PET studies of covert shifts of attention and eight PET studies of saccadic eye movements. They displayed each set of coordinates as a 10‐mm radius sphere on 3‐D brain template to compare the location of attention‐related and oculomotor‐related regions. They found some overlap but also some differences in the frontal and parietal lobes. The same authors used fMRI to compare directly in individuals the locations of fMRI signal increase during covert shifts of attention and voluntary saccadic eye movements. In this case, they observed greater similarity between the two tasks in the frontal eye field, supplementary eye field, parietal cortex, and temporal cortex. They argue that the differences observed in their previous meta‐analysis were most probably related to “anatomical variability or variability in the standardization procedures used to analyze group data.” Two subsequent event‐related fMRI studies directly comparing saccades and covert shifts of attention also reported an overlap between the two recruited networks, but one showed higher response for eye movements [Beauchamp et al.,2001] whereas the other showed higher response for covert shifts of attention [Perry and Zeki,2000]. An objective synthesis across all brain‐imaging studies that have investigated eye movements and attention is needed to provide a clear picture of the overlapping and distinct neural substrates for the two processes. Such quantitative meta‐analysis could reveal the brain regions that are recruited consistently for shifting spatial attention, regardless of variability in task parameters and requirements in individual studies. Because we will do the same for saccadic eye movements, a comparison of the covert attention and saccadic eye movements will be possible at a supra‐study level.
In addition, as for saccadic eye movements, an important question concerns the difference between processes involved in voluntary (endogenous) shifts of attention where the observer builds himself an expectancy about where a target will appear (e.g., based on the direction of an arrow), and the processes involved in exogenous shifts of attention triggered by a salient external stimulus occurring at the location where the target will appear. An extensive body of psychophysical literature has demonstrated that the voluntary orienting is slower to emerge but lasts longer than the exogenous orienting does [Posner and Cohen, 1984]. Brain‐imaging studies have used both kinds of covert shifts of attention, sometimes directly comparing the two. A meta‐analysis is a useful tool to summarize objectively the results of all those studies.
The last topic we wish to study with the statistical effect‐location meta‐analysis concerns the perception of others' eye‐movements. Indeed, eye movements are not only important for orienting ourselves in space; they are also fundamental for interacting with other people. In particular, the direction of a person's gaze indicates the focus of his or her interest and possibly his or her intentions. Joint attention refers to the mechanisms that allow us to judge first where other people are attending and then to shift our own attention to the same location or object. Surprisingly, most research on spatial attention has used salient but socially irrelevant cues to trigger the shifts of attention (e.g., color flashes or arrows). A few psychophysics experiments have demonstrated that a face with averted gaze triggers an automatic shift of attention even if it is detrimental to the task [Hietanen,1999; Langton et al.,2000; Ricciardelli et al.,2002]. Within the emerging field of social cognitive neuroscience [Blakemore et al.,2004], recent neuroimaging studies have addressed the question of specific neural networks involved when human observers watch displacements of others' gaze. Most studies were planned in the broader context of research on face perception. Our goal here is to provide a synthesis of the brain networks identified by brain‐imaging studies of gaze perception and compare them to the networks involved in shifting attention and moving the eyes. Because the studies on gaze perception are much less numerous than are those for eye movements and covert shifts of attention, the present meta‐analysis will provide mainly preliminary information with the potential to guide future experiments.
MATERIALS AND METHODS
Meta‐Analysis Methodology
Meta‐analyses included in this review have been carried out using the activation‐likelihood estimation (ALE) method [Turkeltaub et al.,2002]. This method is described in greater detail elsewhere in this issue [Laird et al.,2005]; therefore, we only outline its main features. ALE has been developed to perform meta‐analyses of brain‐imaging experiments that report results in the form of 3‐D stereotaxic coordinates. Activation refers to a difference, between two conditions, either in cerebral blood‐flow, (CBF; with PET) or in blood oxygenation level‐dependent (BOLD) signal (with fMRI). An experiment refers to a comparison (statistical contrast) between one condition of interest and a control condition. A focus of activation corresponds to the coordinates where the CBF/BOLD difference was statistically most significant, as reported in the publication. To perform ALE, the coordinates of the foci of activation reported by a series of studies are gathered. Each focus is modeled as the center of a Gaussian distribution, and then all the Gaussian distributions are summed across a set of similar experiments to generate a whole‐brain map of interstudy consistencies. This map represents at each voxel the likelihood that at least one experiment yielded a statistically significant difference between the conditions tested. To make statistical inferences about the ALE results, the ALE values are compared to those obtained by a random set of foci; therefore, one can apply significance threshold to the ALE maps.
The ALE method thus allows us to compute the pattern of brain activity for a given task taking into account the concordance between several independent experiments. Furthermore, this method allows the comparison of several tasks at a large‐scale level by overlaying the resulting ALE maps.
Selection of Studies for the Meta‐Analysis
We were interested in three topics: eye movements, covert shifts of attention, and gaze perception. Positron‐emission studies and functional brain‐imaging studies related to these topics published over the past 20 years were selected from a personal database as well as from Medline. To be included in the meta‐analysis, a study had to describe clearly the methodology used and to report 3‐D stereotaxic coordinates. Some studies did not report results from whole‐brain analysis, either because of the field of view of the scanning or because a region of interest approach was chosen. We nevertheless included those studies as long as the main frontoparietal oculomotor areas and the temporal cortex were part of the analysis. For the gaze perception, all published studies reporting coordinates were included.
For the eye‐movement paradigms, we restricted our analysis to saccadic eye movements, leaving aside studies of pursuit eye movements. In addition, the experiments that involved antisaccades, requiring observers to make a saccade in the direction opposite to that of a flashed target, were not included because this task engages additional cognitive processing that we did not want to consider in the present study. This resulted in 29 studies and 33 experiments. Probabilistic maps were generated for all of these studies together (all saccades). The experiments were divided further into two categories for separate analyses. The voluntary‐triggered saccades (15 experiments) consisted of saccades generated endogenously, either in darkness or toward fixed visual or memorized targets. The visually triggered saccades (18 experiments) were made toward a flashed visual target. Table I presents further details.
Table I.
Summary of the articles selected for the analysis of reports on saccadic eye movements and covert shifts of attention
| Reference | Modality | n | Control* | Comments |
|---|---|---|---|---|
| Visually triggered saccades | ||||
| Anderson et al.,1994 | PET | 8 | Rest | |
| Astafiev et al.,2003 | fMRI 1.5T | 11 | Fixation | Predictable targets |
| Berman et al.,1999 | fMRI 3T | 11 | Fixation | |
| Connolly et al.,2000 | fMRI 4T | 7 | Fixation | |
| Gagnon et al.,2002 | fMRI 1.5T | 7 | Fixation | |
| Heide et al.,2001 | fMRI 1.5T | 6 | Fixation | |
| Kawashima et al.,1998 | PET | 9 | Fixation | |
| Kimmig et al.,2001 | ER fMRI 1.5T | 15 | Fixation | |
| Konen et al.,2004 | fMRI 1.5T | 11 | Fixation | Predictable targets |
| Koyama et al.,2004 | fMRI 1.5T | 20 | Fixation | |
| Law et al.,1997 | PET | 9 | Fixation | |
| Luna, et al.,1998 | fMRI 1.5T | 10 | Fixation | |
| Matsuda et al.,2004 | fMRI 1.5T | 21 | Fixation | |
| Merriam, et al.,2001 | fMRI 1.5T | 11 | Fixation | |
| Nobre et al.,2000 | fMRI 1.5T | 4 | Fixation | |
| Paus, et al.,1993 | PET | 8 | Star flashed centrally | |
| Petit et al.,1999 | fMRI | 5 | Fixation | |
| Thulborn et al.,2000 | fMRI 1.5T | 10 | Fixation | |
| Voluntary‐triggered saccades | ||||
| In darkness/rest | ||||
| Dejardin et al., 1998 | PET | 6 | Rest | Self‐paced |
| Fox et al.,1985 | PET | 9 | Rest | Auditory‐cued |
| Law et al., 1998 | PET | 7 | Rest | Self‐paced |
| Paus et al.,1995 | PET | 9 | Rest | Auditory‐cued |
| Petit et al.,1996 | PET | 5 | Rest | Self‐paced |
| Toward fixed visual targets | ||||
| Corbetta et al.,1998 | fMRI 1.5T | 6 | Fixation with array of targets present | Sequential shifts from one target to the next |
| Grosbras et al.,2001 | fMRI 3T | 9 | Fixation with array of targets present | Remembered 5‐step sequence |
| Mort et al.,2003 | fMRI 1.5T | 12 | Reflexive saccades | Centrally cued |
| Paus et al.,1993 | 8 | Rest with eyes closed | Centrally‐cued | |
| Perry and Zeki,2000 | ER fMRI 2T | 7 | Targets without saccade | Centrally cued |
| Toward remembered targets/fixation | ||||
| Anderson et al.,1994 | PET | 8 | Fixation | |
| O'Sullivan et al.,1995 | PET | 8 | Rest | |
| Sweeney et al.,1996 | PET | 11 | Reflexive saccades | |
| Sequences toward remembered targets | ||||
| Heide et al.,2001 | fMRI 1.5T | 6 | Fixation | 3‐Step sequence |
| Petit et al.,1996 | PET | 5 | Rest | 5‐Step sequence |
| Visually triggered shifts of attention | ||||
| Beauchamp et al.,2001 | fMRI 1.5T | 9 | Stationary target | Internal monitoring of the number of targets |
| Nobre et al.,2000 | fMRI 1.5T | 4 | Fixation | |
| Peelen et al.,2004 | fMRI | 19 | Central presentation of the target | Pool endogenous and exogenousa |
| Perry and Zeki,2000 | fMRI 1.5T | 7 | Cue but no shift of attention required | |
| Simon, et al.,2002 | fMRI 1.5T | 10 | Central attention (detect a change of central cue) | Manual response to the target |
| Vanderberghe et al.,2001 | fMRI 1.5T | 12 | Maintaining foveal attention | |
| Voluntary covert shifts of attention | ||||
| Astafiev et al.,2003 | fMRI 1.5T | 15 | Fixation | |
| Buchel et al.,1998 | fMRI 2T | 7 | Visual stimulation but non attended | |
| Corbetta et al.,1993 | PET | 24 | Fixation | Left hand manual response to the target |
| Corbetta et al.,1998 | fMRI 1.5T | 6 | No manual response | |
| Giesbrecht et al.,2003 | ER fMRI | 10 | Fixation | |
| Gitelmann et al.,1999 | fMRI 1.5T | 12 | Central attention (detect a change of central cue) | Central arrow, Manual response to the peripheral target |
| Hopfinger et al.,2000 | ER fMRI 1.5T | ? | Visual stimulation | |
| Kastner et al.,1999 | fMRI 1.5T | 5 | Visual stimulation but non attended | Internal monitoring of the number of targets |
| Kim et al.,1999 | fMRI 1.5T | 10 | Static display of cue and targets | |
| Rosen et al.,1999 | fMRI 1.5T | 13 | Neutral cue | Manual response to the target |
For fMRI studies, the magnetic field of the scanner is indicated in Teslas.
The rest control condition corresponds to the instruction of not moving, in darkness. The fixation control condition corresponds to the instruction of maintaining the center of gaze on a symbol (most often a cross) displayed in the center of the subject's field of view. For self‐paced voluntary saccades, the subjects were instructed to move the eyes at their own pace, whereas as for auditory‐cued saccades the subjects were instructed to move the eyes as soon as they heard an auditory signal. Centrally cued saccades were generated in response to and in the direction given by a visual symbol (most often an arrow) displayed in the center of the subject's field of view.
This study thus was included in all attention but not endogenous and exogenous.
n, number of subjects included in the analysis; ER fRMI, event‐related fMRI.
For covert shifts of attention, we analyzed 15 studies (16 experiments). As for the saccadic eye movements, we further subdivided the experiments in two categories. The voluntary‐triggered shifts of attention (10 experiments) consisted of shifts of attention toward fixed peripheral spatial locations in response to a symbolic cue (most often an arrow presented at the central fixation point). The visually triggered shifts of attention (five experiments) included the shifts of attention induced by a visual target flashed at the periphery. One study that had pooled the results from endogenous and exogenous conditions was included only in the all‐attention but not in the other analyses [Peelen et al.,2004]. Table I presents further details.
The gaze perception studies are more heterogeneous, and the questions they addressed varied. Only eight studies were retained. Four studies investigated the brain correlates of watching a face with eyes directed straight at the observer, comparing it with control stimuli or with faces with averted gaze. The remaining four studies investigated the neural basis of watching a face with averted gaze. Table II presents further details.
Table II.
Short description of the articles selected for the analysis of reports on gaze perception
| Reference | Modality | n | Stimuli | Task | Comments |
|---|---|---|---|---|---|
| Hooker2003 | fMRI1.5T | 10 | Animated faces with eye moving to fixate a target for 300 ms then back at the viewer (motion made with computer). | Detecting the target pointed by eye gaze, or arrow or arrow on a face. Control condition = eyes inward. | — |
| Kawashima1999 | PET | 8 | Videos of a female face angled by 25 degrees. | (1) Direct gaze condition: decide whether the person looks towards your head or trunk. Averted gaze condition: Decide whether the person looks toward the head or trunk of someone standing to one side of him or her. (3) Control: tell if the person blinks the right or left eye. | Manual response |
| George2001 | fMRI 3T | 8 | Color photographs of faces facing forward or rotated by 30 degrees with gaze direct or averted. | Passive viewing. | Reports gaze direct > averted. |
| Wicker1998 | PET | 10 | 5‐s movies of an actor moving his eyes either from the periphery to the center (mutual gaze) or between targets away from the camera (averted gaze). Control: the actor is looking at a piece of paper on the table, such that his eyes are not visible. | Passive viewing. | We included the report of mutual and averted gaze > control. Subjects were all male. |
| Garrett2004 | fMRI 1.5T | 15 | Static color photographs of faces facing forward or angled with direct or averted gaze | Passive viewing. Direct gaze compared to averted gaze. | Reports only regions showing a difference between control and patients with fragile X. |
| Kato2001 | fMRI 3T | 6 | Schematic eyes averted. Control: central cross. | Passive viewing. | — |
| Calder2002 | PET | 9 | Photos of faces with gaze either direct or averted. Increase proportion of averted. | Passive viewing | Subjects were older females. |
| Hoffman and Haxby,2000 | fMRI 1.5T | 9 | Static photographs of faces. Control: scrambled images. | Match two consecutive faces either for their identity or for the direction of their gaze. | We included regions engaged more in attention to gaze than in attention to identity. |
Coordinate Transformation and Map Generation
Among all studies we analyzed, the published coordinates were derived from normalization either to the Montreal Neurological Institute (MNI)‐305 template [Collins et al.,1994] or to the Talairach and Tournoux [1988] atlas template. To standardize the coordinates input into the analysis, all coordinates derived from normalization to the MNI space were transformed using a nonlinear transformation function from the MNI template to the Talairach template [Brett,1999]
The ALE maps were created as described by Turkeltaub et al. [2002] using a 10‐mm full‐width half‐maximum (FWHM) Gaussian function to model each coordinate. Statistical significance was determined using a permutation test of randomly distributed foci. We computed 5,000 permutations using the same FWHM value and the same number of foci used in computing the ALE values. The test was corrected for multiple comparisons using the false discovery rate (FDR) method [Genovese et al.,2002]. All data processing was carried out using an in‐house Java version of ALE developed at the University of Texas Research Imaging Center. To examine the probability of concordance in the whole brain, the maps were thresholded at P < 0.05 (corrected for multiple comparisons) and overlaid onto an anatomical template. This anatomical template was obtained by transforming a very high‐resolution T1‐weighted MRI [Holmes et al.,1998] to minimize the distance with every image of a set of 27 individual MRIs [Kochunov et al.,2002]. We used MRIcro software [Rorden and Brett,2000] to visualize and compare maps.
RESULTS
All anatomical references are given in relation to the anatomy of the optimized anatomical template [Turkeltaub et al.,2002] and to the Talairach and Tournoux [1988] atlas. A cluster refers to a set of at least eight voxels showing significant ALE.
All Saccades
The analysis was carried out on 385 foci. The ALE maps depicted the expected bilateral frontoparietal circuit. In the frontal lobe of both hemispheres, the highest concordance was located in the precentral sulcus of the anatomical template close to its intersection with the superior frontal sulcus. Reading the coordinates in the Talairach and Tournoux [1988] atlas showed also the same anatomical landmark. The cluster of activation likelihood occupied a large portion of the precentral sulcus and extended laterally and ventrally on the surface of the precentral gyrus. Two subregions could be identified within the cluster: one centered on the maxima, and another more ventral and lateral (superior and inferior frontal eye‐field; Fig. 1, left panel). On the frontal medial wall, the highest concordance was located in the paracentral gyrus; the cluster extended rostrally in the region defined as pre‐supplementary motor area (pre‐SMA) [Picard and Strick,1996]. Activation was also observed in the cingulate/paracingulate sulcus bilaterally but separated from the SMA cluster only in the right hemisphere. In the parietal lobe, the highest concordance was observed in the main horizontal part of the intraparietal sulcus [Critchley,1957], and the cluster expanded in a large part of the sulcus, reaching the postcentral gyrus. The precuneus also showed high ALE values in both hemispheres. In the left hemisphere, an additional cluster could be observed more posteriorly in the superior parietal lobule.
Figure 1.
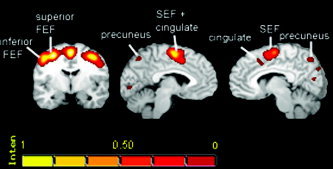
Results illustrating the location of the oculomotor regions, as evidenced on the all‐saccades map. The color scale represents percentages of the maximum ALE score (0.06 in this case) as explained in Turkeltaub et al. [2002]. The left image is a coronal view with the left hemisphere on the left. The middle image is a sagittal view of the left hemisphere and the right image is a sagittal view of the right hemisphere.
Additional likelihood clusters were observed in the right superior temporal gyrus in the right insula, as well as bilaterally in the calcarine fissure and in the inferior occipital gyrus.
Subcortically, the lentiform nucleus and pulvinar nucleus of the thalamus showed high ALE bilaterally.
Voluntary Saccades Versus Visually Triggered Saccades
When we overlaid the maps generated separately for the voluntary‐triggered (152 foci) and visually triggered saccades (217 foci), we observed a great overlap in the precentral and medial wall regions (Fig. 2, first two rows in columns 1–3, i.e., z = 54, 50, and 46). The two maps also overlapped in the parietal cortex but reflexive saccades induced more extended activation in the intraparietal sulcus and only the voluntary saccades yielded a significant activation likelihood in the right posterior superior parietal lobule (Fig. 2, second row, column 3, z = 46). Clusters in the globus pallidus and pulvinar (Fig. 2, second row, columns 5 [z = 10] and 6 [z = 2]) were present only in the voluntary saccades map and not in the visually triggered saccades map. Clusters in the superior temporal gyrus, the inferior occipital gyrus, and posterior fusiform cortex were present only in the visually triggered saccades map and not in the voluntary saccades map.
Figure 2.
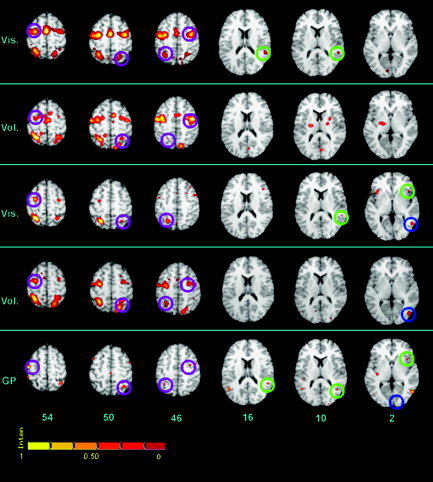
Synoptic representation of the five different maps : Vis. S, visually triggered saccades; Vol. S, voluntary‐triggered saccades; Vis. A, visually triggered covert shifts of attention; Vol. A, voluntary‐triggered shifts of attention; GP, gaze perception. Axial slices at different levels (z = 54, 50, 46, 16, 10, and 2 mm) are presented in each column in neurological convention (left hemisphere on the left). Purple circles, frontoparietal regions commonly present on all maps; blue circles, a region in the occipitotemporal cortex (close to the transverse occipital sulcus) common to the two attention and the gaze perception maps; green circles, a region in the temporoparietal cortex common to reflexive‐orienting and gaze‐perception maps, and a region in the anterior insular cortex common to reflexive‐attention and gaze‐perception maps. The color scale represents percentages of the maximum ALE score as explained in Turkeltaub et al. [2002].
Attention Versus Saccades
The attention map was generated from 212 foci. At first glance, it was highly similar to the all‐saccades map. In the frontal lobe, the precentral cluster was accompanied by an adjacent cluster in the superior frontal sulcus in the right hemisphere and in the middle frontal gyrus in the left hemisphere. In addition to the same right anterior cingulate cluster observed for the saccade condition, the attention condition also yielded another more anterior cluster. High concordance was observed in the insula bilaterally, whereas only the right insula showed significant ALE for saccades. No ALE cluster could be observed in the occipital cortex. Instead, we observed a cluster in the inferior temporal sulcus/middle temporal gyrus in both hemispheres. The ascending part of the superior temporal sulcus (STS) also showed activation in a similar site as for the saccades, but in both hemispheres. The lentiform nucleus cluster was located in a more rostral site than that for the saccades, falling into the putamen rather than the globus pallidus. Additional significant clusters were observed in the fusiform gyrus and the cerebellum.
Voluntary Attention Versus Visually Triggered Attention
Analysis of visually triggered attention included 78 foci and that of voluntary attention comprised 97 foci. Regions present only in the visually triggered but not in the voluntary shift‐of‐attention maps included the right ventral precentral cortex, left fusiform gyrus, bilateral insula, lentiform nucleus (putamen), and one site in the cerebellum. Regions present only in the voluntary attention map but not in the visually triggered attention map included a site in the right inferior frontal gyrus, the left dorsolateral prefrontal cortex, and a small site in the superior parietal lobule. In the middle temporal cortex, the cluster on the visually triggered attention map was located at the junction of the inferior occipital sulcus, a structural landmark for area MT/V5 [Watson et al.,1993], in both hemispheres. The middle temporal activation likelihood cluster on the voluntary attention map was located more posteriorly and mainly on the banks of the inferior temporal sulcus, again in both hemispheres.
Gaze Perception
The gaze‐perception ALE map was computed from 59 foci. The locations of clusters showing the highest concordance included the middle temporal gyrus/posterior superior temporal sulcus in both hemispheres, left anterior superior temporal sulcus, intraparietal sulcus/superior parietal lobule bilaterally, postcentral gyrus, left claustrum/insula, the posterior fusiform gyrus, and right inferior frontal gyrus. Two clusters could also be distinguished in the right precentral region, one in the superior precentral sulcus close to its junction with the superior frontal sulcus and one in the inferior branch of the precentral sulcus, close to its junction with the inferior frontal sulcus. In the left hemisphere, precentral activation likelihood was observed on the lateral surface of the precentral gyrus. On the medial wall, several small clusters were observed in the paracentral gyrus and in the cingulate and paracingulate sulcus in the right hemisphere.
When the gaze‐perception ALE map was overlaid on the saccade and attention maps, we observed by visual inspection an overlap between all the maps in the intraparietal sulcus bilaterally and in the right precentral gyrus. Overlap with the visually triggered saccade and visually triggered attention maps was observed in the right middle temporal gyrus, close to the ascending branch of the inferior temporal sulcus and the lateral occipital sulcus. Co‐localization of significant gaze‐perception ALE and significant attention ALE was observed in the right inferior temporal sulcus/posterior middle temporal gyrus (Fig. 1, column 6, z = 2). Common activation likelihood between gaze perception and visually triggered attention was observed in the left anterior insula (Fig. 1, column 6, z = 2) and the left middle frontal gyrus. Common activation likelihood between gaze perception, visually triggered saccades, and visually triggered shifts of attention was seen at the junction between the superior temporal gyrus and the inferior parietal lobule, in the bank of the ascending branch of the superior temporal sulcus in the right hemisphere (Fig. 1, column 5, z = 10). A similar region in the left hemisphere showed significant ALE only for gaze perception.
DISCUSSION
The present meta‐analysis is the first to provide quantitative estimation of the concordance across more than 40 studies related to eye movements and spatial attention. It demonstrates a highly significant concordance across reports that have involved a network of specific frontal, parietal, and temporal regions in eye movements and in covert shifts of attention. In addition, it suggests that gaze perception involves part of the network recruited for visually guided orienting.
Spatial Localization
The effect‐location meta‐analysis we carried out is based on the consensus method employed widely in the field of human brain imaging, namely localization of the signal change using 3‐D stereotaxic coordinates. A brief discussion of this issue is in order to enlighten the scope of the subsequent discussion.
Any averaged anatomical localization is limited by the processes of normalization applied to the images. Most authors in the brain‐imaging community carry out a linear spatial transformation of the individual images to register them to a common standard template, and then average the results obtained, typically in 5–15 subjects. The 3‐D coordinates of the location where the highest signal change is observed across the group of subjects are reported. This increases the signal‐to‐noise ratio of the brain‐imaging techniques, enables inferences at the level of the group of the subjects tested, and provides an objective description of the localization of the brain regions involved. However, the methods applied for spatial normalization are based on a few landmarks and may not faithfully preserve distance relationships at the level of local sulcal anatomy [Rademacher et al.,1993]. An anatomical landmark identified in individual brains therefore can have different stereotaxic coordinates after normalization [e.g., Grosbras et al.,1999]. These discrepancies, which reflect the variability in the sulcal anatomy in the human population, are not of the same magnitude across the whole brain. For instance, several studies reported higher variability in the central sulcus region of the dominant hemisphere compared to that in the nondominant hemisphere [Kochunov et al.,2002; Le Goualher et al.,2000; Zilles et al.,1997]. To define variability of various sulcal landmarks across the population, probabilistic maps of sulci and gyri of the human cerebral cortex have been generated [e.g., Paus et al.,1996]. To avoid the drawbacks of spatial normalization, many authors also report their results in relation to the sulcal and gyral anatomy of the individuals who participated in their studies. This has proven helpful to identify reliable anatomical landmarks for functional brain regions such as the hand motor area [Yousry et al.,1997], the motion sensitive area V5 [Watson et al.,1993], the frontal eye field [Lobel et al.,2001], and the supplementary eye field [Grosbras et al.,1999]. Carrying out meta‐analyses on this kind of report presents some inconveniences [Fox et al.,1998]. First, they are less numerous because individual function–anatomy systematic analyses are more tedious and anatomical landmarks can not be identified for every functional region (see for example the parietal oculomotor regions). Second, the anatomical evaluation and description of individual brain landmarks is always subjective, which makes quantitative meta‐analysis problematic.
The methodology employed in the present study at least partly overcomes the problems of structure–function mapping in three ways. First, the ALE method models each point in the stereotaxic space as a Gaussian distribution, accounting in part for the interindividual variability. Second, the results (i.e., the coordinates of the highest activation likelihood sites) are displayed on a high‐resolution brain template built so that it minimizes its differences with most individual brains [Kochunov et al.,2001]. Third, as in any meta‐analysis, the effects of irrelevant task parameters are minimized by combining many independent experiments. From this study, we thus are able to draw conclusions relative to the average localization of the brain areas of interest. The main advantage of this meta‐analysis is that it emphasizes the brain regions that are involved commonly in oculomotor control, attention, or gaze perception while reducing variability due to specific methods, tasks, and individual differences in functional anatomy. This method also enables reliable comparison of neuroanatomical structures involved in the different phenomena that we studied.
Saccadic Eye Movements
The present results confirm the localization of the major cortical oculomotor regions in human. The highest concordance across studies is found in the precentral sulcus, close to its junction with the superior frontal sulcus. This location has been described in a previous review [Paus,1996] as well as in individual brain‐imaging reports as an anatomical landmark for the frontal eye field [Lobel et al.,2001; Luna et al.,1998]. It also corresponds to the location with the highest probability of eliciting a saccade by intracranial stimulation [Lobel et al.,2001]. The coordinates of the ALE peaks were very close to the one we obtained previously by averaging the stereotaxic coordinates of a few earliest PET studies (present ALE analysis: −30, −8, 50 and 36, −8, 48; Paus' review [1996]: −32, −2, 46 and 31, −2, 47). This suggests that the junction between the precentral and the superior frontal sulcus is indeed a reliable anatomical landmark whose coordinates obtained by linear transformation might not vary much. It is also noteworthy how well the cluster of significant concordance across studies closely approximates the precentral sulcus of the optimized anatomical template. Furthermore, the observation of two clusters, one dorsomedial and another ventrolateral, confirms the results of our first meta‐analysis [Paus,1996] and continues to raise the question of its functional significance [Lobel et al.,2001]. Interestingly, by directly comparing fMRI results acquired in human and nonhuman primates, Koyama et al. [2004] suggest that the more dorsal and medial cluster probably corresponds to the proper frontal eye field, whereas the more ventral and lateral cluster might correspond to the oculomotor region embedded in the premotor cortex. Further insight will certainly be gained by across‐species comparisons.
On the medial wall, the maximum of concordance between studies lies close to the average location of the paracentral sulcus. This location has been described previously as an anatomical landmark for the supplementary eye field [Grosbras et al.,1999]. In the parietal cortex, the cluster of concordance extended in and around the intraparietal sulcus. The maximum of concordance, in both hemispheres, was located in a relatively dorsal and anterior part of the posterior parietal cortex. Those regions also showed high concordance when visually guided and voluntary saccades were analyzed separately. Although this meta‐analysis can not account for differences in the degree of recruitment, it suggests that the brain regions involved in visually triggered and voluntary triggered saccades do not differ in their location, at least not within the spatial resolution offered by the PET and fMRI techniques employed in the reviewed studies.
Our results revealed a few differences between the two types of saccades. Somewhat surprising was the fact that the intraparietal region showing significant concordance across studies of the visually triggered saccades was more extended than was the one delimited by the analysis of voluntary saccades. The amount of variability across the experimental designs employed in the two categories of studies would suggest the reverse. Indeed, studies of visually triggered saccades are relatively similar: subjects have to make eye movements toward visual targets flashed most times in a horizontal direction. The experimental paradigms used to study voluntary saccades are more varied. We included studies of self‐generated saccades in darkness, self‐generated saccades toward a visual target, saccades made in response to a “go signal” toward a location where a target had appeared and disappeared shortly before, and voluntary sequences of saccades. The range of the amplitude of the saccades was similar in the voluntary and visually guided saccades studies included in the analysis. We can hypothesize that several parietal regions can be recruited when we make an eye movement in response to the appearance of a visual target. Some might be related more closely to the oculomotor response and some might be more related to visual processing and coordinate transformation [Andersen,1997]. The latter region might not be recruited as much when the saccade is planned voluntarily.
The other differences we observed between voluntary and visually guided saccades concerned the basal ganglia and the thalamus, which showed significant concordance only for the voluntary‐triggered saccades. The oculomotor region evidenced by this meta‐analysis in the basal ganglia was centered on the lentiform nucleus and did not seem to involve the caudate nucleus, as often reported in the individual studies. This could be due to the mislocalization of the signal change by some authors, induced perhaps by the lack of resolution of the brain‐imaging techniques. This might also be due to variability in coordinates of the maxima of oculomotor activity in the caudate nucleus. Careful fMRI analysis of basal ganglia response during eye movements reported signal change in both the caudate and the lentiform nucleus [Gerardin et al.,2000]. In nonhuman primates, the caudate nucleus and globus pallidus both seem to contain neurons involved in saccadic eye movements [Hikosaka et al.,2000]. In humans, patient studies have also suggested an important role of the lentiform nucleus in voluntary saccadic eye movements. Patients with a deficit in dopamine innervations of the lentiform nucleus, such as patients with Parkinson's disease, exhibit slower latencies and poorer accuracy for voluntary generated saccades than do control subjects. Patients with lesions in the lentiform nucleus also exhibits deficits for voluntary saccades but not for visually triggered saccades [Vermersch et al.,1996].
Covert Shifts of Attention
This meta‐analysis confirms the high similarity of the networks involved in saccadic eye movements and in shifts of attention without eye movements. This supports the premotor theory of attention and has been discussed extensively in psychophysics as well as brain‐imaging literature. The ALE method does not address the question of the degree of recruitment of each region. Nevertheless, we have here the first demonstration that the highest concordance across brain‐imaging studies is found in the same precentral, paracentral, cingulate and parietal regions for both eye movements and covert shifts of attention.
In addition, a cluster distinct from the frontal eye field can be identified in the superior frontal sulcus/middle frontal gyrus. This cluster is recruited in a highly reproducible way for covert shifts of attention but not consistently for saccadic eye movements. This cluster is not always discussed by authors and is sometimes subsumed in the frontal eye field. The present meta‐analysis shows a dissociation between the frontal eye field and this more rostral region. Such dissociation has been described previously in several fMRI studies, attributing a role of this rostral region to spatial working memory [Courtney et al.,1998], learning sequences of eye movements [Grosbras et al.,2001], or serial visual search [Leonards et al.,2000].
Gaze Perception
Because very few and rather heterogeneous studies were inputted into the analysis of gaze perception, the conclusions that we can draw remain more speculative than are those for the topics discussed above. We nonetheless observed significant concordance in several brain regions. These included regions in the occipitotemporal cortex that were not commonly recruited for the saccadic eye movements or covert shifts of attention. These regions are known to be involved in face perception, in particular the anterior and posterior fusiform gyrus and the superior temporal sulcus [Haxby et al.,2000; Kanwisher et al.,1997]. Interestingly, fMRI and magnetoencephalography (MEG) reports have demonstrated that the signal elicited by the perception of faces in these regions is modulated by the configuration of the gaze [George et al.,2001; Hoffmann and Bach,2002]. In addition, electrophysiological studies in nonhuman primates have identified neurons in face‐specific regions that are selective for the perception of gaze [Perrett et al.,1985]. Independent brain‐imaging investigations have reported that a similar network is also engaged during the observation of movements of body parts other than the face. The fusiform cortex and the middle temporal region close to the superior temporal sulcus thus might be regions generally involved in the perception of other people. In line with this hypothesis, others have suggested that the cortex around the superior temporal sulcus might be specialized for perceiving social signals mediated by biological motion [Allison et al.,2000; Blakemore et al.,2004].
The interesting result of our gaze‐perception analysis is the comparison with the meta‐analysis carried out for eye movements and attention. First, the perception of gaze seems to share more resources with visually triggered (reflexive) orienting than it does with voluntary orienting. This is in line with psychophysics studies demonstrating that reaction time in response to a gaze cue is more similar to reaction times generated in response to peripheral (exogenous) than central (endogenous) cues, respectively [Hietanen,1999; Langton et al.,2000].
Our meta‐analyses identified a cortical region, located in the vicinity of the ascending part of the superior temporal sulcus, present in three “concordance” maps, namely those for the visually triggered saccades, visually triggered shifts of attention, and gaze perception (Fig. 2, column 5, z = 10, green circles). This region likely corresponds to the region referred to as the temporoparietal junction (TPJ). The TPJ has been involved in target detection particularly when the target is unexpected [Corbetta et al.,2000]. When asking an observer to search for and detect a target among distractors, Shulman et al. [2003] observed a response in the frontal eye field and in the intraparietal sulcus during the search and detection. However, the TPJ responded only during the detection phase and showed decreased signal during the search. The fact that we observe consistent TPJ involvement for the visually triggered and not for the voluntary condition is consistent with this result in that visually triggered displacements of attention always imply detection of an unexpected peripheral target. Why would the perception of someone's gaze shifts also involve the TPJ? Schulman et al. [2003] proposed that this region acts as a “circuit breaker,”, signaling for the termination of the search process (p. 3393). Only stimuli passing a filter for a relevant target would increase TPJ activity and trigger its break signal. The authors also suggest that the stimuli “requiring attention to be reoriented” are more efficient in recruiting the TPJ. We can interpret the recruitment of the TPJ during gaze perception in two ways. First, it might be that social‐relevant stimuli are powerful stimuli that act as a target able to activate the TPJ. Second, the TPJ recruitment might be part of a process that stops any ongoing search and allocates all attentional resources to the location indicated by someone else gaze.
The frontoparietal circuit engaged during gaze perception is also included in the frontoparietal circuit commonly involved in eye movements and covert shifts of attention. This may be linked to the fact that seeing someone else's gaze shift triggers shifts of attention. This response is automatic in the sense that it occurs even if the observer has no intention to orient in the direction of the seen gaze [Driver et al.,1999; Langton and Bruce,2000]. It is therefore not surprising that regions involved in reflexive (visually triggered) overt or covert shifts of attention are also recruited during gaze perception. Most studies included in the analysis [Hoffman and Haxby,2000; Puce et al.,1998] were interested only in the regions known to be involved in face processing, and one of them [Hoffman and Haxby,2000] did not scan the frontal lobe. The significance of the concordance in the frontal eye field is thus probably underestimated.
It is interesting to draw a parallel with the observation of motion of other body parts. It has been demonstrated extensively that motor and premotor regions are recruited for the active execution of an action and the passive observation of the same action carried out by another individual [Buccino et al.,2001; Grezes et al.,2003]. Such a phenomenon is evidenced in nonhuman primates at the level of single neurons, which are called mirror neurons [Gallese et al.,1996; Rizzolatti and Craighero,2004]. We submit that the recruitment of common regions for eye movements and gaze perception reflects the equivalent of a mirror system in the oculomotor domain. Such a system would account for the strong orienting effect of gaze and provide a neural support for joint attention. It would have some unique features, starting with the fact that it is impossible to see our own eyes moving, even in a mirror, because of the phenomenon of saccadic suppression. Whereas the mirror system for limb actions might reflect a shared motor representation (egocentric or body‐centered frame of reference), a mirror system for eye movements might reflect a shared spatial representation (allocentric or world‐centered frame of reference).
Limitations, Conclusions, and Perspectives
This comparative meta‐analysis is limited by the low number and heterogeneity of brain‐imaging studies on gaze perception. Some did not image the whole brain, therefore biasing the ALE. In only one of the studies was the observed gaze actually directed at a target visible to the observer [Hooker et al.,2003]; therefore, strictly speaking, only this study investigated joint attention. Further research is needed to test whether the brain circuits involved in gaze perception differ with and without a target. This will answer the question of a common or different mechanism for gaze following and for joint attention [Emery,2000].
Despite these limitations, we believe that the present meta‐analysis is helpful in showing that gaze perception shares a common substrate and by extension, a common underlying mechanism with overt or covert shifts of spatial attention triggered by the appearance of a peripheral flash of light. Further work is certainly needed to clarify the brain regions that are involved in gaze perception and compare them directly with those involved in reflexive and voluntary shifts of attention. In this context, the hypothesis of a mirror system for gaze might be fruitful. III
Table III.
Results for the saccades, attention and gaze perception analysis
| Region | Side | Coordinates | ALE score | Extent (mm3) | ||
|---|---|---|---|---|---|---|
| x | y | z | ||||
| All saccades | ||||||
| Precentral gyrus | L | −30 | −8 | 50 | 0.056 | 34,952 |
| L | −2 | −2 | 52 | 0.046 | ||
| R | 36 | −8 | 48 | 0.47 | ||
| Anterior cingulate | R | 6 | 20 | 44 | 0.013 | 336 |
| Posterior parietal cortex (IPS + SPL) | L | −28 | −54 | 54 | 0.052 | 8,536 |
| Posterior SPL | L | −26 | −72 | 32 | 0.02 | 328 |
| Posterior parietal cortex (IPS, SPL, precuneus) | R | 22 | −60 | 54 | 0.027 | 11,320 |
| Postcentral/IPL | R | 42 | −42 | 40 | 0.013 | 296 |
| Precuneus | L | −12 | −72 | 42 | 0.013 | 296 |
| STS/STG | R | 50 | −40 | 12 | 0.019 | 784 |
| Lingual gyrus | L | −10 | −82 | −2 | 0.018 | 1,304 |
| Cuneus | R | 4 | −74 | 12 | 0.013 | 168 |
| Globus pallidus and Pulvinar | L | −22 | −14 | 6 | 0.018 | 784 |
| Globus pallidus | R | 26 | 4 | 8 | 0.013 | 120 |
| Cerebellum | R | 10 | −70 | −12 | 0.015 | 216 |
| Attention | ||||||
| Precentral gyrus | R | 44 | 4 | 46 | 0.016 | 5,384 |
| L | −22 | −8 | 52 | 0.018 | 4,272 | |
| SFS | R | 24 | 10 | 46 | 0.015 | 592 |
| Cingulate | R | 8 | 20 | 26 | 0.01 | 160 |
| MFG/cingulate | L + R | 0 | 10 | 42 | 0.025 | 3,800 |
| MFG | −34 | 20 | 44 | 0.01 | 232 | |
| IFG | 42 | 22 | −4 | 0.016 | 648 | |
| IPL/postcentral | 40 | −38 | 60 | 0.011 | 496 | |
| SPL + precuneus | −24 | −58 | 52 | 0.038 | 7,432 | |
| SPL + precuneus | 26 | −56 | 56 | 0.038 | 6,192 | |
| STG | 60 | −38 | 12 | 0.013 | 528 | |
| ITS/MTG | −46 | −64 | −4 | 0.015 | 920 | |
| 50 | −60 | −2 | 0.014 | 672 | ||
| Fusiform gyrus | −36 | −60 | −20 | 0.009 | 168 | |
| Insula | −38 | 16 | 2 | 0.013 | 752 | |
| MOG | 42 | −68 | 6 | 0.013 | 576 | |
| Lentiform nucleus | −26 | 2 | 2 | 0.012 | 272 | |
| Gaze perception | ||||||
| Precentral gyrus | R | 40 | −6 | 38 | 0.007 | 120 |
| R | 42 | 2 | 48 | 0.007 | 104 | |
| IFG | R | 53 | 10 | 32 | 0.007 | 128 |
| IPL/postcentral | L | −48 | −40 | 54 | 0.007 | 120 |
| SPL + precuneus | R | 32 | −56 | 52 | 0.007 | 512 |
| Postcentral gyrus | L | −46 | −14 | 56 | 0.013 | 504 |
| ITS/MTG | R | 62 | −50 | 6 | 0.007 | 168 |
| R | 50 | −64 | 2 | 0.01 | 976 | |
| MTG ant | L | −52 | −20 | −10 | 0.007 | 848 |
| STS/STG | L | −48 | −56 | 16 | 0.008 | 520 |
| Claustrum/posterior insula | L | −36 | −20 | 2 | 0.007 | 160 |
| Anterior fusiform gyrus | L | −44 | −44 | 18 | 0.006 | 104 |
| Posterior fusiform gyrus | L | −20 | −80 | −16 | 0.007 | 128 |
| IOG | R | 26 | −96 | −10 | 0.007 | 128 |
Each cluster was defined as a region of eight or more contiguous voxels that showed a significant (P < 0.05 corrected for multiple comparisons) concordance across studies. The higher the ALE score, the higher the concordance. For the saccade analysis, coordinates of maxima within the frontal cluster were identified when a threshold of P < 0.005 was applied to be able to extract several peaks from the extended region. The maps and the rest of the maxima were constructed at the P < 0.05 threshold.
IPS, intraparietal sulcus; SPL, superior parietal lobule; IPL, inferior parietal lobule; STS, superior temporal sulcus; STG, superior temporal gyrus; SFS, superior frontal sulcus; MFG, middle frontal gyrus; IFG, inferior frontal gyrus; ITS, inferior temporal sulcus; MTG, middle temporal gyrus; MOG, middle occipital gyrus; IOG, inferior occipital gyrus.
REFERENCES
- Allison T, Puce A, McCarthy G (2000): Social perception from visual cues: role of the STS region. Trends Cogn Sci 4: 267–278. [DOI] [PubMed] [Google Scholar]
- Andersen RA (1997): Multimodal integration for the representation of space in the parietal cortex. Philos Trans R Soc Lond B Biol Sci 352: 1421–1428. [DOI] [PMC free article] [PubMed] [Google Scholar]
- Anderson TJ, Jenkins IH, Brooks DJ, Hawken MB, Frackowiak RS, Kennard C (1994): Cortical control of saccades and fixation in man: a positron emission tomography study. Brain 117: 1073–1084. [DOI] [PubMed] [Google Scholar]
- Astafiev SV, Shulman GL, Stanley CM, Snyder AZ, Van Essen DC, Corbetta M (2003): Functional organization of human intraparietal and frontal cortex for attending, looking, and pointing. J Neurosci 23: 4689–4699. [DOI] [PMC free article] [PubMed] [Google Scholar]
- Beauchamp MS, Petit L, Ellmore TM, Ingeholm J, Haxby JV (2001): A parametric fMRI study of overt and covert shifts of visuospatial attention. Neuroimage 14: 310–321. [DOI] [PubMed] [Google Scholar]
- Berman RA, Colby CL, Genovese CR, Voyvodic JT, Luna B, Thulborn KR, Sweeney JA (1999): Cortical networks subserving pursuit and saccadic eye movements in humans: an FMRI study. Hum Brain Mapp 8: 209–225. [DOI] [PMC free article] [PubMed] [Google Scholar]
- Blakemore SJ, Winston J, Frith U (2004): Social cognitive neuroscience: where are we heading? Trends Cogn Sci 8: 216–222. [DOI] [PubMed] [Google Scholar]
- Brett M (1999): The MNI brain and the Talairach atlas, Cambridge Imagers. Online at http://www.mrc-cbu.cam.ac.uk/Imaging/mnispace.html.
- Brown MR, DeSouza JF, Goltz HC, Ford K, Menon RS, Goodale MA, Everling S (2004): Comparison of memory‐ and visually guided saccades using event‐related fMRI. J Neurophysiol 91: 873–889. [DOI] [PubMed] [Google Scholar]
- Buccino G, Binkofski F, Fink GR, Fadiga L, Fogassi L, Gallese V, Seitz RJ, Zilles K, Rizzolatti G, Freund HJ (2001): Action observation activates premotor and parietal areas in a somatotopic manner: an fMRI study. Eur J Neurosci 13: 400–404. [PubMed] [Google Scholar]
- Buchel C, Josephs O, Rees G, Turner R, Frith CD, Friston KJ (1998): The functional anatomy of attention to visual motion. A functional MRI study. Brain 121: 1281–1294. [DOI] [PubMed] [Google Scholar]
- Calder AJ, Lawrence AD, Keane J, Scott SK, Owen AM, Christoffels I, Young AW (2002): Reading the mind from eye gaze. Neuropsychologia 40: 1129–1138. [DOI] [PubMed] [Google Scholar]
- Collins DL, Neelin P, Peters TM, Evans AC (1994): Automatic 3‐D intersubject registration of MR volumetric data in standardized Talairach space. J Comput Assist Tomogr 18: 192–205. [PubMed] [Google Scholar]
- Connolly JD, Goodale MA, Desouza JF, Menon RS, Vilis T (2000): A comparison of frontoparietal fMRI activation during anti‐saccades and anti‐pointing. J Neurophysiol 84: 1645–1655. [DOI] [PubMed] [Google Scholar]
- Corbetta M, Akbudak E, Conturo TE, Snyder AZ, Ollinger JM, Drury HA, Linenweber MR, Petersen SE, Raichle ME, Van Essen DC, Shulman GL (1998): A common network of functional areas for attention and eye movements. Neuron 21: 761–773. [DOI] [PubMed] [Google Scholar]
- Corbetta M, Miezin FM, Shulman GL, Petersen SE (1993): A PET study of visuospatial attention. J Neurosci 13: 1202–1226. [DOI] [PMC free article] [PubMed] [Google Scholar]
- Corbetta M, Shulman GL (1998): Human cortical mechanisms of visual attention during orienting and search. Philos Trans R Soc Lond B Biol Sci 353: 1353–1362. [DOI] [PMC free article] [PubMed] [Google Scholar]
- Corbetta M, Kincade JM, Ollinger JM, McAvoy MP, Shulman GL (2000): Voluntary orienting is dissociated from target detection in human posterior parietal cortex. Nat Neurosci 3: 292–297. [DOI] [PubMed] [Google Scholar]
- Courtney SM, Petit L, Maisog JA, Ungerleider LG, Haxby JV (1998): An area specialized for spatial working memory in human frontal cortex. Science 279: 1347–1350. [DOI] [PubMed] [Google Scholar]
- Critchley M (1957): The parietal lobes. London: Edward Arnold and Co. [Google Scholar]
- Driver J, Davis G, Ricciardelli P, Kidd P, Maxwell E, Baron‐Cohen S (1999): Gaze perception triggers reflexive visuospatial orienting. Vis Cogn 6: 509–540. [Google Scholar]
- Emery NJ (2000): The eyes have it: the neuroethology, function and evolution of social gaze. Neurosci Biobehav Rev 24: 581–604. [DOI] [PubMed] [Google Scholar]
- Fox PT, Fox JM, Raichle ME, Burde RM (1985): The role of cerebral cortex in the generation of voluntary saccades: a positron emission tomography study. J Neurophysiol 54: 348–369. [DOI] [PubMed] [Google Scholar]
- Fox PT, Parsons LM, Lancaster JL (1998): Beyond the single study: function/location metanalysis in cognitive neuroimaging. Curr Opin Neurobiol 8: 178–187. [DOI] [PubMed] [Google Scholar]
- Gagnon D, O'Driscoll GA, Petrides M, Pike GB (2002): The effect of spatial and temporal information on saccades and neural activity in oculomotor structures. Brain 125: 123–139. [DOI] [PubMed] [Google Scholar]
- Gallese V, Fadiga L, Fogassi L, Rizzolatti G (1996): Action recognition in the premotor cortex. Brain 119: 593–609. [DOI] [PubMed] [Google Scholar]
- Garrett AS, Menon V, MacKenzie K, Reiss AL (2004): Here's looking at you, kid: neural systems underlying face and gaze processing in fragile X syndrome. Arch Gen Psychiatry 61: 281–288. [DOI] [PubMed] [Google Scholar]
- Genovese CR, Lazar NA, Nichols T (2002): Thresholding of statistical maps in functional neuroimaging using the false discovery rate. Neuroimage 15: 870–878. [DOI] [PubMed] [Google Scholar]
- George N, Driver J, Dolan RJ (2001): Seen gaze‐direction modulates fusiform activity and its coupling with other brain areas during face processing. Neuroimage 13: 1102–1112. [DOI] [PubMed] [Google Scholar]
- Gerardin E, Sirigu A, Lehericy S, Poline JB, Gaymard B, Marsault C, Agid Y, Le Bihan D (2000): Partially overlapping neural networks for real and imagined hand movements. Cereb Cortex 10: 1093–1104. [DOI] [PubMed] [Google Scholar]
- Giesbrecht B, Woldorff MG, Song AW, Mangun GR (2003): Neural mechanisms of top‐down control during spatial and feature attention. Neuroimage 19: 496–512. [DOI] [PubMed] [Google Scholar]
- Gitelman DR, Nobre AC, Parrish TB, LaBar KS, Kim YH, Meyer JR, Mesulam M (1999): A large‐scale distributed network for covert spatial attention: further anatomical delineation based on stringent behavioural and cognitive controls. Brain 122: 1093–1106. [DOI] [PubMed] [Google Scholar]
- Grezes J, Armony JL, Rowe J, Passingham RE (2003): Activations related to “mirror” and “canonical” neurones in the human brain: an fMRI study. Neuroimage 18: 928–937. [DOI] [PubMed] [Google Scholar]
- Grosbras MH, Berthoz A (2003): Parieto‐frontal networks and gaze shifts in humans: review of functional magnetic resonance imaging data. Adv Neurol 93: 269–280. [PubMed] [Google Scholar]
- Grosbras MH, Leonards U, Lobel E, Poline JB, Le Bihan D, Berthoz A (2001): Human cortical networks for new and familiar sequences of saccades. Cereb Cortex 11: 936–945. [DOI] [PubMed] [Google Scholar]
- Grosbras MH, Lobel E, Van de Moortel PF, Le Bihan D, Berthoz A (1999): An anatomical landmark for the supplementary eye field revealed with fMRI. Cereb Cortex 9: 705–711. [DOI] [PubMed] [Google Scholar]
- Haxby JV, Hoffman EA, Gobbini MI (2000): The distributed human neural system for face perception. Trends Cogn Sci 4: 223–233. [DOI] [PubMed] [Google Scholar]
- Heide W, Binkofski F, Seitz RJ, Posse S, Nitschke MF, Freund HJ, Kompf D (2001): Activation of frontoparietal cortices during memorized triple‐step sequences of saccadic eye movements: an fMRI study. Eur J Neurosci 13: 1177–1189. [DOI] [PubMed] [Google Scholar]
- Hietanen JK (1999): Does your gaze direction and orientation shift my visual orientation? Neuroreport 10: 3443–3447. [DOI] [PubMed] [Google Scholar]
- Hikosaka O, Takikawa Y, Kawagoe R (2000): Role of the basal ganglia in the control of purposive saccadic eye movements. Physiol Rev 80: 953–978. [DOI] [PubMed] [Google Scholar]
- Hoffmann MB, Bach M (2002): The distinction between eye and object motion is reflected by the motion‐onset visual evoked potential. Exp Brain Res 144: 141–151. [DOI] [PubMed] [Google Scholar]
- Hoffman EA, Haxby JV (2000): Distinct representations of eye gaze and identity in the distributed human neural system for face perception. Nat Neurosci 3: 80–84. [DOI] [PubMed] [Google Scholar]
- Holmes CJ, Hoge R, Collins L, Woods R, Toga AW, Evans AC (1998): Enhancement of MR images using registration for signal averaging. J Comput Assist Tomogr 22: 324–333. [DOI] [PubMed] [Google Scholar]
- Hooker CI, Paller KA, Gitelman DR, Parrish TB, Mesulam MM, Reber PJ (2003): Brain networks for analyzing eye gaze. Brain Res Cogn Brain Res 17: 406–418. [DOI] [PMC free article] [PubMed] [Google Scholar]
- Hopfinger JB, Buonocore MH, Mangun GR (2000): The neural mechanisms of top‐down attentional control. Nat Neurosci 3: 284–291. [DOI] [PubMed] [Google Scholar]
- Kanwisher N, McDermott J, Chun MM (1997): The fusiform face area: a module in human extrastriate cortex specialized for face perception. J Neurosci 17: 4302–4311. [DOI] [PMC free article] [PubMed] [Google Scholar]
- Kastner S, Pinsk MA, De Weerd P, Desimone R, Ungerleider LG (1999): Increased activity in human visual cortex during directed attention in the absence of visual stimulation. Neuron 22: 751–761. [DOI] [PubMed] [Google Scholar]
- Kato C, Matsuo K, Matsuzawa M, Moriya T, Glover GH, Nakai T (2001): Activation during endogenous orienting of visual attention using symbolic pointers in the human parietal and frontal cortices: a functional magnetic resonance imaging study. Neurosci Lett 314: 5–8. [DOI] [PubMed] [Google Scholar]
- Kawashima R, Sugiura M, Kato T, Nakamura A, Hatano K, Ito K, Fukuda H, Kojima S, Nakamura K (1999): The human amygdala plays an important role in gaze monitoring. A PET study. Brain 122: 779–783. [DOI] [PubMed] [Google Scholar]
- Kawashima R, Tanji J, Okada K, Sugiara M, Sato K, Kinomura S, Inoue K, Ogawa A, Fukuda H (1998): Oculomotor sequence learning: a positron emission tomography study. Exp Brain Res 122: 1–8. [DOI] [PubMed] [Google Scholar]
- Kim YH, Gitelman DR, Nobre AC, Parrish TB, LaBar KS, Mesulam MM (1999): The large‐scale neural network for spatial attention displays multifunctional overlap but differential asymmetry. Neuroimage 9: 269–277. [DOI] [PubMed] [Google Scholar]
- Kimmig H, Greenlee MW, Gondan M, Schira M, Kassubek J, Mergner T (2001): Relationship between saccadic eye movements and cortical activity as measured by fMRI: quantitative and qualitative aspects. Exp Brain Res 141: 184–194. [DOI] [PubMed] [Google Scholar]
- Kochunov P, Lancaster JL, Thompson P, Woods R, Mazziotta J, Hardies J, Fox P (2001): Regional spatial normalization: toward an optimal target. J Comput Assist Tomogr 25: 805–816. [DOI] [PubMed] [Google Scholar]
- Kochunov P, Lancaster J, Thompson P, Toga AW, Brewer P, Hardies J, Fox P (2002): An optimized individual target brain in the Talairach coordinate system. Neuroimage 17: 922–927. [PubMed] [Google Scholar]
- Konen CS, Kleiser R, Wittsack HJ, Bremmer F, Seitz RJ (2004): The encoding of saccadic eye movements within human posterior parietal cortex. Neuroimage 22: 304–314. [DOI] [PubMed] [Google Scholar]
- Koyama M, Hasegawa I, Osada T, Adachi Y, Nakahara K, Miyashita Y (2004): Functional magnetic resonance imaging of macaque monkeys performing visually guided saccade tasks: comparison of cortical eye fields with humans. Neuron 41: 795–807. [DOI] [PubMed] [Google Scholar]
- Laird AR, Fox PM, Price CJ, Glahn PC, Vecker AM, Lancaster JL, Turkeltaub PE, Kochunov P, Fox PT (2005): ALE meta‐analysis: Controlling the false discovery rate and performing statistical contrasts. Hum Brain Mapp 25: 155–164. [DOI] [PMC free article] [PubMed] [Google Scholar]
- Langton SR, Bruce V (2000): You must see the point: automatic processing of cues to the direction of social attention. J Exp Psychol Hum Percept Perform 26: 747–757. [DOI] [PubMed] [Google Scholar]
- Langton SR, Watt RJ, Bruce I (2000): Do the eyes have it? Cues to the direction of social attention. Trends Cogn Sci 4: 50–59. [DOI] [PubMed] [Google Scholar]
- Law I, Svarer C, Holm S, Paulson OB (1997): The activation pattern in normal humans during suppression, imagination and performance of saccadic eye movements. Acta Physiol Scand 161: 419–434. [DOI] [PubMed] [Google Scholar]
- Le Goualher G, Argenti AM, Duyme M, Baare WF, Hulshoff Pol HE, Boomsma DI, Zouaoui A, Barillot C, Evans AC (2000): Statistical sulcal shape comparisons: application to the detection of genetic encoding of the central sulcus shape. Neuroimage 11: 564–574. [DOI] [PubMed] [Google Scholar]
- Leigh RJ, Zee DS (1999): The neurology of eye movements (3rd ed.). New York: Oxford University Press. [Google Scholar]
- Leonards U, Sunaert S, Van Hecke P, Orban GA (2000): Attention mechanisms in visual search—an fMRI study. J Cogn Neurosci 12: 61–75. [DOI] [PubMed] [Google Scholar]
- Lobel E, Kahane P, Leonards U, Grosbras MH, Lehéricy S, LeBihan D, Berthoz A (2001): Localization of the human frontal eye fields: anatomical and functional findings from fMRI and intracerebral electrical stimulation. J Neurosurg 95: 804–815. [DOI] [PubMed] [Google Scholar]
- Luna B, Thulborn KR, Strojwas MH, McCurtain BJ, Berman RA, Genovese CR, Sweeney JA (1998): Dorsal cortical regions subserving visually guided saccades in human: an fMRI study. Cereb Cortex 8: 40–47. [DOI] [PubMed] [Google Scholar]
- Matsuda T, Matsuura M, Ohkubo T, Ohkubo H, Matsushima E, Inoue K, Taira M, Kojima T (2004): Functional MRI mapping of brain activation during visually guided saccades and antisaccades: cortical and subcortical networks. Psychiatry Res 131: 147–155. [DOI] [PubMed] [Google Scholar]
- Merriam EP, Colby CL, Thulborn KR, Luna B, Olson CR, Sweeney JA (2001): Stimulus–response incompatibility activates cortex proximate to three eye fields. Neuroimage 13: 794–800. [DOI] [PubMed] [Google Scholar]
- Mort DJ, Perry RJ, Mannan SK, Hodgson TL, Anderson E, Quest R, McRobbie D, McBride A, Husain M, Kennard C (2003): Differential cortical activation during voluntary and reflexive saccades in man. Neuroimage 18: 231–246. [DOI] [PubMed] [Google Scholar]
- Nobre AC, Gitelman DR, Dias EC, Mesulam MM (2000): Covert visual spatial orienting and saccades: overlapping neural systems. Neuroimage 11: 210–216. [DOI] [PubMed] [Google Scholar]
- O'Sullivan T, Jenkins IH, Henderson L, Kennard C, Brooks DJ (1995): The functional anatomy of remembered saccades: a positron emission tomography study. Neuroreport 6: 2141–2144. [DOI] [PubMed] [Google Scholar]
- Paus T (1996): Location and function of the human frontal eye field: a selective review. Neuropsychologia 34: 475–483. [DOI] [PubMed] [Google Scholar]
- Paus T, Marrett S, Worsley KJ, Evans AC (1995): Extraretinal modulation of cerebral blood flow in the human visual cortex: implications for saccadic suppression. J Neurophysiol 74: 2179–2183. [DOI] [PubMed] [Google Scholar]
- Paus T, Petrides M, Evans AC, Meyer E (1993): Role of the human anterior cingulate cortex in the control of oculomotor, manual, and speech responses: a positron emission tomography study. J Neurophysiol 70: 453–469. [DOI] [PubMed] [Google Scholar]
- Paus T, Tomaiulo F, McDonald D, Petrides M, Atlas J, Morris R, Evans A.C (1996): Human cingulate and paracingulate sulci: pattern, variability, asymmetry and probabilistic map. Cereb Cortex 6: 207–214. [DOI] [PubMed] [Google Scholar]
- Peelen MV, Heslenfeld DJ, Theeuwes J (2004): Endogenous and exogenous attention shifts are mediated by the same large‐scale neural network. Neuroimage 22: 822–830. [DOI] [PubMed] [Google Scholar]
- Perrett DI, Smith PA, Potter DD, Mistlin AJ, Head AS, Milner AD, Jeeves MA (1985): Visual cells in the temporal cortex sensitive to face view and gaze direction. Proc R Soc Lond B Biol Sci 223: 293–317. [DOI] [PubMed] [Google Scholar]
- Perry RJ, Zeki S (2000): The neurology of saccades and covert shifts in spatial attention: an event‐related fMRI study. Brain 123: 2273–2288. [DOI] [PubMed] [Google Scholar]
- Petit L, Haxby JV (1999): Functional anatomy of pursuit eye movements in humans as revealed by fMRI. J Neurophysiol 82: 463–471. [DOI] [PubMed] [Google Scholar]
- Petit L, Orssaud C, Tzourio N, Crivello F, Berthoz A, Mazoyer B (1996): Functional anatomy of a prelearned sequence of horizontal saccades in humans. J Neurosci 16: 3714–3736. [DOI] [PMC free article] [PubMed] [Google Scholar]
- Picard N, Strick PL (1996): Motor areas of the medial wall: a review of their location and functional activation. Cereb Cortex 6: 342–353. [DOI] [PubMed] [Google Scholar]
- Puce A, Allison T, Bentin S, Gore JC, McCarthy G (1998): Temporal cortex activation in humans viewing eye and mouth movements. J Neurosci 18: 2188–2199. [DOI] [PMC free article] [PubMed] [Google Scholar]
- Rademacher J, Caviness VS Jr, Steinmetz H, Galaburda AM (1993): Topographical variation of the human primary cortices: implications for neuroimaging, brain mapping, and neurobiology. Cereb Cortex 3: 313–329. [DOI] [PubMed] [Google Scholar]
- Ricciardelli P, Bricolo E, Aglioti SM, Chelazzi L (2002): My eyes want to look where your eyes are looking: exploring the tendency to imitate another individual's gaze. Neuroreport 13: 2259–2264. [DOI] [PubMed] [Google Scholar]
- Rizzolatti G, Craighero L (2004): The mirror‐neuron system. Annu Rev Neurosci 27: 169–192. [DOI] [PubMed] [Google Scholar]
- Rizzolatti G, Riggio L, Dascola I, Umilta C (1987): Reorienting attention across the horizontal and vertical meridians: evidence in favor of a premotor theory of attention. Neuropsychologia 25: 31–40. [DOI] [PubMed] [Google Scholar]
- Rorden C, Brett M (2000): Stereotaxic display of brain lesions. Behav Neurol 12: 191–200. [DOI] [PubMed] [Google Scholar]
- Rosen AC, Rao SM, Caffarra P, Scaglioni A, Bobholz JA, Woodley SJ, Hammeke TA, Cunningham JM, Prieto TE, Binder JR (1999): Neural basis of endogenous and exogenous spatial orienting. A functional MRI study. J Cogn Neurosci 11: 135–152. [DOI] [PubMed] [Google Scholar]
- Shulman GL, McAvoy MP, Cowan MC, Astafiev SV, Tansy AP, d'Avossa G, Corbetta M (2003): Quantitative analysis of attention and detection signals during visual search. J Neurophysiol 90: 3384–3397. [DOI] [PubMed] [Google Scholar]
- Simon O, Mangin JF, Cohen L, Le Bihan D, Dehaene S (2002): Topographical layout of hand, eye, calculation, and language‐related areas in the human parietal lobe. Neuron 33: 475–487. [DOI] [PubMed] [Google Scholar]
- Sweeney JA, Mintun MA, Kwee S, Wiseman MB, Brown DL, Rosenberg DR, Car JR (1996): Positron emission tomography study of voluntary saccadic eye movements and spatial working memory. J Neurophysiol 75: 454–468. [DOI] [PubMed] [Google Scholar]
- Talairach J, Tournoux P (1988): Co‐planar stereotaxic atlas of the human brain. Stuttgart: Thieme. [Google Scholar]
- Thulborn KR, Martin C, Voyvodic JT (2000): Functional MR imaging using a visually guided saccade paradigm for comparing activation patterns in patients with probable Alzheimer's disease and in cognitively able elderly volunteers. AJNR Am J Neuroradiol 21: 524–531. [PMC free article] [PubMed] [Google Scholar]
- Turkeltaub PE, Eden GF, Jones KM, Zeffiro TA (2002): Meta‐analysis of the functional neuroanatomy of single‐word reading: method and validation. Neuroimage 16: 765–780. [DOI] [PubMed] [Google Scholar]
- Vandenberghe R, Gitelman DR, Parrish TB, Mesulam MM (2001): Functional specificity of superior parietal mediation of spatial shifting. Neuroimage 14: 661–673. [DOI] [PubMed] [Google Scholar]
- Vermersch AI, Muri RM, Rivaud S, Vidailhet M, Gaymard B, Agid Y, Pierrot‐Deseilligny C (1996): Saccade disturbances after bilateral lentiform nucleus lesions in humans. J Neurol Neurosurg Psychiatry 60: 179–184. [DOI] [PMC free article] [PubMed] [Google Scholar]
- Watson JD, Myers R, Frackowiak RS, Hajnal JV, Woods RP, Mazziota J.C, Shipp S, Zeki S (1993): Area V5 of the human brain: evidence from a combined study using positron emission tomography and magnetic resonance imaging. Cereb Cortex 3: 79–94. [DOI] [PubMed] [Google Scholar]
- Wicker B, Michel F, Henaff MA, Decety J (1998): Brain regions involved in the perception of gaze: a PET study. Neuroimage 8: 221–227. [DOI] [PubMed] [Google Scholar]
- Yousry TA, Schmidt UD, Alkadhi H, Schmidt D, Peraud A, Buettner A, Winkler P (1997): Localization of the motor hand area to a knob on the precentral gyrus. A new landmark. Brain 120: 141–157. [DOI] [PubMed] [Google Scholar]
- Zilles K, Schleicher A, Amunts K, Amunts K, Morosan P, Palomero‐Gallagher N, Schormann T, Mohlberg H, Burgel U, Steinmetz H, Schlaug G, Roland PE (1997): Quantitative analysis of sulci in the human cerebral cortex: development, regional heterogeneity, gender difference, asymmetry, intersubject variability and cortical architecture. Hum Brain Mapp 5: 218–221. [DOI] [PubMed] [Google Scholar]