

Abstract
Patterns of gray matter (GM) loss were measured in 223 healthy subjects spanning eight decades. We observed significant clusters of accelerated loss in focal regions of the frontal and parietal cortices, including the dorsolateral frontal cortex, pre‐ and postcentral gyrus, and the inferior and superior parietal lobes. The rate of loss in these clusters was approximately twice that of the global average. By contrast, clusters of significant GM preservation were found in limbic and paralimbic structures, including the amygdala, hippocampus, thalamus, and the cingulate gyrus. In these clusters, GM loss was attenuated significantly relative to the global rate. The preservation of these structures is consistent with the functional importance of the thalamo‐limbic circuits in sensory integration, arousal, emotion, and memory, and lends credence to the idea that later‐maturing cortical regions are more vulnerable to age‐related morphologic changes. Moreover, the limbic findings act as a frame of reference to explore further the effects of stress and learning on these structures in an evidence‐based manner across age. Hum Brain Mapp, 2005. © 2005 Wiley‐Liss, Inc.
Keywords: limbic, paralimbic, gray matter loss, aging, MRI, voxel‐based morphometry
INTRODUCTION
Previously, the study of structural brain changes has relied on postmortem specimens and in vivo studies. With these techniques, it has been demonstrated that gray matter (GM) volume loss occurs with increasing age and that this volume loss shows considerable regional heterogeneity. A greater understanding of these changes is important to understanding the neurophysiology of both normal and pathologic aging. John Hughlings Jackson, for example, considered that those functions that appeared last in evolutionary terms and emerge late in human development are the most fragile to dysfunction [Ey, 1978]. Coupled with new analytic procedures, neuroimaging techniques such as magnetic resonance imaging (MRI) provide a means to elucidate these structural changes at high resolution in the intact brain. MRI measurements provide a key window in the determination of the relative contribution of macroscopic degenerative events such as GM atrophy or programmed developmental events such as GM “pruning”. Changes in gene expression, connectivity, or suprastructural function are not accessible using volumetric techniques, although the latter two are potentially measurable using techniques such as positron emission tomography (PET), functional MRI (fMRI), or diffusion tensor imaging (DTI).
A number of consistent trends have emerged from the cross‐sectional and longitudinal MRI studies undertaken to date. Accelerated age‐related GM loss has been observed consistently in the prefrontal cortex, and in the parietal and temporal association cortices [Jernigan et al., 2001; Raz et al., 1997; Resnick et al., 2000; Salat et al., 1999, 2001; Sowell et al., 2001, 2003; Tisserand et al., 2000, 2002]. Notably, these are regions that mature later in life; cortical pruning and myelination processes involved in postadolescent brain maturation may contribute to ongoing GM loss in the later decades [Sowell et al., 2001]. By contrast, although there are suggestions that earlier‐maturing limbic and primary sensory regions may show comparative preservation, data regarding the rate of GM loss in these structures remains equivocal.
Age‐related changes in the association and primary cortices have also been distinguished by the temporal pattern of GM loss. In the later‐maturing association cortices, there is a nonlinear progression in which GM loss continues beyond the third decade. For instance, GM density has been observed to show a rapid decline well into the sixth decade of life, with a subsequent plateau [Sowell et al., 2003]. In contrast, GM loss in the early‐maturing primary visual and limbic structures tends to follow a linear progression until about 30 years [Sowell et al., 2003]. Association cortices tend to mature late, a detail that is relevant to the Jackson “dissolution” hypothesis, in that hominoid brain size (and associated changes in macroscopic and microscopic brain organization) has trebled during the relatively brief evolutionary period of the last 3 million years [Tobias, 2000].
Voxel‐based morphometry (VBM) allows the voxel‐wise comparison of spatially normalized images [Ashburner and Friston, 2000; Friston et al., 1996; Good et al., 2001]. Using VBM, Good et al. [2001] described accelerated loss in frontal and parietal regions in common to those revealed in previous MRI analyses, including the central somatosensory, anterior cingulate, superior parietal, and insula cortices. Relative GM preservation was seen in limbic regions (hippocampus, amygdala, and entorhinal cortex).
The equivocal nature of limbic preservation is particularly apparent in regard to the limbic hippocampus. Although some MRI studies have found evidence of hippocampal preservation [Good et al., 2001; Sullivan et al., 1995], a recent study demonstrated a specific loss in hippocampal GM, despite preservation of subcortical GM overall [Jernigan et al., 2001]. In this regard, age‐related loss of hippocampal GM has been observed in both postmortem pathologic and feature‐based MRI studies [Driscoll et al., 2003; Kemper, 2000; Landfield, 1988; Pruessner et al., 2001; Schuff et al., 1999; Tisserand et al., 2000].
In this study, we used MRI and VBM to quantify age‐related changes in both cortical and subcortical (including limbic) regions in 223 healthy subjects spanning eight decades. VBM allows analysis of changes in the whole brain at a voxel level without any a priori bias imposed on the data through the use of region‐of‐interest (ROI) analysis. Data were analyzed controlling for global GM, allowing regionally heterogeneous rates of GM change to be determined. The spatially unbiased VBM approach used in this study allowed a genuine global analysis of regional differences in age‐related GM loss to be carried out on a large dataset with good statistical power, allowing us to test the Jacksonian concept of the increased vulnerability of late‐developing regions. We observed significant accelerated loss in focal clusters located in the frontal and parietal cortices and significant clusters of relative preservation within limbic and paralimbic regions. These findings lend weight to the idea that later‐maturing cortical regions are more vulnerable to age‐related neurodegenerative change.
SUBJECTS AND METHODS
Subjects
In total, 223 healthy subjects spanning eight decades were drawn from the Brain Resource International Database (BRID), a standardized database combining demographic, psychometric, physiologic, and anatomic information. Exclusion criteria were any known neurologic disorder, previous head injury, mental retardation, Diagnostic and Statistical Manual IV (DSM‐IV) Axis 1 diagnosis, and history of drug dependence. The SPHERE questionnaire was used to screen out individuals with a vulnerability to anxiety or depressive disorder [Hickie et al., 2001]. The age range of the sample was 8–79 years. MRI datasets were acquired at two imaging sites: Westmead Hospital (Sydney, Australia) and Wakefield Imaging (Adelaide, Australia). Subjects did not differ in age, gender distribution, height, handedness and alcohol consumption across sites, but did show differences in weight, body mass index (BMI), and years of education (Table I).
Table I.
Subject demographics and brain volume measurements
| Parameter | Westmead Hospital (n = 117) | Wakefield Imaging Centre (n = 106) | Total (n = 223) |
|---|---|---|---|
| Demographics | |||
| Age (yr) | 35.5 ± 18.1 | 33.4 ± 16.0 | 0.375 |
| Females (%) | 48.6 | 46.2 | NS |
| Height (cm) | 172 ± 12 | 172 ± 10 | 0.718 |
| Weight (kg) | 70.2 ± 16.3 | 75.2 ± 15.2 | 0.022 |
| BMI (kg/m2) | 23.7 ± 3.6 | 25.2 ± 3.8 | 0.012 |
| Education (yr) | 14.0 ± 3.3 | 12.9 ± 3.6 | 0.018 |
| Left‐handedness (%) | 11.1 | 17.0 | NS |
| Alcohol consumers (%) | 35.0 | 39.6 | NS |
| Positive SPHERE (%) | 8.5 | 10.4 | NS |
| Brain volume measures | |||
| Global GM (mL) | 750 ± 83 | 754 ± 83 | 0.705 |
| Global WM (mL) | 435 ± 55 | 458 ± 59 | 0.002 |
| Global CSF (mL) | 320 ± 47 | 313 ± 50 | 0.283 |
| TIV (mL) | 1506 ± 152 | 1526 ± 163 | 0.327 |
| GM (%) | 49.8 ± 2.7 | 49.5 ± 2.7 | 0.312 |
| WM (%) | 28.9 ± 1.8 | 30.0 ± 1.8 | <0.001 |
| CSF (%) | 21.3 ± 2.4 | 20.5 ± 2.1 | 0.011 |
BMI, body mass index; GM, gray matter; WM, white matter; CSF, cerebrospinal fluid; TIV, total intracranial volume; NS, not significant.
Each subject provided written informed consent in accordance with the ethical guidelines of the National Health and Medical Research Council of Australia.
Image Acquisition
MR images were acquired using a 1.5‐Tesla Siemens (Erlangen, Germany) Vision Plus system at Westmead Hospital (n = 117) and a 1.5‐Tesla Siemens Sonata at Perrett Imaging, Flinders University, Australia (n = 106). Three‐dimensional (3D) T1‐weighted partitions were acquired in the sagittal plane using a 3‐D magnetization prepared rapid acquisition gradient echo (MPRAGE) sequence (repetition time [TR] = 9.7 ms; echo time [TE] = 4 ms; echo train: 7; flip angle = 12 degrees; TI = 200 ms; number of excitations [NEX] = 1). In total, 180 contiguous 1‐mm slices were acquired with a 256 × 256 matrix with an in‐plane resolution of 1 mm × 1 mm resulting in isotropic voxels.
Image Analysis
MR image processing was carried out using an optimized protocol described elsewhere [Ashburner and Friston, 2000; Good et al., 2001] that employed statistical parametric mapping (SPM2; Wellcome Department of Imaging Neuroscience, London, UK; http://www.fil.ion.ucl.ac.uk/spm), running under MATLAB 6.5 (The MathWorks, Natick, MA). Brains were spatially normalized by transforming each brain to a standardized stereotactic space based on the ICBM 152 template (Montreal Neurological Institute [MNI]). Customized GM and white matter (WM) template images were calculated for each imaging site by segmenting these images using the standard T1 template and segmented images provided with SPM. Image were then segmented gray, white, cerebrospinal fluid (CSF), and non‐brain portions based on a cluster analysis method to separate pixels based on intensity differences, together with a priori knowledge of spatial tissue distribution patterns in normal subjects [Friston et al., 1996]. A correction was made to preserve quantitative tissue volumes after normalization procedure [Ashburner and Friston, 2000]. The full details of this normalization and volume correction protocol has been presented in detail elsewhere [Ashburner and Friston, 2000; Good et al., 2001]. Anatomic assignments were made with reference to an anatomic parcellation of the MNI single‐subject brain [Tzourio‐Mazoyer et al., 2002].
Statistical Analysis
To establish significant determinants of global GM, WM, and CSF measurements, backwards‐stepwise regression analysis was carried out in SPSS with a starting model including site, gender, age, the age by gender interaction, and age‐squared terms. All β coefficients are reported with 95% confidence intervals (CI).
A voxel‐based analysis of age‐related GM changes was carried out using a multivariate linear regression model in SPM. This approach corrects for multiple comparisons using Gaussian random field theory [Friston et al., 1996; Worsley et al., 1996]. In this model, the predictor of interest was age. Gender and global GM volume were included as covariates in the model. The inclusion of global GM volume as a covariate effectively models out the global trend of age‐related GM loss. In this model, significant voxel clusters therefore implies a region of GM change that differs from the global GM trend (i.e., a positive association with age implies relative GM preservation and a negative association with age implies accelerated GM loss).
To avoid site‐specific differences in MR image quality affecting the regional analysis, images were initially analyzed in two separate groups by imaging site. This approach avoided any site‐specific differences in MR image quality and any differences between groups.
In a second analysis, to maximize statistical power, data were pooled and reanalyzed as described above. In this second analysis imaging site was included as a covariate to control for between center differences. Interpretation of these results was based on a conservative approach in which cluster regions were considered significant only if they independently appeared in both analyses conducted on the two sites.
Quantitative measurements of GM change were obtained using 12 ROIs as defined by significant clusters in the pooled dataset. As described above, ROIs were only defined if they appeared independently in both site analyses. To quantify the changes present in the significant ROIs, absolute GM volumes in were calculated from the original segmented images, and analyzed using a linear regression model after correction for imaging site and gender. The volume correction made after segmentation was based on the Jacobian determinants of the deformation field used in the normalization procedure, and thus the volumes calculated represent the absolute GM volumes present and are not a density measurement [Ashburner and Friston, 2000].
RESULTS
Brain Volume Measurements
Global measurements of brain tissue volume from the two centers are summarized in Table I. GM volume and percentage, total intracranial volume (TIV), and CSF volume did not differ between imaging sites; however, the volume and percentage of WM and the percentage CSF were significantly different between sites. The relationship between age and global volumes was quantified for the pooled data using a backwards, stepwise regression multivariate model containing age, gender, age‐squared, Age × Gender terms. Site was also included as a covariate to account for any systematic site differences. The results of these analyses are presented in Table II. Global GM decreased linearly with age at a rate of 2.5 mL (95% CI = 2.0–3.0 mL/year; Fig. 1a). Global WM showed a significant quadratic trend with an early increase in WM volume, followed by a plateau between 30 and 50 years, and a decrease at older age (Fig. 1b). CSF showed an early plateau followed by a rapid increase after 40 years (Fig. 1c). Gender was a significant determinant of volume in all three tissue classes; the age trends are thus shown in Figure 1 as gender‐adjusted volumes. No significant age–gender interaction was detected for any of the global tissue volumes and the site term was significant only for WM volume.
Table II.
Determinants of global tissue volume
| Parameter | β coefficient (mL/unit) | 95% CI | P |
|---|---|---|---|
| Gray matter (r2 = 0.440) | |||
| Age (yr) | −2.5 | −2.0, −3.0 | <0.001 |
| Males | 75.2 | 58.7, 91.7 | <0.001 |
| White matter (r2 = 0.330) | |||
| Age (yr) | 3.8 | 1.9, 5.7 | <0.001 |
| Age2 (yr2) | −0.045 | −0.022, −0.068 | <0.001 |
| Males | 56.4 | 43.7, 69.2 | <0.001 |
| Site | 19.9 | 7.1, 32.6 | 0.002 |
| CSF (r2 = 0.423) | |||
| Age (yr) | −1.9 | −0.5, −3.3 | 0.008 |
| Age2 (yr2) | 0.036 | 0.019, 0.053 | <0.001 |
| Males | 49.4 | 39.9, 58.9 | <0.001 |
GM, gray matter; WM, white matter; CSF, cerebrospinal fluid; 95% CI, 95% confidence interval.
Figure 1.
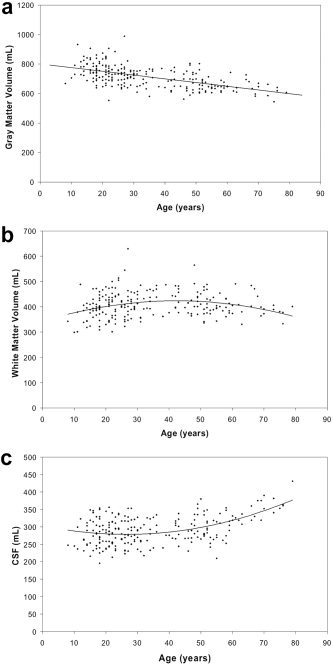
Global volume by age for the following tissue classes: gray matter volume (a); white matter volume (b); cerebrospinal fluid (CSF) volume (c). Quadratic curves are shown; see Table II for coefficients.
Regional Measurement of GM Volume Change With Age Using VBM
Table III summarizes the significant clusters of relative GM change detected using VBM analysis. Figures 2 and 3 show T‐score maps of these significant clusters superimposed on a representative T1‐weighted MRI scan taken from the patient cohort. Data are presented showing the same slices in both the Site 1 dataset (Westmead), the Site 2 dataset (Wakefield), and the pooled dataset. Bilateral clusters of relative GM preservation were observed in the calcarine sulcus (Fig. 2a), amygdala‐hippocampus complex (Fig. 2b,c), gyrus rectus/orbital inferior and superior gyrus (Fig. 2a), in a diffuse area spanning the inferior and middle temporal lobes (Fig. 2a), in the medial thalamus (Fig. 2b), and in the cingulate/medial frontal gyrus (Fig. 2b–d).
Table III.
Age‐related regional change in gray matter volume
| Location | x | y | z | P | T |
|---|---|---|---|---|---|
| Relative gray matter preservation | |||||
| L thalamus | −17 | −20 | 6 | <0.0001 | 9.40 |
| R thalamus | 17 | −20 | 8 | <0.0001 | 10.29 |
| L amygdala/hippocampus | −18 | 26 | −26 | <0.0001 | 6.32 |
| R amygdala/hippocampus | 20 | 26 | −24 | <0.0001 | 8.82 |
| L inferior/middle temporal gyrus | −62 | −48 | −23 | <0.0001 | 7.09 |
| R inferior/middle temporal gyrus | 62 | −59 | −18 | <0.0001 | 7.24 |
| L calcarine sulcus | −8 | −57 | 11 | <0.0001 | 6.82 |
| R calcarine sulcus | 11 | −60 | 6 | <0.0001 | 7.70 |
| L + R cingulate gyrus | 3 | 15 | 29 | <0.0001 | 5.20 |
| Relative gray matter loss | |||||
| L pre/postcentral gyrus/middle frontal gyrus | −48 | −12 | 44 | <0.0001 | 9.11 |
| R pre/postcentral gyrus/middle frontal gyrus | 44 | −17 | 51 | <0.0001 | 7.47 |
| R inferior frontal gyrus (opercular part) | 52 | 12 | 25 | <0.0001 | 6.77 |
| R insula (lateral) | −47 | 16 | −10 | <0.0001 | 6.98 |
| L insula (medial) | −33 | 10 | −7 | <0.0001 | 7.54 |
Figure 2.
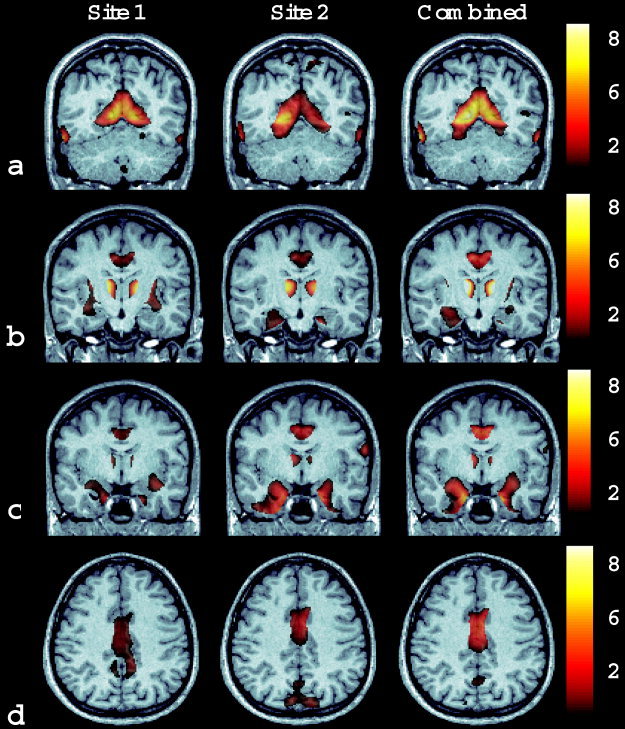
Images depicting areas of relative gray matter preservation: bilaterally in the calcarine sulcus, and in the inferior/middle temporal gyrus (a); thalamus, amygdala/hippocampus, and cingulate gyrus (b, c); cingulate gyrus (d). The significance of the change is shown as a T score as indicated on the color bar scale.
Figure 3.

Images depicting areas of accelerated relative gray matter loss: left and right insula, and bilaterally in the pre‐ and postcentral gyrus extending to the middle frontal gyrus (a–c). The significance of the change is shown as a T score as indicated on the color bar scale.
Clusters of relative accelerated GM loss were detected bilaterally in a diffuse region over the pre‐ and postcentral gyri, and the dorsolateral frontal cortex (Fig. 3a,b), bilaterally in the insula (Fig. 3a,b), and in the superior medial frontal lobe (Fig. 3c). Due to the diffuse nature of the GM loss seen in the frontal cortex, Table III shows only one maximum for this cluster.
ROI Analysis of GM Volume Change With Age
The quantitative measures of GM volume change with age are presented in Table IV, together with the volume of the clusters from which these rates of change were calculated. For comparison, the global GM change of −0.3%/year is also presented. Regions detected as those of relative GM preservation in the VBM analysis show nonsignificant GM change (left and right thalamus and right amygdala‐hippocampus), or significant negative change that is between one‐half and one‐third the magnitude of the global trend (left amygdala‐hippocampus, left and right inferior/middle temporal gyrus, and the cingulate gyrus). The clusters of relative accelerated GM loss showed a rate of GM decrease that was approximately double the global rate (motor cortex, dorsolateral frontal cortex, superior medial frontal lobe, and left and right insula).
Table IV.
Rate of age‐related gray matter volume change
| Location | Cluster volume (mL) | % gray matter loss/yr (95% CI) | P |
|---|---|---|---|
| Global gray matter | — | 0.31 (0.24–0.38) | <0.0001 |
| L thalamus | 2.7 | 0.09 (0.00–0.17) | NS |
| R thalamus | 2.3 | 0.07 (−0.02–0.16) | NS |
| L amygdala/hippocampus | 2.3 | 0.10 (0.00–0.21) | 0.042 |
| R amygdala/hippocampus | 0.9 | 0.07 (−0.04–0.17) | NS |
| Calcarine sulcus | 16.2 | 0.16 (0.06–0.25) | 0.002 |
| L inferior/middle temporal gyrus | 1.1 | 0.16 (0.06–0.25) | 0.001 |
| R inferior/middle temporal gyrus | 0.7 | 0.10 (0.00–0.20) | 0.045 |
| Medial frontal gyrus/cingulate gyrus | 3.2 | 0.15 (0.06–0.24) | 0.001 |
| L + R dorsolateral frontal cortex | 28.7 | 0.64 (0.55–0.74) | <0.0001 |
| L + R frontal superior medial | 10.5 | 0.57 (0.50–0.65) | <0.0001 |
| L insula (lateral) | 4.1 | 0.59 (0.50–0.68) | <0.0001 |
| R insula (medial) | 10.0 | 0.57 (0.49–0.65) | <0.0001 |
NS, not significant; 95% CI, 95% confidence interval.
Figure 4 shows the gender‐ and site‐adjusted relative volumes for three of the clusters in Table IV; data from both hemispheres were combined for this figure. Figure 4a shows the relative amygdala‐hippocampus volume, and Figure 4b shows the rapid decline associated with the dorsolateral frontal cortex. A quadratic fit to these data was also carried out. The age‐squared term was significant only at the cingulate gyrus, which showed a U‐shaped fit of early decline, followed by an asymptote (Fig. 4c).
Figure 4.

Regional volume change (corrected for site and gender) by age for: amygdala‐hippocampus (a); dorsolateral‐frontal cortex (b); cingulate gyrus (c).
DISCUSSION
From an analysis of the MRI scans of 223 normal subjects spanning eight decades, we found strong evidence of marked heterogeneity in the regional rate of GM loss. In comparison to the global GM loss of 0.3%/year, we found accelerated GM loss of almost twice this global rate bilaterally in diffuse clusters located in the dorsolateral frontal cortex, the superior medial frontal gyrus, and the insula. In contrast, clusters of relative GM preservation were seen in limbic, paralimbic, and primary visual cortices with rates of GM loss between one‐half and one‐quarter the global GM rate of loss. These results are consistent with the previous observations of cortical GM loss [Jernigan et al., 2001; Raz et al., 1997; Resnick et al., 2000; Salat et al., 1999, 2001; Sowell et al., 2001, 2003; Tisserand et al., 2000, 2002], but provide compelling new evidence for the comparative preservation of limbic and paralimbic structures.
Relative GM preservation was seen in the limbic and paralimbic regions over the amygdala, hippocampus, thalamus, and extending to the cingulate gyrus. The question of limbic preservation across age has been an equivocal one [Driscoll et al., 2003; Good et al., 2001; Kemper, 2000; Landfield, 1988; Pruessner et al., 2001; Raz et al., 1997; Schuff et al., 1999; Sullivan et al., 1995; Tisserand et al., 2000], and our observations suggest that previous evidence for limbic GM loss may be due largely to the methods used. Two recent studies have found good correlation between VBM methodology and ROI‐based approaches for volumetric measurements of the temporal lobe, and have shown VBM to be more sensitive to changes in hippocampus volume [Good et al., 2002; Testa et al., 2004]. An advantage of the current voxel‐based analysis is that no ROIs are imposed before analysis. A strength of the data presented here is the extremely close matching of the significant voxel clusters identified here with anatomically well‐described structures of the hippocampus, amygdala, and thalamus. This, together with the lack of an a priori regional bias, gives additional weight to our findings of limbic and paralimbic preservation.
Additional strengths of the current study are the inclusion of a large sample, and the very wide age range spanned. A relatively small number of studies have been published with similarly large samples across a wide range of ages. Important recent studies involve analyses of cortical GM changes in a group of 176 healthy subjects [Sowell et al., 2001], and of global GM changes in cohorts of 465 [Good et al., 2001] and 148 adults [Raz et al., 1997].
For the reasons outlined above, our data represents strong evidence for hippocampal preservation during aging. This observation is consistent with two previous observations in large healthy human populations [Good et al., 2001; Raz et al., 1997] and with animal studies that have demonstrated preservation of neuronal numbers in aging rats [Rapp and Gallagher, 1996], and in the hippocampus and entorhinal cortex in aging primates [Keuker et al., 2003; Merrill et al., 2000]. The large degree of similarity that has been observed between age‐related cognitive decline and the deficits observed with bilateral hippocampus damage suggest this region plays a key role in aging [Geinisman et al., 1995]. Our data showing relative GM volume preservation in this structure suggests that global hippocampal volumetric GM loss does not drive age‐related memory decline. Two recent studies have used volumetric methods to demonstrate a direct relationship between hippocampus volume and memory performance: hippocampal atrophy with stress hormone levels [Lupien et al., 1998], and hippocampal hypertrophy in London taxi drivers [Maguire et al., 2003]. Both demonstrations of environmentally induced hippocampus volumetric changes impacting on memory performance provide an interesting contrast to our data, which shows a significant cluster of hippocampal preservation with age. Given the known decline in memory performance with age, the presence of this cluster of hippocampal volumetric preservation suggests that any structural basis for age‐associated cognitive changes is not the result of simple global volumetric loss in this structure. Any structural changes responsible for age‐related memory declines must therefore lie elsewhere in the brain (e.g., the frontal GM loss described here), involve focal hippocampal neuronal loss undetected in this analysis, or else be not reflected in volumetric measurements such as made here. Putative nonvolumetric changes that might affect the hippocampus may involve gene expression, changes at a biochemical level, or connectivity changes between the hippocampus and external structures.
An important limitation of the current study is its cross‐sectional design, which limits the interpretation of our data to associations. One possible way that the cross‐sectional design of this study may systematically distort the current analysis is via the well‐described secular trends of increasing height and weight that were documented over the previous century [e.g., Relethford and Lees, 1981]. Our inclusion of TIV as a covariate should account for any exaggeration of age‐related brain volume decline associated with an underlying trend of increasing body size in younger subjects. Despite this, it is clear that prospective, longitudinal studies are required for verification of the associations described here.
As described above, the lack of any a priori structural bias avoids any operator‐dependent misclassification of structure borders. Although our findings contradict others that show age‐related change in the hippocampus, all of these contradictory analyses have been carried out using smaller groups of subjects. In addition, it has been suggested that previous volumetric studies that have shown contradictory findings might have been affected by misclassification of hippocampus voxels as lateral ventricle mass [Driscoll et al., 2003; Kemper, 2000; Pruessner et al., 2001; Schuff et al., 1999; Tisserand et al., 2000], a problem not encountered using voxel‐based analysis. It is possible that GM/WM contrast changes with age may distort the tissue segmentation process. Although this source of error is certainly a potential confounder of the analysis, it would be expected to contribute to a similar extent to the hand‐drawn ROI methods that are the current “gold standard” of volumetric analysis. Notably, two recent studies have confirmed that VBM is more accurate at identifying hippocampal volume decreases in dementia than are ROI methods [Good et al., 2002; Testa et al., 2004].
A further possible shortfall of VBM analysis is that an apparent dilution of the GM in a region may be simulated by widening of sulci. Similarly, Tisserand et al. [2002] have suggested that VBM analysis has a lower sensitivity to the detection of changes in brain areas with large anatomic variation. This may be especially the case in the temporal regions showing GM loss in our study. The Gaussian kernel used to convolve these data is of width at half height of 10 mm; therefore, it is unlikely that such local dilution of GM secondary to sulci widening would distort the results because the data are not analyzed at a sufficient level of resolution for this to be an issue. It is clear that further investigation is required to investigate this effect.
Thalamic GM preservation is consistent with the critical role it plays as a relay and integrative center. The importance of this role is reflected by the extensive sensory, motor, and other clinical signs that accompany disease in this structure [Mori, 2002]. Our finding of relative preservation of GM bilaterally in the thalamus is in agreement with the results of a previous VBM study [Good et al., 2001].
These results are contradicted by work done recently by Sullivan et al. [2004] using manual labeling analysis techniques that reported a decline in thalamus volume; however, this analysis was based on overall thalamic volume, not the GM content of the thalamus, and so may not be directly comparable. In addition to the preservation seen in the amygdala, hippocampus, and thalamus, three other regions of GM preservation require highlighting. Consistent with other work GM preservation was observed in the anterior cingulate gyrus [Raz et al., 1997]. Sowell et al. [2003] also identified the cingulate gyrus as a region where GM change was more linear and quantitatively less severe than it was elsewhere. The observation of bilateral preservation of GM in the temporal lobe has not been reported previously; however, Sowell et al. [2003] detected a highly nonlinear pattern in this region in which GM volume was stable up until advanced age, producing an inverted U‐shaped distribution of temporal GM against age. The linear analysis employed in this study would be relatively insensitive to such a late decrease in GM. The rate of GM loss in the calcarine sulcus was less than half the global average, a finding supported by Sowell et al. [2003] as a region with a slower, more linear rate of GM change. This region of the primary visual cortex undergoes relatively early maturation and myelination, so is less likely to display postadolescent GM loss secondary to the cortical pruning process that may occur in late‐developing regions of the brain.
In contrast to the subcortical areas of relative preservation, accelerated GM loss was seen bilaterally in cortical regions including the frontal and parietal cortex, the dorsolateral frontal cortex, pre‐ and postcentral gyrus, and inferior and superior parietal lobes. The generalized pattern of frontal‐parietal and accelerated dorsolateral prefrontal GM loss is consistent with that observed previously [Good et al., 2001; Raz et al., 1997; Resnick et al., 2000; Sowell et al., 2003].
These global tissue age‐related volume changes measured here can be interpreted in the light of our findings of subcortical preservation and cortical volume loss, although the cross‐sectional nature of our data and the limitations of MRI as a modality to discriminate between tissue classes prevent any strong mechanistic conclusions to be drawn. The global trend in TIV is very small (<0.2 mL/year), i.e., the total intracranial volume seems relatively constant over the age range studied. It is thus reasonable to assume that any loss in GM is associated with a corresponding rise in CSF or WM. The inverted U‐shape of the WM and the U‐shaped CSF trend is consistent with a hypothesis that early GM loss up to 30–40 years is associated with increasing WM, and that GM loss after 40 years is associated with volume replacement by CSF. These global figures are consistent with previous suggestions regarding postadolescent maturation in the association cortex (involving ongoing myelination and cortical pruning), followed by genuine atrophy at a later age [Sowell et al., 2001, 2003; Yakovlev and Lecours, 1967]. It is worth noting that loss in cognitive function is unlikely to scale in a linear fashion to volumetric GM loss; therefore, our finding of clusters of preservation in the limbic and paralimbic regions do not preclude selective GM loss occurring in these structures having a profound impact on function.
CONCLUSIONS
Our study has identified several intriguing results that both confirm and question previously published data. The large sample size and the increased statistical power this brings, together with the application of a relatively new, automated, and unbiased analysis method (VBM) may account for the novel findings presented here. The findings of this study support the view that subcortical limbic regions are relatively preserved across eight decades, consistent with the early maturation of these regions. By contrast, late‐maturing areas of the association cortex showed accelerated GM loss relative to the global trend. The contrasting stability of brain regions identified in this study may provide a structural basis explaining age‐associated higher level cognitive decline. Further work is required to ascertain in greater detail the temporospatial pattern of GM volumetric loss with age, and to relate this to age‐related cognitive changes. More work is also needed to generate further improvements in the methodology of volumetric analysis, and to investigate to what extent results are modulated by the MRI data from which they are generated.
REFERENCES
- Ashburner J, Friston KJ (2000): Voxel‐based morphometry—the methods. Neuroimage 11: 805–821. [DOI] [PubMed] [Google Scholar]
- Driscoll I, Hamilton DA, Petropoulos H, Yeo RA, Brooks WM, Baumgartner RN, Sutherland RJ (2003): The aging hippocampus: cognitive, biochemical and structural findings. Cereb Cortex 13: 1344–1351. [DOI] [PubMed] [Google Scholar]
- Ey H (1978): Hughlings Jackson's fundamental principles applied to psychiatry In: Riese H, editor. Historical explorations in medicine and psychiatry. New York: Springer; p 204–209. [Google Scholar]
- Friston KJ, Holmes AP, Poline JB, Price CJ, Frith CD (1996): Detecting activations in PET and fMRI: levels of inference and power. Neuroimage 4: 223–235. [DOI] [PubMed] [Google Scholar]
- Geinisman Y, Detoledo‐Morrell L, Morrell F, Heller RE (1995): Hippocampal markers of age‐related memory dysfunction: behavioral, electrophysiological and morphological perspectives. Prog Neurobiol 5: 223–252. [DOI] [PubMed] [Google Scholar]
- Good CD, Johnsrude IS, Ashburner J, Henson RN, Friston KJ, Frackowiak RS (2001): A voxel‐based morphometric study of ageing in 465 normal adult human brains. Neuroimage 14: 21–36. [DOI] [PubMed] [Google Scholar]
- Good CD, Scahill RI, Fox NC, Ashburner J, Friston KJ, Chan D, Crum WR, Rossor MN, Frackowiak RS (2002): Automatic differentiation of anatomical patterns in the human brain: validation with studies of degenerative dementias. Neuroimage 17: 29–46. [DOI] [PubMed] [Google Scholar]
- Hickie IB, Davenport TA, Hadzi‐Pavlovic D, Koschera A, Naismith SL, Scott EM, Wilhelm KA (2001): Development of a simple screening tool for common mental disorders in general practice. Med J Aust 175(Suppl): 10–17. [DOI] [PubMed] [Google Scholar]
- Jernigan TL, Archibald SL, Fennema‐Notestine C, Gamst AC, Stout JC, Bonner J, Hesselink JR (2001): Effects of age on tissues and regions of the cerebrum and cerebellum. Neurobiol Aging 22: 581–594. [DOI] [PubMed] [Google Scholar]
- Kemper T (2000): Neuroanatomical and neuropathological changes during aging and dementia In: Albert M, Knoepfel E, editors. Clinical neurology of aging. New York: Oxford University Press; p 3–67. [Google Scholar]
- Keuker JI, Luiten PG, Fuchs E. (2003): Preservation of hippocampal neuron numbers in aged rhesus monkeys. Neurobiol Aging 24: 157–165 [DOI] [PubMed] [Google Scholar]
- Landfield PW (1988): Hippocampal neurobiological mechanisms of age‐related memory dysfunction. Neurobiol Aging 9: 571–579. [DOI] [PubMed] [Google Scholar]
- Lupien SJ, de Leon M, de Santi S, Convit A, Tarshish C, Nair NP, Thakur M, McEwen BS, Hauger RL, Meaney MJ (1998): Cortisol levels during human aging predict hippocampal atrophy and memory deficits. Nat Neurosci 1: 69–73. [DOI] [PubMed] [Google Scholar]
- Maguire EA, Spiers HJ, Good CD, Hartley T, Frackowiak RS, Burgess N (2003): Navigation expertise and the human hippocampus: a structural brain imaging analysis. Hippocampus 13: 250–259. [DOI] [PubMed] [Google Scholar]
- Merrill DA, Roberts JA, Tuszynski MH (2000): Conservation of neuron number and size in entorhinal cortex layers II, III, and V/VI of aged primates. J Comp Neurol 422: 396–40. [DOI] [PubMed] [Google Scholar]
- Mori E (2002): Impact of subcortical ischemic lesions on behavior and cognition. Ann N Y Acad Sci 977: 141–148. [DOI] [PubMed] [Google Scholar]
- Pruessner JC, Collins DL, Pruessner M, Evans AC (2001): Age and gender predict volume decline in the anterior and posterior hippocampus in early adulthood. J Neurosci 21: 194–200. [DOI] [PMC free article] [PubMed] [Google Scholar]
- Rapp PR, Gallagher M (1996): Preserved neuron number in the hippocampus of aged rats with spatial learning deficits. Proc Natl Acad Sci USA 93: 9926–9930. [DOI] [PMC free article] [PubMed] [Google Scholar]
- Raz N, Gunning FM, Head D, Dupuis JH, McQuain J, Briggs SD, Loken WJ, Thornton AE, Acker JD (1997): Selective aging of the human cerebral cortex observed in vivo: differential vulnerability of the prefrontal gray matter. Cereb Cortex 7: 268–282. [DOI] [PubMed] [Google Scholar]
- Relethford JH, Lees FC (1981): The effects of aging and secular trend on adult stature in rural western Ireland. Am J Phys Anthropol 55: 81–88. [DOI] [PubMed] [Google Scholar]
- Resnick SM, Goldszal AF, Davatzikos C, Golski S, Kraut MA, Metter EJ, Bryan RN, Zonderman AB (2000): One‐year age changes in MRI brain volumes in older adults. Cereb Cortex 10: 464–472 [DOI] [PubMed] [Google Scholar]
- Salat DH, Kaye JA, Janowsky JS (1999): Prefrontal gray and white matter volumes in healthy aging and Alzheimer disease. Arch Neurol 56: 338–344. [DOI] [PubMed] [Google Scholar]
- Salat DH, Kaye JA, Janowsky JS (2001): Selective preservation and degeneration within the prefrontal cortex in aging and Alzheimer disease. Arch Neurol 58: 1403–1408. [DOI] [PubMed] [Google Scholar]
- Schuff N, Amend DL, Knowlton R, Norman D, Fein G, Weiner MW (1999): Age‐related metabolite changes and volume loss in the hippocampus by magnetic resonance spectroscopy and imaging. Neurobiol Aging 20: 279–285. [DOI] [PMC free article] [PubMed] [Google Scholar]
- Sowell ER, Peterson BS, Thompson PM, Welcome, SE , Henkenius AL, Toga AW (2003): Mapping cortical change across the human life span. Nat Neurosci 6: 309–315. [DOI] [PubMed] [Google Scholar]
- Sowell ER, Thompson PM, Tessner KD, Toga AW (2001): Mapping continued brain growth and gray matter density reduction in dorsal frontal cortex: inverse relationships during postadolescent brain maturation. J Neurosci 21: 8819–8829. [DOI] [PMC free article] [PubMed] [Google Scholar]
- Sullivan EV, Marsh L, Mathalon DH, Lim KO, Pfefferbaum A (1995): Age‐related decline in MRI volumes of temporal lobe gray matter but not hippocampus. Neurobiol Aging 16: 591–606. [DOI] [PubMed] [Google Scholar]
- Sullivan EV, Rosenbloom MJ, Serventi KL, Pfefferbaum A (2004): Effects of age and sex on volumes of the thalamus, pons, and cortex, Neurobiol Aging 25: 185–192. [DOI] [PubMed] [Google Scholar]
- Testa C, Laakso MP, Sabattoli F, Rossi R, Beltramello A, Soininen H, Frisoni GB (2004): A comparison between the accuracy of voxel‐based morphometry and hippocampal volumetry in Alzheimer's disease. J Magn Reson Imaging 19: 274–282. [DOI] [PubMed] [Google Scholar]
- Tisserand DJ, Pruessner JC, Sanz Arigita EJ, van Boxtel MP, Evans AC, Jolles J, Uylings HB (2002): Regional frontal cortical volumes decrease differentially in aging: an MRI study to compare volumetric approaches and voxel‐based morphometry. Neuroimage 17: 657–669. [PubMed] [Google Scholar]
- Tisserand DJ, Visser PJ, van Boxtel MP, Jolles J (2000): The relation between global and limbic brain volumes on MRI and cognitive performance in healthy individuals across the age range. Neurobiol Aging 21: 569–576. [DOI] [PubMed] [Google Scholar]
- Tobias PV (2000): Evolution of the human brain In: Gordon E, editor. Intergrative neuroscience: bringing together biological, psychological and clinical models of the human brain. London: Harwood Academic Press; p 37–48. [Google Scholar]
- Tzourio‐Mazoyer N, Landeau B, Papathanassiou D, Crivello F, Etard O, Delcroix N, Mazoyer B, Joliot M (2002): Automated anatomical labeling of activations in SPM using a macroscopic anatomical parcellation of the MNI MRI single‐subject brain. Neuroimage 15: 273–289. [DOI] [PubMed] [Google Scholar]
- Worsley KJ, Marrett S, Neelin P, Vandal AC, Friston KJ, Evans AC (1996): A unified statistical approach for determining significant signals in images of cerebral activation. Hum Brain Mapp 4: 58–73. [DOI] [PubMed] [Google Scholar]
- Yakovlev PI, Lecours AR (1967): The myelogenetic cycles of regional maturation of the brain In: Minkowski A, editor. Development of the brain in early life. Oxford: Blackwell Scientific; p 3–70. [Google Scholar]