

Abstract
Differences in brain activity of children with attention deficit hyperactivity disorder (ADHD) have been compared to normal healthy controls, suggesting neural correlates of cognitive/behavioral symptoms. Symptoms are improved with methylphenidate treatment but limited sources can be cited to show how brain activity in ADHD is altered after pharmacologic treatment. We investigated how long‐term oral medication of methylphenidate affects the resting regional cerebral blood flow (rCBF) in ADHD children, using single photon emission computerized tomography (SPECT). rCBF was decreased in the orbitofrontal cortex and middle temporal gyrus in the right hemisphere whereas it was increased in the dorsomedial prefrontal and somatosensory area bilaterally in drug‐naïve ADHD children compared to control child subjects. After treatment with methylphenidate, the extent of hyperperfusion in the somatosensory area was reduced and significant reduction of rCBF was found in the right striatum for the first time. Methylphenidate treatment also resulted in rCBF increase in superior prefrontal and reduction in ventral higher visual areas bilaterally. The results indicated that improving ADHD symptom after methylphenidate is associated with normalization of abnormally reduced orbitofrontal activity and abnormally increased somatosensory cortical activity. These changes were accompanied with reduced striatum activity lower than that of normal controls. These changes might be associated with improving ADHD to control attention and motor response to irrelevant environmental stimuli after methylphenidate treatment. Hum. Brain Mapp 24:157–164, 2005. © 2004 Wiley‐Liss, Inc.
Keywords: ADHD, methylphenidate, regional cerebral blood flow, SPECT, attention
INTRODUCTION
Attention‐deficit hyperactivity disorder (ADHD) is characterized by developmentally inappropriate impulsivity, inattention, and in some cases, hyperactivity. Researchers have sought anatomic or functional abnormality in patients with ADHD. Several studies have reported abnormal asymmetry patterns in volume of basal ganglia, or smaller volume in corpus callosum or cerebellum compared to that in controls [Casey et al., 1997; Castellanos et al., 1996; Giedd et al., 1994]. Functional imaging studies have reported hypoperfusion in the frontal lobe and striatum and hyperperfusion in somatosensory cortex and occipital cortex in the baseline condition [Lou et al., 1984, 1989], and abnormal activation patterns during mental tasks [Schweitzer et al., 2000b; Vaidya et al., 1998]. Abnormal asymmetry, especially dysfunction of the right prefrontal region within the frontostriatal network, was suggested often in relation with hyperactivity or inattentiveness [Casey et al., 1997; Langleben et al., 2001]. Dopamine dysfunction has been suggested to play a major role in this symptom by affecting neuronal activities in those brain structures [Ernst et al., 1999; Levy and Swanson, 2001].
Early identification and proper treatment of individuals with ADHD increase the likelihood of positive long‐term outcomes. Methylphenidate, a psychostimulant drug, is the treatment used most commonly for ADHD children, and has been shown to improve attention and behavior [Buitelaar et al., 1996; Mayes et al., 1994; Rapport et al., 1994]. Dopaminergic neurotransmitter or receptor imaging is a possible way to delineate effects of dopaminergic stimulants on brain activity. Studies with dopaminergic imaging provides functional information relating only to brain regions where dopamine is utilized heavily [Krause et al., 2000; Volkow et al., 2001a]. Unfortunately, not many studies based on voxel‐by‐voxel comparison for whole brain volume have been done to identify brain areas where children with ADHD show different baseline neuronal activity relative to that in normal controls. Imaging studies to investigate differences in regional cerebral blood flow (rCBF) levels before and after oral methylphenidate treatment in ADHD children have been reported only rarely [Kim et al., 2001; Lou et al., 1984].
We examined rCBF of drug‐naïve ADHD children before and after oral methylphenidate treatment in comparison to control subjects using a voxel‐based analysis, statistical parametric mapping (SPM) [Friston et al., 1994, 1995a, b, 1996]. rCBF was measured with brain single photon emission computed tomography (SPECT) with 99mTc‐hexamethylpropyleneamine oxime (HMPAO) both before and after 1‐month oral methylphenidate treatment. Pretreatment SPECT images of ADHD children were compared to those of control subjects. Posttreatment images were then compared to the same set of control images to examine the methylphenidate‐induced changes in rCBF. The pre‐and posttreatment images from the ADHD children were also compared to each other.
SUBJECTS AND METHODS
Subjects
Forty pediatric patients (mean age, 9.7 ± 2.1 years; male/female = 32/8) who were newly diagnosed as ADHD were included in this study. They fulfilled the criteria in the Diagnostic and Statistical Manual of Mental Disorders, Fourth Edition (DSM‐IV) for ADHD by structured clinical interviews, behavioral assessments, and neuropsychologic batteries. Exclusion criteria included severe mental retardation, any neurologic disorder, or suspected comorbid psychiatric disorders such as depression, oppositional defiant disorder, or conduct disorder. Left‐handed patients were also excluded. After a complete description of the procedures and the scope of study to the patients' parents, their written informed consent was obtained. This study was carried out under the guidelines for the use of human subjects established by the institutional review board at Seoul National University Hospital. Intellectual and learning abilities were assessed using the Wechsler Intelligence Scale for Children–Revised (WISC‐R), and the Luria–Nebraska Neuropsychological Battery. ADHD subjects who were suspected of being afflicted with mental retardation and learning disorders were excluded. Mean and standard deviation (SD) of the WISC‐R scores for patients were 99.7 ± 10.8 (range, 90–123).
Control subjects were collected retrospectively among children who underwent brain SPECT studies at our institute during the past 3 years. Finally, 17 age‐matched children (mean age, 10.5 ± 2.2 years; male/female = 11/6) who met the following criteria were selected as controls. Criteria for normal controls included: (1) no abnormal findings on electroencephalogram (EEG), MRI, and brain SPECT studies; (2) neuropsychologic assessment with no evidence of ADHD or any other psychiatric problem found in the psychiatric interview and clinical scales; and (3) no medical history relating to loss of consciousness, neurologic or psychiatric illness, or serious behavioral problems. Among 17 children, primary diagnoses of 11 were somatoform disorders (their chief complaint was headache related to tension and stress, especially that associated with academic examination). Five control subjects received no diagnoses, but generally their complaints were mild discomfort after minor physical injury including traffic accidents. One control child received a diagnosis of adjustment disorder with mild degree depressive symptoms (she also complained of frequent headache and received play therapy). Those subjects underwent brain SPECT scans to rule out any neurologic or vascular abnormalities. All control subjects were screened by the parental version of the DuPaul ADHD scale and Child Behavior Checklist. No definite meaningful t‐scores in ADHD scales and the Child Behavior Checklist were found. All control children also received WISC‐R; none showed attention problems in the subsets of IQ test. Mean and SD of WISC‐R score were 101.3 ± 11.2 (range, 100–121).
Procedure of Study
After taking medical histories, ADHD severity was assessed initially for the ADHD children using various assessment scales. Disruptive Disorder Scale according to the DSM‐III‐R, Yale Children's Inventory, Child Behavioral Checklist, and Conners' Parent Rating Scale were used to assess patients. Children's Depression Inventory, State‐Trait Anxiety Inventory for Children, and Piers–Harris Self‐Concept Questionnaires were used as self‐rating scales. The Conners' Teacher Rating Scale and School Situation Questionnaires were used as teacher's assessment scales.
After completion of the initial evaluation and before drug therapy, baseline brain perfusion SPECT was carried out. The medication for ADHD, 0.3–1.0 mg/kg/day methylphenidate, was administered orally twice a day at 9:00 am and 2:00 pm. Doses of the drug were adjusted depending on symptomatic responses. The average dose was 0.72 mg/kg/day (mean weight of patients = 24.2 ± 3.4 kg). Drug side effects were monitored. After a 4‐ to 5‐week period of anti‐ADHD therapy, follow‐up brain perfusion SPECT studies were carried out. At that time, patients were reevaluated for assessment of therapeutic effect.
SPECT Imaging Protocol
All subjects were lying in supine position with their eyes closed in a quiet room with dimmed lights. 99mTc‐HMPAO (555 MBq) was administered and the SPECT image acquired using a dual‐head gamma camera (Prism 2000; Picker International, Cleveland, OH) with a low‐energy, high‐resolution parallel‐hole collimator. The energy window was set at 140 keV with a 15% width. One hundred twenty frames were acquired in step‐and‐shoot mode. Each frame continued for 20 sec. Transaxial images were reconstructed as 128 × 128 matrixes and filtered with a Metz filter (x = 1.5–2.0). All images were corrected for attenuation using the method of [Chang 1978].
Image Analysis
SPECT images were analyzed using SPM99 (Statistical Parametric Mapping 99; Institute of Neurology, University College of London, UK), implemented using MATLAB (MathWorks, Natick, MA) [Friston et al., 1994, 1995a, b, 1996]. Before statistical analysis, all images were normalized spatially into SPECT standard templates to remove intersubject anatomic variability [Friston et al., 1995a]. Affine transformations were carried out to determine the 12 optimal parameters with which to register the brain on the template. Small differences between the transformed image and the template were removed using the elastic deformation method. The deformation was controlled so it consisted of a linear combination of predefined smooth basis functions used in discrete cosine transformation. Spatially normalized images were smoothed by convolution, using an isotropic Gaussian kernel with 16‐mm full‐width at half‐maximum (FWHM). The aim of smoothing was to increase the signal‐to‐noise ratio, and to account for subtle variations in anatomic structures. The count of each voxel was normalized to the total count of the brain (proportional scaling in SPM) to remove differences in global CBF between individuals.
After spatial and count normalization, significant differences between SPECT images of ADHD patients and the controls were estimated at every voxel using t‐statistics. In addition, baseline and posttreatment SPECT images of ADHD patients were compared to paired t‐tests. Voxels with a P‐value of less than 0.01 (uncorrected) were considered to be significantly different.
RESULTS
All clinical scales showed improvement in behavioral symptoms, such as decreased hyperactivity and increased attention span, after 4 to 5 weeks of methylphenidate treatment. After methylphenidate treatment, the number of fulfilled DSM‐IV ADHD criteria decreased from 11 at baseline to 4. In five children, the symptoms disappeared completely. In addition, the attention deficit subscale in the Child Behavioral Checklist, attention problems, hyperactivity, and impulsivity subscales in the Yale Children's Inventory, and the hyperactivity index in Conners' Parent Rating Scale were much improved. Such improvements were also observed in school, which were reported as decreased hyperactivity scores in Conners' Teacher Rating Scale (Table I).
Table I.
Mean and Standard Deviation of Rating Scales Scores in Control Children and in ADHD Patients Before and after Methylphenidate Treatment
| Rating scale | ADHD patients | Controls | |
|---|---|---|---|
| Before treatment | After treatment | ||
| Child Behavioral Checklist | |||
| Attention problems | 6.45 (5.8) | 3.44 (2.2)b | 1.44 (2.2)b |
| Delinquent behavior | 1.05 (3.2) | 0.55 (1.1) | 0.55 (1.1)a |
| Aggressive behavior | 4.02 (5.2) | 2.75 (1.8) | 0.75 (1.8)a |
| DuPaul ADHD scale | 24.6 (6.8) | 17.7 (7.6)a | 3.8 (4.2)b |
| Yale Children's Inventory | |||
| Attention problems | 13.7 (4.1) | 5.1 (4.5)c | NC |
| Impulsivity | 7.7 (2.5) | 3.9 (2.7)b | NC |
| Hyperactivity | 8.2 (2.9) | 3.4 (2.2)b | NC |
| Conners Scale | |||
| Conners–parents | 20.3 (4.6) | 10.2 (3.2)c | NC |
| Conners–teacher | 14.9 (3.9) | 8.5 (2.0)c | NC |
P < 0.05;
P < 0.01;
P < 0.001 (significantly different from ADHD patients before treatment).
ADHD, attention deficit and hyperactivity disorder; NC, no change.
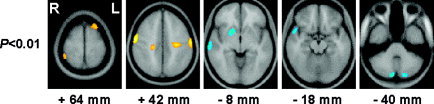
rCBF distribution in untreated ADHD children differed from that in controls. In ADHD children, CBF was decreased in the orbitofrontal and ventral part of middle prefrontal region (Brodmann's area [BA] 10), and middle temporal region (BA 21) in right, and bilateral posterior cerebellar cortices relative to normal controls. Increased rCBF was also found in the superior parietal region including primary sensorimotor areas, and in occipitoparietal junctions, compared to that in the controls (P < 0.01; Fig. 1, Table II).
Figure 1.

Brain areas with significantly increased or decreased cerebral blood flow (CBF) in ADHD children (P < 0.01) as compared to control subjects at baseline. Red‐yellow, increased CBF; blue‐cyan, decreased CBF.
Table II.
Brain Areas with Significant Hypo‐ or Hyperperfusion in ADHD Patients Compared to that in Normal Controls Before Treatment
| Hemisphere | Brain area | BA | Coordinates | Z value | ||
|---|---|---|---|---|---|---|
| x | y | z | ||||
| Hypofusion | ||||||
| Left | Cerebellum | −22 | −84 | −44 | 3.15 | |
| Right | Middle frontal gyrus | 10 | 36 | 54 | −12 | 3.16 |
| Right | Medial frontoorbital gyrus | 11 | 8 | 58 | −20 | 2.89 |
| Right | Cerebellum | 10 | −88 | −34 | 3.03 | |
| Right | Middle temporal gyrus | 21 | 54 | −12 | −12 | 2.73 |
| Hyperfusion | ||||||
| Left | Angular gyrus | 39 | −42 | −50 | 40 | 2.94 |
| Left | Postcentral gyrus | 1, 2, 3 | −56 | −28 | 46 | 2.46 |
| Left | Inferior occipital gyrus | 18, 19 | −40 | −88 | −2 | 3.82 |
| Left | Superior occipital gyrus | 19 | −22 | −90 | 30 | 2.79 |
| Right | Precentral gyrus | 4 | 58 | −6 | 40 | 3.34 |
| Right | Postcentral gyrus | 1, 2, 3 | 46 | −36 | 60 | 3.15 |
| Right | Angular gyrus | 39 | 42 | −50 | 60 | 3.07 |
Threshold: P = 0.01.
BA, Brodmann's area.
Paired t‐tests between pre‐ and posttreatment SPECT images demonstrated an increase of bilateral perfusion in the prefrontal cortex, but a decrease in the occipitotemporal cortex after treatment with methylphenidate for a 1‐month period (P < 0.01; Fig. 2, Table III). There was a trend that CBF was decreased in right basal ganglia and left superior parietal regions and increased in orbitofrontal cortex and anterior cingulate bilaterally (P < 0.05; Fig. 2).
Figure 2.

Brain areas with significantly changed cerebral blood flow (CBF) after methylphenidate treatment (assessed by paired t‐test between baseline and posttreatment conditions) in ADHD patients. Red–yellow, increased CBF after treatment; blue–cyan, decreased CBF after treatment.
Table III.
Brain Areas with Significantly Increased or Decreased Blood Flow in ADHD Patients After Treatment
| Hemisphere | Brain area | BA | Coordinates | Z | ||
|---|---|---|---|---|---|---|
| x | y | z | ||||
| Increased | ||||||
| Left | Middle frontal gyrus | 9 | −42 | 12 | 60 | 3.51 |
| Left | Superior frontal gyrus | 9 | −18 | 34 | 58 | 3.00 |
| Right | Superior frontal gyrus | 9 | 24 | 16 | 66 | 3.11 |
| Decreased | ||||||
| Left | Lingual gyrus | 18 | −18 | −86 | −20 | 3.43 |
| Left | Lateral occipitotemporal gyrus | 37 | −44 | −70 | −6 | 3.31 |
| Left | Inferior occipital gyrus | 18, 9 | −40 | −72 | 4 | 3.15 |
| Right | Middle temporal gyrus | 21 | 42 | −42 | 2 | 3.61 |
| Right | Occipital pole | 18 | 26 | −90 | 6 | 3.29 |
| Right | Lateral occipitotemporal gyrus | 37 | 40 | −70 | 10 | 2.91 |
| Right | Cerebellum | 20 | −42 | 32 | 2.86 | |
Paired t‐tests, threshold: P = 0.01.
BA, Brodmann's area.
When posttreatment SPECT images of ADHD children were compared to those of control subjects, the decrease of rCBF in prefrontal and orbitofrontal cortex was no longer observed. In other words, decreased baseline hypoperfusion of these regions recovered to normal levels. The hyperperfusion in the occipitoparietal junction was no longer observed and the extent of hyperperfusion in superior parietal region was reduced after methylphenidate treatment whereas hypoperfusion in the cerebellar cortex remained unchanged from the pretreatment. In addition, rCBF was increased significantly in the left superior prefrontal cortex and decreased in the right basal ganglia for the first time after treatment (P < 0.01; Fig. 3, Table IV). Hypoperfusion in occipitotemporal regions was also observed for the first time after treatment when a P‐value of 0.05 was used. These findings are consistent with the results of paired t‐tests between baseline and posttreatment SPECT images of ADHD patients.
Figure 3.
Brain areas with significantly increased or decreased cerebral blood flow (CBF) in ADHD children (P < 0.01) as compared to that in control subjects after oral medication with methylphenidate for 4–5 weeks. Red‐yellow, increased CBF; blue‐cyan, decreased CBF.
Table IV.
Brain Areas with Significant Hypo‐ or Hyperperfusion in ADHD Patients Compared to Normal controls After Treatment
| Hemisphere | Brain area | Brodmann's area | Coordinates | Z | ||
|---|---|---|---|---|---|---|
| x | y | z | ||||
| Hypofusion | ||||||
| Left | Cerebellum | −16 | −84 | −38 | 2.77 | |
| Right | Basal ganglia | 20 | 8 | −6 | 3.12 | |
| Right | Cerebellum | 10 | −84 | −38 | 3.04 | |
| Right | Superior, middle temporal gyrus | 21, 22 | 68 | −26 | −2 | 3.02 |
| Hyperfusion | ||||||
| Left | Middle frontal gyrus | 9 | −24 | 26 | 60 | 3.12 |
| Left | Precentral gyrus | 4 | −58 | −12 | 44 | 2.93 |
| Right | Precentral gyrus | 4 | 58 | −6 | 44 | 3.45 |
| Right | Angular gyrus | 39 | 48 | −44 | 60 | 2.77 |
| Right | Postcentral gyrus | 1, 2, 3 | 50 | −24 | 58 | 2.42 |
Threshold: P = 0.01.
DISCUSSION
[Lou et al., 1984, 1989] evaluated resting rCBF in children with ADHD using 133Xe SPECT before and after treatment with methylphenidate. These studies reported that CBF in the striatum was decreased before treatment; methylphenidate increased flow to this region and tended to decrease flow to primary sensory regions. However, the reliability of these pioneering reports may be questioned because spatial resolution of the 133Xe SPECT images used was 17 mm, only a single thick axial slice was examined per subject, most patients had substantial neurologic or developmental impairment as well as ADHD, and controls were not well matched for gender and age. In this study, we overcame limitations of these previous studies by selecting more homogenous subjects with pure ADHD and normal IQ, and using a SPECT camera with better resolution and more reliable image processing methods (voxel‐based SPM).
More recently, using 99mTc‐HMPAO SPECT, we also reported increases of CBF in frontal lobe, caudate nucleus, and thalamus in 32 children with ADHD after methylphenidate treatment [Kim et al., 2001]. However, there were methodologic limitations in that study as well. For example, visual interpretation was carried out on subtraction SPECT images without overlaying them onto the structural images, thus anatomic localization for rCBF change might be less accurate. In addition, region‐of‐interest (ROI) analysis was carried out on only three transaxial slices, which prevented comprehensive assessment of entire brain and standardized anatomic localization.
In the present study, we examined the entire brain by analyzing rCBF changes on a voxel‐by‐voxel basis using the SPM method. Using this method, systematic, quantitative, and objective analysis on the entire volume of interest was possible, which in turn led to the following findings. First, rCBF was decreased in the ventral part of middle prefrontal cortex and orbitofrontal cortex in the right hemisphere in untreated ADHD children. These abnormal decreases of rCBF in right prefrontal regions found were normalized after methylphenidate treatment. Second, after methylphenidate treatment, the abnormally increased rCBF in various brain regions observed before treatment was recovered almost to the level of normal controls. For example, the somatosensory, superior/inferior parietal regions and the medial part of the occipitotemporal area showed hyperperfusion in untreated ADHD children, but the severity and extent of such hyperperfusion were reduced significantly after methylphenidate treatment. Third, rCBF in the right striatum decreased after methylphenidate treatment; however, the treatment resulted in increase of rCBF in the superior region of prefrontal cortices. Fourth, the decreased rCBF in posterior cerebellar cortex in ADHD children was unchanged by treatment. Finally, extensive reduction of rCBF in bilateral occipitotemporal regions was observed, which was most evident in within‐group comparison between pre‐ and posttreatment images of ADHD children.
Normalization of hypoperfusion in the ventral part of middle prefrontal and orbitofrontal cortex in the right hemisphere may be associated with improvement of attention deficit and hyperactivity indicated by diverse behavioral scales. Other imaging studies have elucidated such a relationship between ventral frontal/orbitofrontal regions and problems with behavioral control or impulsivity in drug addiction [Volkow et al., 2001b] or cocaine craving [Bonson et al., 2002].
Methylphenidate also normalized hyperperfusion in the somatosensory regions. The baseline hyperactivity in somatosensory and motor cortices in drug‐naive ADHD patients may be due to their inability to suppress responsiveness to irrelevant sensory stimuli of environment and the resultant hyperactivity in ADHD patients [Aston‐Jones et al., 1999]. This can be either the cause of hyperactivity or the result of the increased motor responsiveness. Considering that the children were restrained in a dimly lit quiet room for HMPAO injection, this baseline increase of somatosensory and motor cortex seems to reflect critical aspects of these symptoms. Methylphenidate may help patients filter unnecessary sensory stimuli and maintain adequate attention via dopamine or serotonin systems in the neocortex, normalizing the hyperarousal state of somatosensory cortex. Studies of ADHD using functional magnetic resonance imaging (fMRI) have suggested that methylphenidate induced increased activation on frontal and striatal regions or hypofrontality in ADHD patents during behavioral inhibition tasks. However, these results were not consistent and depended on the details of task types, type of baseline task, and age of patients [Rubia et al., 1999; Vaidya et al., 1998]. Although fMRI study is helpful to understand phasic and task‐specific changes of neuronal activity, it does not yield any information about the baseline activity. It would be more desirable to interpret results of activation studies differently depending on the background level of perfusion in each region, because baseline frontal or striatum activities in ADHD children are different from normal children.
Baseline perfusion in the right striatum was not different from control subjects before the treatment; however, it was decreased after methylphenidate treatment to below the normal level. Prefrontal activation by methylphenidate might inhibit striatal activity because cortical dopamine activity in the prefrontal area sends inhibitory signal to the striatum through the frontostriatal circuit. This interpretation is in line with the idea that the major pathology of ADHD is prefrontal cortex dysfunction and subsequent striatal hyperactivation. On the other hand, we have also shown normalization of somatosensory cortex hyperperfusion after methylphenidate treatment, and striatal flow may have simply ensued from this decrease. Otherwise, increased dopaminergic transmission in striatum after methylphenidate treatment may have decreased blood flow via dopamine neurotransmission–vascular coupling [Krimer et al., 1998].
Attention has been drawn recently to structural and functional abnormality of the cerebellum in ADHD [Berquin et al., 1998; Mostofsky et al., 1998]. Morphometry of the cerebellum has shown a decrease of posterior vermis volume in ADHD patients. The CBF abnormality was observed in the anterior vermal lobes of the cerebellum in adults with ADHD [Schweitzer et al., 2000b]. The cerebellar hypoperfusion in our results may be related to this abnormality. These findings support the theory of cerebello‐thalamo‐prefrontal circuit dysfunction for ADHD [Levy et al., 2001].
After methylphenidate treatment, extensive CBF decrease was observed in occipitotemporal cortex. Like somatosensory and parietal regions in which CBF was decreased after treatment, the occipitotemporal areas are involved in visual information processing. This might be associated with the fact that ADHD children have a tendency to depend on visual rather than auditory information processing. This interpretation is in agreement with decreased CBF in right auditory cortex in ADHD patients, which was unchanged after treatment. In a recent brain activation study using positron emission tomography (PET), widespread regions in the occipital cortex were activated during an auditory working memory task in drug‐naïve young ADHD adults. This was different from normal volunteers who showed predominantly frontal and temporal activation [Schweitzer et al., 2000b].
CONCLUSIONS
rCBF was decreased in the orbitofrontal cortex and middle temporal gyrus in the right hemisphere whereas it was increased in the dorsomedial prefrontal and somatosensory area bilaterally in drug‐naïve ADHD children compared to control child subjects. After methylphenidate treatment, the prefrontal and orbitofrontal hypoperfusion was relieved, which suggests executive functional capacities are facilitated. In addition, methylphenidate treatment lowered the striatum activity, which suggests reduced motor response output evoked by irrelevant environmental stimuli.
REFERENCES
- Aston‐Jones G., Rajkowski J, Cohen J (1999): Role of locus coeruleus in attention and behavioral flexibility. Biol Psychiatry 46: 1309–1320. [DOI] [PubMed] [Google Scholar]
- Berquin PC. Giedd JN, Jacobsen LK, Hamburger SD, Krain AL, Rapoport JL, Castellanos FX (1998): Cerebellum in attention‐deficit hyperactivity disorder: a morphometric MRI study. Neurology 50: 1087–1093. [DOI] [PubMed] [Google Scholar]
- Bonson KR, Grant SJ, Contoreggi CS, Links JM, Metcalfe J, Weyl HL, Kurian V, Ernst M, London ED (2002): Neural systems and cue‐induced cocaine craving. Neuropsychopharmacology 26: 376–386. [DOI] [PubMed] [Google Scholar]
- Buitelaar JK, van der Gaag RJ, Swaab‐Barneveld H, Kuiper M (1996): Pindolol and methylphenidate in children with attention‐deficit hyperactivity disorder. Clinical efficacy and side‐effects. J Child Psychol Psychiatry 37: 587–595. [DOI] [PubMed] [Google Scholar]
- Casey BJ, Castellanos FX, Giedd JN, Marsh WL, Hamburger SD, Schubert AB, Vauss YC, Vaituzis AC, Dickstein DP, Sarfatti SE, Rapoport JL (1997): Implication of right frontostriatal circuitry in response inhibition and attention‐deficit/hyperactivity disorder. J Am Acad Child Adolesc Psychiatry 36: 374–383. [DOI] [PubMed] [Google Scholar]
- Castellanos FX, Giedd JN, Hamburger SD, Marsh WL, Rapoport JL (1996): Brain morphometry in Tourette's syndrome: the influence of comorbid attention‐deficit/hyperactivity disorder. Neurology 47: 1581–1583. [DOI] [PubMed] [Google Scholar]
- Chang LT (1978): A method of attenuation correction in radionuclide computed tomography. IEEE Trans Nucl Sci 25: 638–643. [Google Scholar]
- Ernst M, Zametkin AJ, Matochik JA, Pascualvaca D, Jons PH, Cohen RM (1999): High midbrain [18F]DOPA accumulation in children with attention deficit hyperactivity disorder. Am J Psychiatry 156: 1209–1215. [DOI] [PubMed] [Google Scholar]
- Friston KJ, Ashburner J, Frith CD, Poline JB, Heather JD, Frackowiak RSJ (1995a): Spatial registration and normalization of images. Hum Brain Mapp 3: 165–189. [Google Scholar]
- Friston KJ, Worsley KJ, Frackowiak RSJ, Mazziotta JC, Evans AC (1994): Assessing the significance of focal activations using their spatial extent. Hum Brain Mapp 1: 210–220. [DOI] [PubMed] [Google Scholar]
- Friston KJ, Holmes AP, Worsley KJ, Poline J‐P, Frith CD, Frackowiak RSJ (1995b): Statistical parametric maps in functional imaging: a general linear approach. Hum Brain Mapp 2: 189–210. [Google Scholar]
- Friston KJ, Holmes A, Poline J‐B, Price CJ, Frith CD (1996): Detecting activations in PET and fMRI: levels of inference and power. Neuroimage 4: 223–235. [DOI] [PubMed] [Google Scholar]
- Giedd JN, Castellanos FX, Casey BJ, Kozuch P, King AC, Hamburger SD, Rapoport JL (1994): Quantitative morphology of the corpus callosum in attention deficit hyperactivity disorder. Am J Psychiatry 151: 665–669. [DOI] [PubMed] [Google Scholar]
- Kim BN, Lee JS, Cho SC, Lee DS (2001): Methylphenidate increased regional cerebral blood flow in subjects with attention deficit/hyperactivity disorder. Yonsei Med J 42: 19–29. [DOI] [PubMed] [Google Scholar]
- Krause KH, Dresel SH, Krause J, Kung HF, Tatsch K (2000): Increased striatal dopamine transporter in adult patients with attention deficit hyperactivity disorder: effects of methylphenidate as measured by single photon emission computed tomography. Neurosci Lett 285: 107–110. [DOI] [PubMed] [Google Scholar]
- Krimer LS, Muly EC 3rd, Williams GV, Goldman‐Rakic PS (1998): Dopaminergic regulation of cerebral cortical microcirculation. Nat Neurosci 1: 286–289. [DOI] [PubMed] [Google Scholar]
- Langleben DD, Austin G, Krikorian G, Ridlehuber HW, Goris ML, Strauss HW (2001): Interhemispheric asymmetry of regional cerebral blood flow in prepubescent boys with attention deficit hyperactivity disorder. Nucl Med Commun 22: 1333–1340. [DOI] [PubMed] [Google Scholar]
- Levy F, Swanson JM (2001): Timing, space and ADHD: the dopamine theory revisited. Aust N Z J Psychiatry 35: 504–511. [DOI] [PubMed] [Google Scholar]
- Lou HC, Henriksen L, Bruhn P (1984): Focal cerebral hypoperfusion in children with dysphasia and/or attention deficit disorder. Arch Neurol 41: 825–829. [DOI] [PubMed] [Google Scholar]
- Lou HC, Henriksen L, Bruhn P, Borner H, Nielsen JB (1989): Striatal dysfunction in attention deficit and hyperkinetic disorder. Arch Neurol 46: 48–52. [DOI] [PubMed] [Google Scholar]
- Mayes SD, Crites DL, Bixler EO, Humphrey FJ 2nd, Mattison RE (1994): Methylphenidate and ADHD: influence of age, IQ and neurodevelopmental status. Dev Med Child Neurol 36: 1099–1107. [DOI] [PubMed] [Google Scholar]
- Mostofsky SH, Reiss AL, Lockhart P, Denckla MB (1998): Evaluation of cerebellar size in attention‐deficit hyperactivity disorder. J Child Neurol 13: 434–439. [DOI] [PubMed] [Google Scholar]
- Rapport MD, Denney C, DuPaul GJ, Gardner MJ (1994): Attention deficit disorder and methylphenidate: normalization rates, clinical effectiveness, and response prediction in 76 children. J Am Acad Child Adolesc Psychiatry 33: 882–893. [DOI] [PubMed] [Google Scholar]
- Rubia K, Overmeyer S, Taylor E, Brammer M, Williams SC, Simmons A, Bullmore ET (1999): Hypofrontality in attention deficit hyperactivity disorder during higher‐order motor control: a study with functional MRI. Am J Psychiatry 156: 891–896. [DOI] [PubMed] [Google Scholar]
- Schweitzer JB, Faber TL, Grafton ST, Tune LE, Hoffman JM, Kilts CD (2000): Alterations in the functional anatomy of working memory in adult attention deficit hyperactivity disorder. Am J Psychiatry 157: 278–280. [DOI] [PubMed] [Google Scholar]
- Vaidya CJ, Austin G, Kirkorian G, Ridlehuber HW, Desmond JE, Glover GH, Gabrieli JD (1998): Selective effects of methylphenidate in attention deficit hyperactivity disorder: a functional magnetic resonance study. Proc Natl Acad Sci USA 95: 14494–14499. [DOI] [PMC free article] [PubMed] [Google Scholar]
- Volkow ND, Wang G, Fowler JS, Logan J, Gerasimov M, Maynard L, Ding Y, Gatley SJ, Gifford A, Franceschi D (2001a): Therapeutic doses of oral methylphenidate significantly increase extracellular dopamine in the human brain. J Neurosci 21: RC121. [DOI] [PMC free article] [PubMed] [Google Scholar]
- Volkow ND, Chang L, Wang GJ, Fowler JS, Ding YS, Sedler M, Logan J, Franceschi D, Gatley J, Hitzemann R, Gifford A, Wong C, Pappas N (2001b): Low level of brain dopamine D2 receptors in methamphetamine abusers: association with metabolism in the orbitofrontal cortex. Am J Psychiatry 158: 2015–2021. [DOI] [PubMed] [Google Scholar]