

Abstract
The goal of this functional magnetic resonance imaging (fMRI) study was to compare the central effects of electroacupuncture at different frequencies with traditional Chinese manual acupuncture. Although not as time‐tested as manual acupuncture, electroacupuncture does have the advantage of setting stimulation frequency and intensity objectively and quantifiably. Manual acupuncture, electroacupuncture at 2 Hz and 100 Hz, and tactile control stimulation were carried out at acupoint ST‐36. Overall, electroacupuncture (particularly at low frequency) produced more widespread fMRI signal increase than manual acupuncture did, and all acupuncture stimulations produced more widespread responses than did our placebo‐like tactile control stimulation. Acupuncture produced hemodynamic signal increase in the anterior insula, and decrease in limbic and paralimbic structures including the amygdala, anterior hippocampus, and the cortices of the subgenual and retrosplenial cingulate, ventromedial prefrontal cortex, frontal, and temporal poles, results not seen for tactile control stimulation. Only electroacupuncture produced significant signal increase in the anterior middle cingulate cortex, whereas 2‐Hz electroacupuncture produced signal increase in the pontine raphe area. All forms of stimulation (acupuncture and control) produced signal increase in SII. These findings support a hypothesis that the limbic system is central to acupuncture effect regardless of specific acupuncture modality, although some differences do exist in the underlying neurobiologic mechanisms for these modalities, and may aid in optimizing their future usage in clinical applications. Hum. Brain Mapping 24:193–205, 2005. © 2004 Wiley‐Liss, Inc.
Keywords: acupuncture methods, current frequencies, human brain mapping, limbic system, electroacupuncture
INTRODUCTION
Understanding the neurobiologic substrates and mechanisms underlying the effects of acupuncture will greatly promote the integration of this ancient healing art into the modern medical mainstream. Although a broad consensus as to the basic mechanisms underlying acupuncture stimulation effects on the central nervous system (CNS) does not yet exist, this system is arguably the most important mediator of acupuncture's multifaceted effects on the body. The term “acupuncture” represents a wide range of techniques with many variables in needle insertion, manipulation, retention, and stimulation. The goal of this functional magnetic resonance imaging (fMRI) study was to compare the central effects of electroacupuncture at different frequencies versus traditional Chinese manual acupuncture. Ultimately, the choice of acupuncture modality should be consistent with evidence‐based medical research. Functional MRI is a powerful neuroimaging technique with capabilities of spatial and temporal resolution that make it an excellent modality to study the response of the brain to acupuncture stimulation [Bandettini et al., 1992; Kwong et al., 1992; Ogawa et al., 1992].
Electroacupuncture (EA) is a technique in which two needles are inserted as electrodes for passing an electric current. At least one of the needles is on an acupoint (a historically and empirically predefined location within the human body). Although electroacupuncture (dating back less than 50 years) is growing in popularity, the more commonly used acupuncture technique, manual acupuncture (MA) involves the insertion of fine needles into acupoints, followed by manual manipulation (dating back more than 2,000 years) such as twisting the needle or lifting and thrusting. One of the main advantages in using EA in clinical practice or acupuncture research is its capacity to set stimulation frequency and intensity objectively and quantifiably.
The response of the brain to MA has been studied using fMRI [Cho et al., 1998; Gareus et al., 2002; Hui et al., 2000; Kong et al., 2002; Wu et al., 1999] and positron emission tomography (PET) [Biella et al., 2001; Hsieh et al., 2001]. Most of these studies demonstrated a broad neuromatrix response that involved the limbic system and limbic‐related brain structures including the amygdala, hippocampus, hypothalamus, cingulate, prefrontal and insular cortices, basal ganglia, and cerebellum.
The rationale for investigating different frequencies of EA comes from the clinical as well as the human and animal experimental domains. In clinical practice, both low‐ and high‐frequency electrostimulation are used often for diverse conditions. Low‐frequency stimulation is specifically recommended for muscular atrophy [Liu, 1998], whereas high‐frequency stimulation is recommended for spinal spasticity [Yuan et al., 1993]. From basic research, several groups have used animal models to explore the effects of varied frequency electrostimulation. Basic animal model research has demonstrated that the frequency‐dependent response may result from association with different CNS targets. For example, rat model microdialysis studies have demonstrated that EA with 2‐Hz stimulation seems to induce acupuncture analgesia by the release of endomorphin, β‐endorphin and enkephalin binding to μ and δ opioid receptors. EA with 100‐Hz stimulation, however, enhances the release of dynorphin binding to the κ opioid receptor in the spinal cord dorsal horn [Han et al., 1999b; Ulett et al., 1998] to produce acupuncture analgesic effect. Furthermore, rat model studies demonstrated that EA increased serotonin synthesis and utilization [Han et al., 1979], specifically in the dorsal raphe and raphe magnus nuclei [Kwon et al., 2000]. In addition, low‐frequency EA has been reported to attenuate a stress‐induced dopamine (DA) increase [Han et al., 1999a; Wang et al., 1999]. Animal neuroimaging using fMRI showed that low‐frequency EA elicited regional cerebral blood volume (CBV) signal decrease in the cingulate cortex, nucleus accumbens, septal nuclei, and amygdala in a rat model [Chen et al., 2001]. In human studies on the central effects of EA, frequency dependence was first noted by electroencephalograph (EEG) response [Saletu et al., 1975]. A recent acupuncture fMRI study found that signal increase in the putamen and insula for low‐frequency EA (3 Hz) contrasted with signal decrease in these structures for MA in normal human subjects [Kong et al., 2002]. Another study reported a frequency‐dependent response in different but overlapping brain networks after transcutaneous electrical nerve stimulation (TENS) over an acupoint [Zhang et al., 2003].
More recently, Wu et al. [2002] investigated the specific and nonspecific effects of low‐frequency EA (4 Hz) by including sham, mock, and minimal sensation EA at acupoint Yanglinquan, GB‐34, on the leg. The results demonstrated greater effect on the limbic and limbic‐related brain structures with real EA than with nonspecific or placebo stimulation. Specifically, the hemodynamic response produced signal increase in notable limbic‐related regions such as the insula, thalamus, cerebellum, and the anterior middle cingulate cortex. Interestingly, however, the subgenual anterior cingulate showed signal decrease.
We compared the hemodynamic response in the brain to EA of low (2 Hz) or high (100 Hz) frequency with the response to MA and a tactile sensory control carried out at ST‐36 (Zusanli, a point over the proximal portion of the tibialis anterior muscle). This is one of the most frequently used acupoints and has been studied in both animal and human acupuncture protocols, allowing for further comparison with our neuroimaging results.
SUBJECTS AND METHODS
Subject Recruitment
This study was carried out on 13 healthy, right‐handed subjects (6 men, 7 women; age range 21–42 years) and was approved by the Massachusetts General Hospital Subcommittee on Human Studies. The subjects included 10 Caucasians, 1 Hispanic, 1 African‐American, and 1 Asian. Subjects were screened and excluded for psychiatric and neurologic disorders, head trauma with loss of consciousness, or other serious cardiovascular, respiratory, or renal illness. Most importantly, all subjects in this study were naïve to acupuncture, having never experienced an acupuncture treatment, although a conceptual familiarity with acupuncture was not considered an exclusion criterion.
Subjects were asked to lie supine on the scanner bed, with eyes closed during experimental runs. They were told their brain would be scanned in response to acupuncture stimulation, and that the stimulation could be manual or electrical, although they were not informed of which before the experimental run. After each run, subjects were questioned as to their psychophysical reaction to the procedure. The order of EA and MA was alternated for different subjects, whereas experimental runs with tactile sensory control stimulation were done before any real acupuncture. Naïve subjects lying supine in an enclosed MRI scanner bore would not be able to differentiate innocuous (sensory control) tapping from acupuncture sensation, until they experienced the latter. The sensory control experiments carried out on a subset of our subjects thus tested the nonspecific placebo‐like effects of acupuncture, in addition to acupoint‐specific nonneedle tactile sensory stimulation.
Subject motion artifact and scanning constraints resulted in a final cohort wherein eight subjects were included in the analysis of manual acupuncture stimulation: 13 for 2‐Hz EA, eight subjects for 100‐Hz EA, and eight for sensory control stimulation. Excessive motion was the exclusion criteria for no more than two subjects for any group.
EXPERIMENTAL PROTOCOL
A separate scan was collected for acupuncture or sensory control stimulation at each acupoint. Sensory control stimulation was completed first. This stimulation consisted of a repetitive tactile stimulation carried out by a different investigator than the one who analyzed the data. The stimulus was a manual tapping at 1 Hz over left ST‐36 with a 5.88 von Frey monofilament. After the control stimulation, the scan order was alternated for each subject and consisted of manual stimulation acupuncture, electroacupuncture with 2‐Hz pulses, and electroacupuncture with 100‐Hz pulses. The acupoint was needled with 0.22‐mm diameter, 40‐mm length pure stainless steel disposable needles (KINGLI Medical Appliance Co., Ltd., Wuxi, China). Needle depth ranged from 1–1.5 cm depending on the size of the tibialis anterior muscle. Manual stimulation at left ST‐36 consisted of “even‐motion” twisting technique at 1 Hz. Acupoints on different legs were used for MA versus EA to avoid receptor accommodation at a single overstimulated acupoint. Electroacupuncture was carried out with one electrode attached to the acupuncture needle in right ST‐36 and another in a shallowly inserted point 1 cm proximal (a non‐acupoint on the ST meridian). Current was delivered with a modified current‐constant HANS (Han's Acupoint Nerve Stimulator) LH202 (Neuroscience Research Center, Peking University, Beijing, China). We used current amplitude that ranged from 0.7–3.6 mA, set midway between the sensory and pain thresholds for each subject. The waveform consisted of biphasic rectangular pulses (pulse width: 1 ms for 2 Hz, 0.2 ms for 100 Hz). Because peripheral neuroreceptors respond directly to current load and normal tissue response alters electrical resistance, it is important to use a current‐constant EA stimulation device. A voltage‐constant device (common in clinical practice) would produce variable current load, and lead to nonuniformity in stimulation intensity.
The total scan time for each run was 7 min (Fig. 1). After the needle(s) were inserted into the acupoint, scanning commenced with a rest period of 2 min (R1). This was followed by two epochs of needle stimulation (S1, S2), each lasting 1 min, separated by a rest interval of 2 min (R2). The run ended with a 1‐min rest interval (R3).
Figure 1.
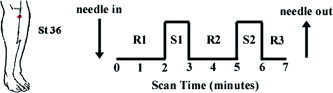
Experimental paradigm and location of acupoint ST‐36 (Zusanli) over the tibialis anterior muscle. Total scan time for each run was 7 min. After needle(s) was inserted into the acupoint, scanning commenced with a rest period of 2 min (R1), followed by two epochs of needle stimulation (S1, S2), each lasting 1 min, separated by a rest interval of 2 min (R2). The run ended with a 1‐min rest interval (R3)..
MR Imaging Parameters
Functional scans were acquired using a 3.0‐Tesla Siemens Allegra MRI System equipped for echo‐planar imaging. Blood oxygenation level‐dependent (BOLD) functional imaging was carried out using a gradient echo T2*‐weighted pulse sequence (TE = 30 ms, TR = 4 s, 105 images per slice, matrix = 64 × 64, field of view [FOV] = 200 mm, flip angle = 90 degrees). We acquired 38 sagittal slices, 3 mm thick with 0.6‐mm gap (voxel size 3.13 × 3.13 × 3 mm). Image collection was preceded by four dummy scans to allow for equilibration of the MRI signal. A 3‐D MPRAGE T1‐weighted high‐resolution structural dataset (TR/TE/FOV = 2.73 s/3.19 ms/256 mm, slice thickness = 1.33 mm, flip angle = 7 degrees, matrix size = 192 × 256) was collected before functional imaging to facilitate Talairach transformation and visualization.
Single Subject Analysis
Images were first motion corrected with AFNI (software for analysis and visualization of fMRI) through an iterated, linearized, weighted least‐squares method with Fourier interpolation [Cox, 1996]. Data runs were excluded if gross translational motion exceeded 3 mm on any axis. Statistical parametric mapping was completed via a generalized linear model by first estimating the impulse response function from the input stimulus function for the entire 7‐min run (block design). This was followed by a convolution of this function with the aforementioned stimulus function. The estimated response function was then compared with a t‐test to the time series data in each brain voxel (3dDeconvolve, AFNI). Fit quality of the full model to the fMRI data was measured by t‐statistic and associated P value based on degrees of freedom (df) calculated from the number of time points (7 min/TR = 105). Percent change was calculated by calculating the percentage deviation of the stimulus blocks in the full model fit from the rest‐block derived baseline model fit. The P value was color‐mapped onto the subject's own high‐resolution T1‐weighted 3D anatomic dataset (in Talairach space). No spatial or temporal preprocessing smoothing was done on the data. Data were thresholded at P < 0.001 (t > 3.38) and a minimum cluster size of 3 voxels. The signal time course was also compared visually with the stimulus paradigm. To address the multiple comparison correction, a Monte Carlo simulation was completed, the results of which demonstrated that our combination of clustering and thresholding produced a false‐positive discovery rate (α of less than 0.4% (AlphaSim, AFNI).
Anatomic analysis was carried out in the frontal, parietal, and temporal cortices, subcortical cerebral gray, as well as in the brainstem. Regions of interest (ROIs) in the frontal cortex included the ventromedial, dorsomedial, and dorsolateral prefrontal areas, precentral gyrus, frontorbital cortex, cingulate gyrus (subgenual, pregenual, anteromiddle, posteromiddle, and posterior), and the dorsomedial, ventromedial, and dorsolateral portions of the frontal pole. In the parietal cortex, we investigated the postcentral gyrus and the inferior parietal lobule, which included the angular and supramarginal gyri. Specifically, SI was defined as the postcentral gyrus (including the homuncular leg region at its mesial surface), whereas SII was defined as the parietal operculum. In the temporal cortex, we included the temporal pole and anterior and posterior insula, hippocampus, and parahippocampus. The subcortical gray included the caudate, nucleus accumbens, putamen, globus pallidus, thalamus (anterior, posterior, middle medial, middle anterolateral, middle posterolateral, lateral, and medial geniculate nuclei), amygdala, hypothalamus, and subthalamic area. Additional cerebral structures considered included the basal forebrain, pineal gland, habenula, and septal area. Brainstem analysis included structures in the midbrain (e.g., ventral tegmental area, red nucleus, and substantia nigra), pons, and medulla. Specifically, the pontine raphe nuclei area was defined as a midsagittal region approximately at the half distance between the fourth ventricle and ventral border of the pons. This region extended the length of the pons and included the nucleus raphe superior and the nucleus raphe pontis in the upper pons, and the nucleus raphe magnus in the lower pons [Parent, 1996]. In all, 52 different regions were defined and investigated for significant fMRI signal response.
The anatomic definitions of the ROIs used in this study were based on methods published previously through the Center for Morphometric Analysis, Department of Neurology, MGH [Caviness et al., 1996; DaSilva et al., 2002; Filipek et al., 1994; Kirifides et al., 2001] and have been applied and adapted in a number of studies [Breiter et al., 1997; Hui et al., 2000; Poellinger et al., 2001]. After these definitions, the anatomic localization and labeling of the functional data was determined by both Talairach coordinates and inspection by our neuroanatomist (N.M.).
Group Subject Analysis
Group averaged analysis also followed the general linear modeling approach. Multiple runs from individual subjects for a given stimulus were averaged. Individual subject data were transformed into Talairach space, normalized to average image intensity, blurred with a spatial Gaussian filter (full‐width half‐maximum [FWHM] = 2 mm) to compensate for any residual differences, and averaged. This adapted fixed‐effect model was thresholded at a more conservative P < 0.0001 (t > 4.06), with a minimum cluster size of 3 voxels (α < 0.1%, AlphaSim).
The results of the group analysis were cross‐referenced systematically with the results of the individual analysis. For every given ROI/brain structure, results were reported only if the individual analysis demonstrated that greater than 60% of subjects at threshold P < 0.001 (t > 3.38, α = 0.4%) corroborated the group analysis result. Furthermore, results would be reported as subthreshold if and only if greater than 50% of individuals corroborated the group results, and greater than 70% of subjects passed under a slightly relaxed threshold of P < 0.005 (t > 2.88, representing α, = 25.9%). If responses in a given region included both signal increase and decrease, the most statistically significant response (P value) was recorded. Statistical parametric maps were displayed along with a representative de‐trended time course that had been filtered with a second order Savitzky‐Golay filter (MATLAB, MathWorks, Natick, MA). For each period in the run, i.e., rest (R1, R2, and R3) or stimulation (S1 and S2), mean signal was overlaid on the time course for clarification purposes only.
RESULTS
fMRI Results
A group analysis comparing MA with 2‐Hz EA, 100‐Hz EA, and tactile sensory control demonstrated notable differences between active acupuncture and control stimulation. EA produced more widespread signal increase, particularly at low frequency. Of 52 regions investigated, MA produced signal increase in seven distinct regions, whereas 2‐Hz EA produced signal increase in 15, and 100‐Hz EA in nine regions. All three acupuncture stimulations (MA, 2‐Hz EA, and 100‐Hz EA) produced more regions of positive and negative hemodynamic signal response than did the tactile sensory control. The data for MA and sensory control are presented in Table I, whereas EA (high and low frequency) data are presented in Table II.
Table I.
Regions of activation for group analysis of manual acupuncture and tactile sensory control
| Structure | Side | Manual | Sensory Control | ||||||||||||
|---|---|---|---|---|---|---|---|---|---|---|---|---|---|---|---|
| Sign | %Δ | P | Talairach (mm) | Proportion | Sign | %Δ | P | Talairach (mm) | Proportion | ||||||
| x | y | z | x | y | z | ||||||||||
| Amyg | L | ↓ | −0.42 | 7.88 | −17 | −8 | −19 | 6/8 | — | — | — | — | — | — | — |
| Hipp‐a | R | ↓ | −0.49 | 6.94 | 17 | −14 | −15 | 7/8 | — | — | — | — | — | — | — |
| L | ↓ | −0.30 | 5.39 | −17 | −12 | −19 | 5/8 | — | — | — | — | — | — | — | |
| Cing‐subgenu | L | ↓ | −0.76 | 5.83 | −5 | 27 | −5 | 5/8 | — | — | — | — | — | — | — |
| Cing‐post | L | (−)* | — | — | — | — | — | — | — | — | — | — | — | — | — |
| Insula‐a | R | ↑ | 0.42 | 7.83 | 38 | 3 | 5 | 7/8 | — | — | — | — | — | — | — |
| L | ↑ | 0.47 | 5.37 | −37 | 9 | −1 | 6/8 | — | — | — | — | — | — | — | |
| Insula‐p | R | ↑ | 0.31 | 5.10 | 34 | −21 | 8 | 6/8 | — | — | — | — | — | — | — |
| L | ↑ | 0.41 | 4.33 | −36 | −3 | −1 | 7/8 | — | — | — | — | — | — | — | |
| Thal‐mm | R | ↑ | 0.70 | 6.60 | 5 | −13 | 10 | 5/8 | — | — | — | — | — | — | — |
| L | ↑ | 0.30 | 4.93 | −6 | −16 | 9 | 5/8 | — | — | — | — | — | — | — | |
| FrontalPole‐dm | L | ↓ | −0.60 | 4.74 | −6 | 63 | 11 | 7/8 | — | — | — | — | — | — | — |
| FrontalPole‐l | R | ↑ | 0.81 | 4.73 | 30 | 58 | 19 | 7/8 | — | — | — | — | — | — | — |
| L | ↑ | 0.36 | 6.10 | −26 | 54 | 22 | 7/8 | — | — | — | — | — | — | — | |
| PrFr‐vm | R | ↓ | −0.66 | 6.24 | 2 | 47 | −6 | 7/8 | — | — | — | — | — | — | — |
| L | ↓ | −0.59 | 4.80 | −3 | 47 | −7 | 7/8 | — | — | — | — | — | — | — | |
| PrFr‐dm | R | ↓ | −0.49 | 9.72 | 5 | 47 | 35 | 5/8 | — | — | — | — | — | — | — |
| L | ↓ | −0.39 | 4.72 | −5 | 47 | 17 | 7/8 | — | — | — | — | — | — | — | |
| PrFr‐dl | R | ↑ | 0.35 | 5.69 | 52 | 41 | 5 | 7/8 | — | — | — | — | — | — | — |
| L | ↑ | 0.42 | 5.05 | −53 | 41 | 17 | 5/8 | ↑ | 0.42 | 4.11 | −11 | 38 | 50 | 6/8 | |
| TempPole | R | ↓ | −0.37 | 5.07 | 30 | 19 | −21 | 6/8 | — | — | — | — | — | — | — |
| L | ↓ | −0.53 | 5.65 | −50 | 13 | −12 | 8/8 | — | — | — | — | — | — | — | |
| IPL | R | ↑ | 0.45 | 9.70 | 52 | −35 | 32 | 7/8 | — | — | — | — | — | — | — |
| L | ↑ | 0.48 | 8.59 | −55 | −35 | 37 | 8/8 | ↑ | 0.57 | 6.05 | −59 | −39 | 35 | 6/8 | |
| SII | R | ↑ | 0.44 | 11.94 | 52 | −27 | 22 | 7/8 | ↑ | 0.48 | 6.06 | 52 | −24 | 14 | 5/8 |
| L | ↑ | 0.57 | 9.11 | −53 | −27 | 25 | 8/8 | ↑ | 0.59 | 7.10 | −62 | −18 | 23 | 6/8 | |
The left side was ipsilateral and the right side was contralateral to the stimulation. Sign indicates whether the structure showed a signal increase or decrease. Percent Δ indicates signal intensity, whereas P value (expressed as 10−x) indicates statistical significance of general linear model (GLM) model fit. Talairach coordinates of the activated cluster are presented with x (medial–lateral), y (anterior–posterior), and z (superior–inferior). The proportion of individual subjects who demonstrated changes seen with group analysis is also given. Subthreshold response denoted by (*). L, left; R, right; Amyg, amygdala; Cing‐subgenu, subgenual cingulate; Cing‐post, posterior cingulate; FrontalPole‐dm, dorsomedial frontal pole; FrontalPole‐1, lateral frontal pole; Hipp‐a, anterior hippocampus; IPL, inferior parietal lobule; Insula‐a, anterior insula; Insula‐p, posterior insula; PrFr‐vm, ventromedial prefontal area; PreFr‐dl, dorsolateral prefrontal cortex; SII, secondary somatosensory cortex; TempPole, temporal pole; Thal‐mm, medial middle thalamus.
Table II.
Regions of activation for group analysis of electroacupuncture of high (100 Hz) and low (2 Hz) frequency
| Structure | Side | 2‐Hz Electroacupuncture | 100‐Hz Electroacupuncture | ||||||||||||
|---|---|---|---|---|---|---|---|---|---|---|---|---|---|---|---|
| Sign | %Δ | P | Talairach (mm) | Proportion | Sign | %Δ | P | Talairach (mm) | Proportion | ||||||
| x | y | z | x | y | z | ||||||||||
| Amyg | L | ↓ | −0.29 | 4.47 | −16 | −8 | −19 | 8/13 | ↓ | −0.37 | 9.21 | −20 | −2 | −21 | 5/8 |
| Hipp‐a | R | ↓ | −0.51 | 6.98 | 26 | −17 | −11 | 9/13 | (−)* | — | — | — | — | — | — |
| L | (−)* | — | — | — | — | — | — | (−)* | — | — | — | — | — | — | |
| ParaHipp‐p | L | — | — | — | — | — | — | — | (−)* | — | — | — | — | — | — |
| FOC | R | ↑ | 0.21 | 4.90 | 34 | 25 | −6 | 12/13 | ↓ | −0.52 | 6.36 | 34 | 46 | −4 | 8/8 |
| L | — | — | — | — | — | — | — | ↓ | −0.48 | 6.23 | −33 | 35 | −9 | 8/8 | |
| Cing‐subgenu | L | ↓ | −0.69 | 6.81 | 3 | 20 | −1 | 8/13 | ↓ | −0.91 | 5.61 | 1 | 28 | −4 | 5/8 |
| Cing‐am | R | ↑ | 0.40 | 8.09 | 5 | 14 | 39 | 9/13 | — | — | — | — | — | — | — |
| L | ↑ | 0.31 | 7.26 | −7 | 10 | 32 | 9/13 | ↑ | 0.28 | 4.36 | −4 | 11 | 36 | 5/8 | |
| Cing‐pm | R | ↑ | 0.44 | 4.90 | 2 | −8 | 44 | 8/13 | — | — | — | — | — | — | — |
| Cing‐post | L | (−)* | — | — | — | — | — | — | ↓ | −0.37 | 6.58 | −4 | −50 | 21 | 5/8 |
| Insula‐a | R | ↑ | 0.40 | 10.39 | 33 | 13 | 7 | 9/13 | ↑ | 0.39 | 9.34 | 34 | 13 | 5 | 5/8 |
| L | ↑ | 0.38 | 6.74 | −33 | 17 | 4 | 11/13 | (+)* | — | — | — | — | — | — | |
| Insula‐p | R | ↑ | 0.38 | 4.14 | 37 | −2 | −3 | 10/13 | — | — | — | — | — | — | — |
| L | ↑ | 0.56 | 7.86 | −38 | −5 | 2 | 9/13 | ↑ | 0.40 | 10.44 | −32 | −17 | 10 | 7/8 | |
| SeptalArea | R | ↓ | −0.46 | 5.20 | 5 | 10 | −4 | 8/13 | ↓ | −0.45 | 6.00 | 4 | −11 | −3 | 5/8 |
| Putamen‐a | L | ↑ | 0.25 | 5.90 | −21 | 0 | 8 | 8/13 | — | — | — | — | — | — | — |
| Thal‐a | R | ↑ | 0.68 | 5.81 | 3 | −6 | 11 | 8/13 | — | — | — | — | — | — | — |
| Thal‐mm | L | (+)* | — | — | — | — | — | — | — | — | — | — | — | — | — |
| FrontalPole‐vm | R | ↓ | −0.88 | 4.31 | 4 | 60 | −9 | 10/13 | ↓ | −1.09 | 7.01 | −2 | 60 | −6 | 7/8 |
| FrontalPole‐dm | R | — | — | — | — | — | — | — | ↓ | −0.48 | 5.72 | 5 | 60 | 11 | 6/8 |
| L | ↓ | −0.56 | 6.37 | −2 | 61 | 10 | 11/13 | ↓ | −0.41 | 6.60 | −2 | 60 | 8 | 6/8 | |
| FrontalPole‐l | R | ↑ | 0.58 | 6.62 | 25 | 55 | 29 | 12/13 | ↑ | 0.50 | 7.94 | 27 | 55 | 25 | 7/8 |
| L | ↑ | 0.53 | 7.57 | −20 | 55 | 28 | 12/13 | ↑ | 0.75 | 7.03 | −37 | 55 | 8 | 7/8 | |
| PrFr‐vm | R | ↓ | −1.31 | 8.16 | 2 | 32 | −9 | 10/13 | ↓ | −1.21 | 6.58 | 2 | 39 | −11 | 8/8 |
| L | ↓ | −1.30 | 7.59 | −2 | 32 | −9 | 10/13 | ↓ | −1.20 | 5.90 | −2 | 39 | −11 | 6/8 | |
| PrFr‐dm | R | ↑ | 0.86 | 9.69 | 4 | 52 | 41 | 11/13 | ↑ | 0.32 | 4.03 | 4 | 9 | 51 | 6/8 |
| L | ↑ | 0.41 | 8.20 | −2 | 25 | 44 | 9/13 | ↑ | 0.25 | 4.01 | −2 | 10 | 55 | 6/8 | |
| PrFr‐dl | R | ↑ | 0.52 | 6.72 | 58 | 15 | 22 | 12/13 | ↑ | 0.29 | 4.87 | 53 | 9 | 25 | 8/8 |
| L | ↑ | 0.50 | 8.69 | −53 | 12 | 11 | 10/13 | ↑ | 0.39 | 4.45 | −40 | 25 | 41 | 7/8 | |
| TempPole | R | — | — | — | — | — | — | — | ↓ | −0.47 | 8.17 | 40 | 13 | −33 | 7/8 |
| L | ↓ | −0.56 | 4.55 | −25 | 16 | −27 | 10/13 | ↓ | −0.37 | 6.70 | −41 | 12 | −27 | 7/8 | |
| IPL | R | ↑ | 0.31 | 8.51 | 55 | −44 | 35 | 12/13 | ↑ | 0.49 | 8.66 | 46 | −47 | 38 | 7/8 |
| L | ↑ | 0.37 | 8.83 | −51 | −43 | 26 | 11/13 | ↑ | 0.48 | 9.53 | −53 | −44 | 28 | 6/8 | |
| NRaphPont | ↑ | 0.37 | 6.79 | 2 | −23 | −24 | 9/13 | — | — | — | — | — | — | — | |
| SI | L | ↑ | 0.36 | 7.21 | −5 | −42 | 69 | 8/13 | ↑ | 0.41 | 4.68 | −10 | −41 | 69 | 5/8 |
| SII | R | ↑ | 0.39 | 9.27 | 49 | −27 | 23 | 11/13 | ↑ | 0.44 | 7.78 | 56 | −27 | 26 | 6/8 |
| L | ↑ | 0.62 | 15.45 | −45 | −27 | 23 | 12/13 | ↑ | 0.35 | 7.57 | −51 | −27 | 22 | 8/8 | |
The right side was ipsilateral, whereas the left side was contralateral to the stimulation. Sign indicates whether the structure showed a signal increase or decrease. Percent Δ indicates signal intensity, whereas P value (expressed as 10−x) indicates statistical significance of general linear model (GLM) model fit. Talairach coordinates of the activated cluster are presented with x (medial–lateral), y (anterior–posterior), and z (superior–inferior). The proportion of individual subjects who demonstrated changes seen with group analysis is also given.
Subthreshold response. Cing‐pm, posteromiddle cingualte; FOC, orbito‐frontal cortex; NRaphPont, nucleus raphe pontis; Para‐Hipp‐p, posterior parahippocampus; Putamen‐a, anterior putamen; SI, primary somatosensory cortex; Thal‐a, anterior thalamus. Definitions for other abbreviations are provided in the legend for Table I.
Predictably, the secondary somatosensory cortex (parietal operculum, SII) demonstrated a positive hemodynamic response for all experimental stimulations. The homuncular leg topographic representation in the primary somatosensory cortex (SI) demonstrated positive hemodynamic response for both high and low frequency EA (Fig. 2).
Figure 2.
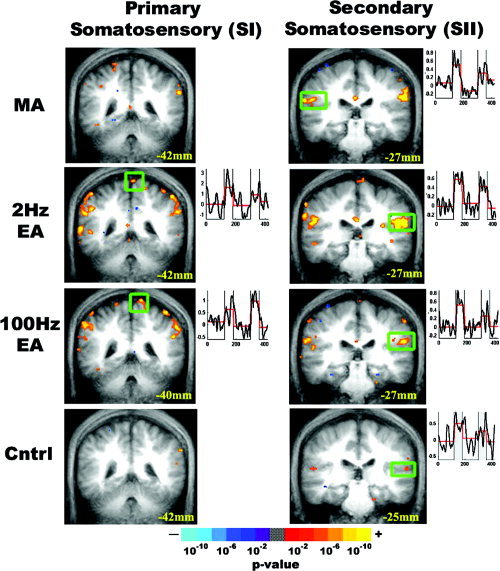
Somatosensory cortex response to experimental stimulation. Statistical parametric maps for group analysis of MA, EA, and sensory control are displayed over the group averaged anatomic MRI brain scan. Coronal slices are presented with their Talairach space location. Clusters with statistically significant response were smoothed, and color‐coded based on P value (see color bar). Time courses from the boxed region are displayed to the right of each image, demonstrating hemodynamic response. All stimulations produced activation of the contralateral and ipsilateral secondary somatosensory cortex (SII), whereas only high‐ and low‐frequency EA produced activation of the leg homuncular region in the contralateral primary somatosensory cortex (SI).
Within the limbic system, the amygdala, subgenual and retrosplenial cingulate, and anterior hippocampus demonstrated signal decrease for all modes of acupuncture (Fig. 3). The contralateral anterior middle cingulate demonstrated a positive signal response for EA but not for MA or tactile sensory control, whereas the septal area demonstrated signal decrease only for EA stimulation.
Figure 3.
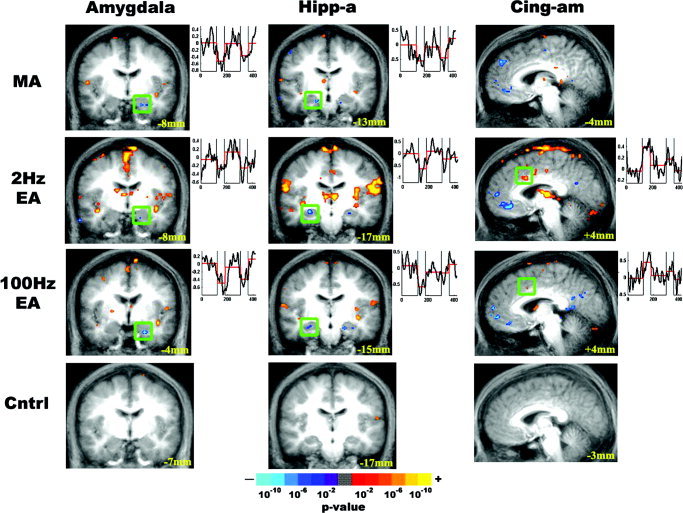
Limbic system response to experimental stimulation. The results of group analysis for MA, EA, and tactile sensory control are presented. Activated or deactivated regions are color‐coded based on P value. Time courses from the boxed region are displayed to the right of each image. All acupuncture stimulation modalities produced signal decrease in the amygdala and the anterior hippocampus, a result not seen with sensory control stimulation. The contralateral anteriomiddle cingulate (BA 24, 32) demonstrated positive signal response for EA but not for MA or sensory control.
Several limbic‐related cortical and brainstem regions also demonstrated a statistically significant hemodynamic response (Fig. 4). The dorsomedial frontal pole, ventromedial prefrontal area, and temporal pole demonstrated signal decrease and the anterior insula demonstrated signal increase for all acupuncture modalities, whereas the dorsolateral frontal area and inferior parietal lobule demonstrated signal increase for both verum acupuncture and sensory control. There was a positive hemodynamic response in the nucleus raphe pontis [Haines, 1991; Paxinos and Huang, 1995] for 2‐Hz EA. The middle medial thalamus demonstrated a positive signal response for MA and 2‐Hz EA, although individual subject corroboration for 2‐Hz EA did not clear our set criteria (Table II).
Figure 4.
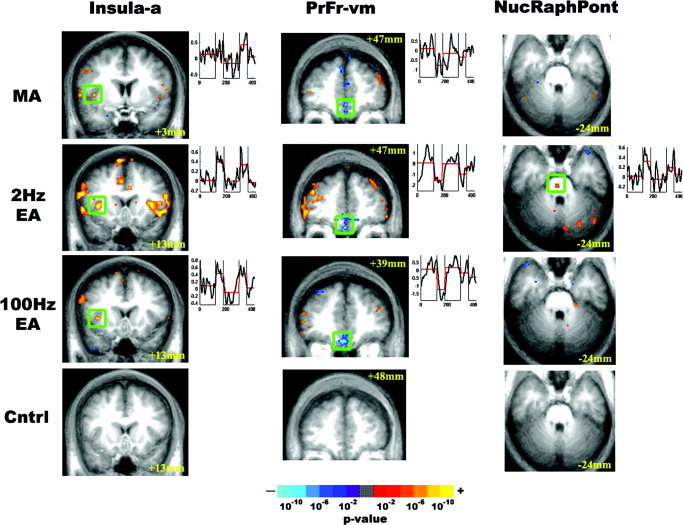
Response of limbic related structures to experimental stimulation. The results of group analysis for MA, EA, and sensory control were color‐coded based on P value and presented as activated or deactivated regions. Although all acupuncture stimulations produced signal decrease in the ventromedial prefrontal cortex and signal increase in the anterior insula, only 2‐Hz EA produced signal increase in the nucleus raphe pontis. Tactile sensory control stimulation did not produce significant response in these regions.
The mean EA current intensity used for 2‐Hz EA (2.15 ± 0.25 mA) was significantly greater than was the current intensity used for 100‐Hz EA (1.19 ± 0.17 mA; P < 0.005, paired t‐test). Furthermore, no runs produced sharp pain alone without other typical acupuncture sensations, and no runs were discounted for this reason; however, two subjects undergoing manual stimulation did experience a mixed sensation of sharp pain in addition to other acupuncture sensations (e.g., pressure, heaviness, aching, tingling). No subjects in the 2‐Hz or 100‐Hz EA arm of the study experienced sharp pain.
DISCUSSION
There is a growing body of evidence demonstrating CNS response to acupuncture. Our study is the first to report a comparison of brain hemodynamic response to MA and EA at both low and high frequencies in the same cohort of subjects. The significant results from our analysis are summarized in Table III. Specifically, EA produced more widespread signal increase than did MA, whereas minor differences were seen between EA of two different frequencies. We found both significant similarities and differences in the response of the brain to acupuncture stimulation, as well as a tactile sensory control.
Table III.
Summary of significant hemodynamic response increase and decrease in several important cortical and subcortical structures for manual acupuncture, electroacupuncture, and tactile sensory control
| Amyg | Hipp‐a | Cing‐subgenu | Cing‐am | Insula‐a | PrFr‐vm | NucRaph Pont | SI (leg) | SII | |
|---|---|---|---|---|---|---|---|---|---|
| MA | ↓ | ↓ | ↓ | — | ↑ | ↓ | — | — | ↑ |
| 2‐Hz EA | ↓ | ↓ | ↓ | ↑ | ↑ | ↓ | ↑ | ↑ | ↑ |
| 100‐Hz EA | ↓ | ↓ | ↓ | ↑ | ↑ | ↓ | — | ↑ | ↑ |
| Control | — | — | — | — | — | — | — | — | ↑ |
Manual acupuncture (MA), 2‐Hz electroacupuncture (EA), and 100‐Hz EA were similar in that they all produced signal decrease in the amygdala, (Amyg), anterior hippocampus (Hipp‐a), subgenual cingulate (Cing‐subgenu), and ventromedial prefrontal area (PrFr‐vm), and signal increase in SII. Both 2‐ and 100‐Hz EA produced signal increase in the anterior middle cingulate (Cing‐am) and the leg topographic region of S1, whereas 2‐Hz EA produced a signal increase in nucleus raphe pontis (NucRaphPont). Tactile sensory control produced signal increase in S2.
fMRI Results in Limbic Regions
The limbic system forms a widely interconnected network with structures at multiple levels of the brain, and is crucial in the integration and synchronized modulation of sensorimotor, autonomic, and endocrine functions, cognition, mood, and motivated behavior. All acupuncture stimulations produced signal decrease in multiple corticolimbic regions including the amygdala, anterior hippocampus, and subgenual cingulate cortex (Fig. 3). These responses were not seen with tactile sensory control. The amygdala and hippocampus direct cortical inputs to the regulatory systems of the hypothalamus and brainstem, which then project broadly to tune the arousal and motivational state of the entire neuraxis [Tucker et al., 2000]. The amygdala plays a crucial role in affect, especially in fear and defensive behavior. It is also implicated in the processing of pain [Bingel et al., 2002; Bornhord et al., 2002; Jasmin et al., 2003] and motivational stimuli [Zald, 2003]. The hippocampus links affective states with memory processing. Recent reports suggest that acupuncture at ST‐36 was effective in limiting ischemia‐induced apoptosis [Jang et al., 2003], stress‐induced changes in brain‐derived neurotrophic factor (BDNF) mRNA [Yun et al., 2002], and epilepsy‐induced nitric oxide synthase increase [Yang et al., 1999] in the hippocampus in animal models. The signal decrease we observed in the amygdala and anterior hippocampus is consistent with past acupuncture fMRI studies at LI‐4 and GB‐34, as well as ST‐36 [Hui et al., 1997, 2000; Wu et al., 1999, 2002; Zhang et al., 2003]. Moreover, the lack of limbic response for our placebo‐like sensory control was congruent with a study by Mayberg et al. [2002], which demonstrated that archicortical regions such as the amygdala and hippocampus were less susceptible to placebo effect than were neocortical regions. Data obtained by different acupuncture techniques and at multiple acupoints thus strongly suggest that the corticolimbic network may be an important pathway by which acupuncture produces modulatory effects and clinical efficacy.
Differences between active acupuncture and tactile sensory control could also be seen in the cingulate. Both high‐ and low‐frequency EA produced signal increase in the contralateral anteriomiddle cingulate (Brodmann area [BA] 24, 32). Sensory control did not produce a response in the anterior middle cingulate. The anterior cingulate cortex (ACC) and foci in BA 24 and 32 have been implicated in the affective dimension of pain (e.g., through projections from the medial thalamus), as well as in attention and decision‐making [Peyron et al., 2000]. It has been suggested that the ACC has discrete functional regions, and the loci of activation seen in the anteriomiddle cingulate for 2‐Hz and 100‐Hz EA have also been reported in surface electrode‐induced median nerve pain [Davis et al., 1997]. Moreover, the different response in the anteriomiddle cingulate for EA versus MA may also reflect differences in specific sensations elicited by electrical versus manual stimulation of the needle; as different sensations have been localized previously to different loci in the ACC [Davis et al., 2002]. In fact, it has been demonstrated that qualitatively different sensations are also processed through different receptor types and afferent tracts [Kandel et al., 2000]. For example, “pressure” is sensed by the Merkel disk receptor and carried by Aα and Aβ fiber types, whereas sharp pain is sensed by mechanical nociceptors and carried by Aδ fiber tracts.
In addition, signal decrease was seen in the subgenual and retrosplenial cingulate cortices for active acupuncture, and not for tactile sensory control, a result consistent with other acupuncture fMRI studies [Hui et al., 2001; Kong et al., 2002; Wu et al., 1999, 2002]. High‐frequency EA also produced signal decrease in the retrosplenial cingulate, whereas low‐frequency EA produced both subthreshold increase and decrease. The retrosplenial cingulate is emerging as an important substrate of emotional activity [Maddock, 1999], and may play an important role in the modulation of the affective dimension of pain after acupuncture treatment.
Signal decrease seen in the septal area during EA was notable, as this limbic region receives afferent inputs from other limbic structures and the olfactory system. The septal area also sends efferents to the hypothalamus, and has been associated with the emotions of pleasure and self‐reward [Gulia et al., 2002]. Although several acupuncture imaging reports demonstrated hypothalamic activation [Hsieh et al., 2001; Wu et al., 1999], we did not observe significant response in this region. The lack of hypothalamic activation may be due to the decreased activity we found in the amygdala and anterior hippocampus, which play an important role in modulating hypothalamic activity [Squire et al., 2003].
In addition, all acupuncture stimulations demonstrated signal decrease in the medial frontal pole (dorsomedial or ventromedial frontal pole) and medial prefrontal areas (ventral, ventromedial, dorsomedial), and signal increase in the lateral frontal pole and prefrontal areas. The response in the frontal cortex (responsible for many higher cognitive functions) was more robust for active acupuncture than for sensory control. Recent reports indicate the presence of links between the frontal cortex and the limbic system, and cognition likely has an important role in modulating affect and pain processing [Casey, 1999].
Statistically significant responses were also seen in several other important limbic‐related regions. Specifically, active acupuncture produced signal increase in the anterior insula, which has been implicated in the sensory discriminative dimension of visceral pain [Peyron et al., 2000]. The anterior insula sends sensory information to the amygdala [Shi and Cassell, 1998] and cingulate. In fact, the insular–amygdaloid connection has been implicated specifically in pro‐nociception and hyperalgesia [Jasmin et al., 2003]. For all three acupuncture modalities in this study, the insula demonstrated signal increase, whereas the amygdala demonstrated signal decrease. Other inputs to the amygdala (e.g., prefrontal cortex) therefore may have overridden the pro‐nociceptive inputs from the insular cortex, thereby producing a depression of the negative affect nociceptive circuit. Tactile control stimulation over the acupoint did not produce any response in the anterior insula.
fMRI Results in the Brainstem
The oft‐mentioned acupuncture pain inhibition network involving endorphin release through the periaqueductal gray (PAG) or the descending serotonergic system through the raphe magnus nuclei [Parent, 1996] has not been noted explicitly in other acupuncture fMRI studies. In mouse studies, high‐frequency EA analgesia was attenuated by parachlorophenylalanine (a 5‐HT synthesis inhibitor) and not naloxone (an endorphin antagonist), whereas the converse was true for low‐frequency EA [Cheng and Pomeranz, 1979, 1981]. These results suggested that low‐frequency EA may be mediated by opioid analgesia, whereas high‐frequency EA analgesia may be mediated more by the descending serotonergic system. In our study, low‐frequency EA produced an increase in hemodynamic response in the nucleus raphe pontis, whereas no response in this region was seen with high‐frequency EA, MA, or sensory control. The nucleus raphe pontis participates in the cerebellar and subcortical (ascending) serotonergic system [Parent, 1996]. Notably, the ascending serotonergic system has also been implicated in low‐frequency EA analgesia by rat studies [Han et al., 1979].
fMRI Results in the Somatosensory Cortices
All stimulation types produced signal increase in the secondary somatosensory cortex, SII (Fig. 2). Furthermore, EA (2 and 100 Hz) demonstrated signal increase in the homuncular leg topographic representation of SI. The signal increase seen in the somatosensory cortices (especially SII) across all stimulations were expected. Kong et al. [2002] reported a higher magnitude response with EA (3 Hz) than with MA for contralateral SII. Our results for low‐frequency EA also demonstrated a greater magnitude response (0.62%) than did those for MA (0.44%). Signal increase in SII is seen commonly also in sensory and pain fMRI studies, and has been noted more frequently than increase in the primary somatosensory cortex, SI [Hui et al., 2000]. In our group analysis results, only EA produced a positive response in the appropriate homuncular region of SI. Lack of SI activation for MA and tactile sensory control may have arisen from individual sulcal anatomic variability, as we stimulated an acupoint with a small homuncular representation region (knee/leg). In fact, individual analysis of the MA and sensory control subgroups demonstrated that six of eight subjects (one subthreshold) activated SI on their individual scans for MA and five of eight subjects (two subthreshold) activated SI on individual scans for sensory control stimulation. Electrostimulation is a grosser activator of somatosensory receptors and fiber types, whereas manual stimulation and tactile control stimulation may preferentially activate specific receptors. (e.g., for vibratory stimuli, low‐frequency flutter stimulates Meissner corpuscles; high‐frequency vibration stimulates Pacinian corpuscles, producing variable fMRI activation [Harrington and Hunter Downs, 2001]). In addition, SI activation is highly susceptible to cognitive factors such as attention [Bushnell et al., 1999], and although all subjects were instructed to place attention on the site of stimulation, some variability in performance may have existed. Moreover, although other fMRI studies of EA have demonstrated signal increase in SI, studies of MA have been less consistent [Gareus et al., 2002; Kong et al., 2002; Wu et al., 2002; Zhang et al., 2003]. In fact, an inconsistency in SI activation also extends to classic pain imaging studies, where much stronger intensity stimulations are used [Bushnell et al., 1999].
Is Acupuncture the Same as Pain Stimulus?
In our results, signal increase in those brain regions that have been implicated in the pain‐related neuromatrix does not necessarily infer that acupuncture effects arise from a pain stimulus. Sharp pain was seldom experienced during active acupuncture, and although certain acupuncture sensations can include correlates of dull pain (e.g., soreness, aching), the fMRI results demonstrated important differences between acupuncture and previous reports of acute pain fMRI. For example, the signal decrease seen with active acupuncture (amygdala, hippocampus, temporal and frontal pole), was in contrast with signal increase typically reported in acute pain fMRI studies [Becerra et al., 2001; Bingel et al., 2002; Bornhovd et al., 2002]. In fact, pain imaging studies have even suggested that effective cognitive coping mechanisms may involve a suppression of activity (signal decrease) in limbic and limbic‐related structures [Petrovic and Ingvar, 2002].
For low‐frequency EA, we used a current intensity of 2.15 ± 1.12 mA (intensity was set midway between the sensory and pain thresholds). This was considerably lower than the current intensity used by Wu et al. [2002] (5.41 ± 2.01 mA). This difference may have occurred because Wu et al. used 4‐Hz stimulation (not 2 Hz as we did), stimulated their subjects closer to (or above) the pain threshold, or used a different acupoint (GB‐34 or Yanglinquan, just off of the head of the fibula on the lateral leg). In our study, the pain threshold for high‐frequency EA was 1.68 ± 0.8 mA. This result was similar to that of Kawakita et al. [1991], who found that pain threshold with 500‐Hz stimulation was 0.9 ± 0.35 mA at an a priori tender point (medial calf, right leg). Excessive current load in electroacupuncture research is a major concern in both human and animal studies. A higher current increases the risk of pain, and studies with extreme current load may not be studying the effects of clinical acupuncture, but the effects of the noted diffuse noxious inhibitory control (DNIC) phenomenon [Le Bars et al., 1979].
Limitations
Several limitations in this preliminary study should be addressed in future studies. First, it is possible for somatosensory stimulation to produce head motion artifact in fMRI scans. In the future, we will utilize a prospective motion correction algorithm during our fMRI scans [Thesen et al., 2000]. The brainstem is especially susceptible to cerebrospinal fluid (CSF) and cardiac motion artifact; our results for structures in the brainstem thus need further validation. To achieve a homogeneous cohort, efforts should be made to minimize further sharp pain, and a larger sample size would permit separation of subjects with dull acupuncture sensations from those who felt sharp pain mixed with the dull sensations. In addition, there is known individual variability in acupuncture response, which may be related to differences in basal state [Gusnard et al., 2001] or neurohormonal factors such as cholecystokinin‐8 (CCK‐8) [Zhang et al., 1997]. Moreover, some subjects may be more susceptible to pain than others due to genetic factors [Zubieta et al., 2003]. To separate out these different cohorts and to carry out a power analysis, a large group size is needed and will be adopted in future studies. As an additional caveat, our fMRI data analysis included a conservative statistical threshold (P < 0.0001), and may have produced false negative results.
Notably, fMRI signal decrease is seen commonly in studies of acupuncture, including MA when compared to EA [Kong et al., 2002]. Although the interpretation of fMRI signal decrease remains controversial, one hypothesis refers to this signal decrease as “deactivation” of brain regions from a resting baseline [Raichle et al., 2001]. In other words, the fMRI signal is a relative measure and certain brain regions may be more active during baseline rest than during acupuncture stimulation. Regions with active inhibitory neurons may demonstrate hemodynamic signal increase, whereas those regions demonstrating signal decrease may be subject to either less excitatory inputs or more inhibitory inputs. Moreover, regional deactivation may be a mechanism by which acupuncture can mitigate hyperactivity in the brain to relieve conditions that have been linked with chronic hyperactivity such as chronic pain [Hsieh et al., 1995] or psychopathology, which has been associated with activations in the prefrontal cortex, ACC, and amygdala [Davidson et al., 1999]. Signal decrease in the medial prefrontal cortex, however, has been observed in many cross‐disciplinary fMRI studies. The innately high metabolic state of this cortical region renders it susceptible to any change in attention and cognition between active and inactive states (i.e., more cognition and rumination during inactive rest periods, and less during the active state), and may have been responsible for this signal decrease [Gusnard and Raichle, 2001].
Summary
To summarize the results of this study, EA produced more widespread signal increase than did MA. Furthermore, all three active acupuncture stimulations (MA, 2‐Hz EA, and 100‐Hz EA) produced more regions of positive and negative hemodynamic signal response than did sensory stimulation used as a control condition. All acupuncture stimulations produced signal decrease in the amygdala, anterior hippocampus, subgenual cingulate, and ventromedial prefrontal cortex, and signal increase in the anterior insula, results not seen with tactile sensory control. These results support the hypothesis that the limbic system is central to acupuncture effect. Furthermore, all acupuncture stimulations and sensory control stimulation produced signal increase in SII, whereas only EA (2 and 100 Hz) demonstrated signal increase in the homuncular leg topographic representation of SI. Knowledge of the basic mechanisms subserving different modes of acupuncture stimulation may aid future recommendations regarding the stimulation modality that may be more efficacious for treating the myriad disorders seen in an acupuncture clinic.
Acknowledgements
We thank Dr. Suk‐tak Chen for her advice with the data analysis.
REFERENCES
- Bandettini PA, Wong EC, Hinks RS, Tikofsky RS, Hyde JS (1992): Time course EPI of human brain function during task activation. Magn Reson Med 25: 390–397. [DOI] [PubMed] [Google Scholar]
- Becerra L, Breiter HC, Wise R, Gonzalez RG, Borsook D (2001): Reward circuitry activation by noxious thermal stimuli. Neuron 32: 927–946. [DOI] [PubMed] [Google Scholar]
- Biella G, Sotgiu ML, Pellegata G, Paulesu E, Castiglioni I, Fazio F (2001): Acupuncture produces central activations in pain regions. Neuroimage 14: 60–66. [DOI] [PubMed] [Google Scholar]
- Bingel U, Quante M, Knab R, Bromm B, Weiller C, Buchel C (2002): Subcortical structures involved in pain processing: evidence from single‐trial fMRI. Pain 99: 313–321. [DOI] [PubMed] [Google Scholar]
- Birch S, Felt B (1999): Understanding acupuncture. Edinburgh: Churchill Livingstone; 335 p. [Google Scholar]
- Bornhovd K, Quante M, Glauche V, Bromm B, Weiller C, Buchel C (2002): Painful stimuli evoke different stimulus‐response functions in the amygdala, prefrontal, insula and somatosensory cortex: a single‐trial fMRI study. Brain 125: 1326–1336. [DOI] [PubMed] [Google Scholar]
- Breiter HC, Gollub RL, Weisskoff RM, Kennedy DN, Makris N, Berke JD, Goodman JM, Kantor HL, Gastfriend DR, Riorden JP, Mathew RT, Rosen BR, Hyman SE (1997): Acute effects of cocaine on human brain activity and emotion. Neuron 19: 591–611. [DOI] [PubMed] [Google Scholar]
- Bushnell MC, Duncan GH, Hofbauer RK, Ha B, Chen JI, Carrier B (1999): Pain perception: is there a role for primary somatosensory cortex? Proc Natl Acad Sci USA 96: 7705–7709. [DOI] [PMC free article] [PubMed] [Google Scholar]
- Casey KL (1999): Forebrain mechanisms of nociception and pain: analysis through imaging. Proc Natl Acad Sci USA 96: 7668–7774. [DOI] [PMC free article] [PubMed] [Google Scholar]
- Caviness V, Meyer J, Makris N, Kennedy D (1996): MRI‐based topographic parcellation of the human neocortex: an anatomically specified method with estimate of reliability. J Cognitive Neurosci 8: 566–587. [DOI] [PubMed] [Google Scholar]
- Chen Y, Hui K, Kong J, Kwong K (2001): Forepaw stimulation at a classical acupuncture point modulates cerebral dopaminergic tone. Neuroimage 13: 976. [Google Scholar]
- Cheng RS, Pomeranz B (1979): Electroacupuncture analgesia could be mediated by at least two pain‐ relieving mechanisms; endorphin and non‐endorphin systems. Life Sci 25: 1957–1962. [DOI] [PubMed] [Google Scholar]
- Cheng RS, Pomeranz B (1981): Monoaminergic mechanism of electroacupuncture analgesia. Brain Res 215: 77–92. [DOI] [PubMed] [Google Scholar]
- Cho ZH, Chung SC, Jones JP, Park JB, Park HJ, Lee HJ, Wong EK, Min BI (1998): New findings of the correlation between acupoints and corresponding brain cortices using functional MRI. Proc Natl Acad Sci USA 95: 2670–2673. [DOI] [PMC free article] [PubMed] [Google Scholar] [Retracted]
- Cox RW (1996): AFNI: software for analysis and visualization of functional magnetic resonance neuroimages. Comput Biomed Res 29: 162–173. [DOI] [PubMed] [Google Scholar]
- DaSilva AF, Becerra L, Makris N, Strassman AM, Gonzalez RG, Geatrakis N, Borsook D (2002): Somatotopic activation in the human trigeminal pain pathway. J Neurosci 22: 8183–8192. [DOI] [PMC free article] [PubMed] [Google Scholar]
- Davidson RJ, Abercrombie H, Nitschke JB, Putnam K (1999): Regional brain function, emotion and disorders of emotion. Curr Opin Neurobiol 9: 228–234. [DOI] [PubMed] [Google Scholar]
- Davis KD, Pope GE, Crawley AP, Mikulis DJ (2002): Neural correlates of prickle sensation: a percept‐related fMRI study. Nat Neurosci 5: 1121–1122. [DOI] [PubMed] [Google Scholar]
- Davis KD, Taylor S, Crawley A, Mikulis DJ (1997): Functional MRI of pain and attention related activations in the human cingulate cortex. J Neurophysiol 77: 3370–3380. [DOI] [PubMed] [Google Scholar]
- Filipek PA, Richelme C, Kennedy DN, Caviness VS Jr (1994): The young adult human brain: an MRI‐based morphometric analysis. Cereb Cortex 4: 344–360. [DOI] [PubMed] [Google Scholar]
- Gareus IK, Lacour M, Schulte AC, Hennig J (2002): Is there a BOLD response of the visual cortex on stimulation of the vision‐related acupoint GB 37? J Magn Reson Imaging 15: 227–232. [DOI] [PubMed] [Google Scholar]
- Gulia KK, Kumar VM, Mallick HN (2002): Role of the lateral septal noradrenergic system in the elaboration of male sexual behavior in rats. Pharmacol Biochem Behav 72: 817–823. [DOI] [PubMed] [Google Scholar]
- Gusnard DA, Akbudak E, Shulman GL, Raichle ME (2001): Medial prefrontal cortex and self‐referential mental activity: relation to a default mode of brain function. Proc Natl Acad Sci USA 98: 4259–4264. [DOI] [PMC free article] [PubMed] [Google Scholar]
- Gusnard DA, Raichle ME (2001): Searching for a baseline: functional imaging and the resting human brain. Nat Rev Neurosci 2: 685–694. [DOI] [PubMed] [Google Scholar]
- Haines DE (1991): Neuroanatomy. An atlas of structures, sections and systems. Baltimore: Williams and Wilkins. [Google Scholar]
- Han CS, Chou PH, Lu CC, Lu LH, Yang TH, Jen MF (1979): The role of central 5‐hydroxytryptamine in acupuncture analgesia. Sci Sin 22: 91–104. [PubMed] [Google Scholar]
- Han SH, Yoon SH, Cho YW, Kim CJ, Min BI (1999a): Inhibitory effects of electroacupuncture on stress responses evoked by tooth‐pulp stimulation in rats. Physiol Behav 66: 217–222. [DOI] [PubMed] [Google Scholar]
- Han Z, Jiang YH, Wan Y, Wang Y, Chang JK, Han JS (1999b): Endomorphin‐1 mediates 2 Hz but not 100 Hz electroacupuncture analgesia in the rat. Neurosci Lett 274: 75–78. [DOI] [PubMed] [Google Scholar]
- Harrington GS, Hunter Downs J 3rd (2001): FMRI mapping of the somatosensory cortex with vibratory stimuli. Is there a dependency on stimulus frequency? Brain Res 897: 188–192. [DOI] [PubMed] [Google Scholar]
- Hsieh JC, Belfrage M, Stone‐Elander S, Hansson P, Ingvar M (1995): Central representation of chronic ongoing neuropathic pain studied by positron emission tomography. Pain 63: 225–236. [DOI] [PubMed] [Google Scholar]
- Hsieh JC, Tu CH, Chen FP, Chen MC, Yeh TC, Cheng HC, Wu YT, Liu RS, Ho LT (2001): Activation of the hypothalamus characterizes the acupuncture stimulation at the analgesic point in human: a positron emission tomography study. Neurosci Lett 307: 105–108. [DOI] [PubMed] [Google Scholar]
- Hui K, Liu J, Chen A (1997): Effects of acupuncture on human limbic system and basal ganglia measured by fMRI. Neuroimage 5: 226. [Google Scholar]
- Hui KK, Liu J, Makris N, Gollub RL, Chen AJ, Moore CI, Kennedy DN, Rosen BR, Kwong KK (2000): Acupuncture modulates the limbic system and subcortical gray structures of the human brain: evidence from fMRI studies in normal subjects. Hum Brain Mapp 9: 13–25. [DOI] [PMC free article] [PubMed] [Google Scholar]
- Hui K, Liu J, Makris N, Chan S, Kong J, Kwong K (2001): Acupuncture modulatory effects by whole brain fMRI: deqi versus pain. Abstr Soc for Neurosci 27: 21.11. [Google Scholar]
- Jang MH, Lee TH, Lim BV, Shin MS, Min BI, Kim H, Cho S, Kim EH, Kim CJ (2003): Acupuncture suppresses ischemia‐induced increase in c‐Fos expression and apoptosis in the hippocampal CA1 region in gerbils. Neurosci Lett 347: 5–8. [DOI] [PubMed] [Google Scholar]
- Jasmin L, Rabkin SD, Granato A, Boudah A, Ohara PT (2003): Analgesia and hyperalgesia from GABA‐mediated modulation of the cerebral cortex. Nature 424: 316–320. [DOI] [PubMed] [Google Scholar]
- Kandel E, Schwartz J, Jessell T (2000): Principles of neural science. New York: McGraw‐Hill; 1414 p. [Google Scholar]
- Kawakita K, Miura T, Iwase Y (1991): Deep pain measurement at tender points by pulse algometry with insulated needle electrodes. Pain 44: 235–239. [DOI] [PubMed] [Google Scholar]
- Kirifides ML, Simpson KL, Lin RC, Waterhouse BD (2001): Topographic organization and neurochemical identity of dorsal raphe neurons that project to the trigeminal somatosensory pathway in the rat. J Comp Neurol 435: 325–340. [DOI] [PubMed] [Google Scholar]
- Kong J, Ma L, Gollub RL, Wei J, Yang X, Li D, Weng X, Jia F, Wang C, Li F, Li R, Zhuang D (2002): A pilot study of functional magnetic resonance imaging of the brain during manual and electroacupuncture stimulation of acupuncture point (LI‐4 Hegu) in normal subjects reveals differential brain activation between methods. J Altern Complement Med 8: 411–419. [DOI] [PubMed] [Google Scholar]
- Kwon YB, Kang MS, Son SS, Kim JT, Lee YH, Han HJ, Lee JH (2000): Different frequencies of electroacupuncture modified the cellular activity of serotonergic neurons in brainstem. Am J Chin Med 28: 435–441. [DOI] [PubMed] [Google Scholar]
- Kwong KK, Belliveau JW, Chesler DA, Goldberg IE, Weisskoff RM, Poncelet BP, Kennedy DN, Hoppel BE, Cohen MS, Turner R, et al. (1992): Dynamic magnetic resonance imaging of human brain activity during primary sensory stimulation. Proc Natl Acad Sci USA 89: 5675–5679. [DOI] [PMC free article] [PubMed] [Google Scholar]
- Le Bars D, Dickenson AH, Besson JM (1979): Diffuse noxious inhibitory controls (DNIC). I. Effects on dorsal horn convergent neurones in the rat. Pain 6: 283–304. [DOI] [PubMed] [Google Scholar]
- Liu G (1998): Techniques of acupuncture and moxibustion. Beijing: Huaxia Publishing House; 177 p. [Google Scholar]
- Maddock RJ (1999): The retrosplenial cortex and emotion: new insights from functional neuroimaging of the human brain. Trends Neurosci 22: 310–316. [DOI] [PubMed] [Google Scholar]
- Mayberg HS, Silva JA, Brannan SK, Tekell JL, Mahurin RK, McGinnis S, Jerabek PA (2002): The functional neuroanatomy of the placebo effect. Am J Psychiatry 159: 728–737. [DOI] [PubMed] [Google Scholar]
- Ogawa S, Tank DW, Menon R, Ellermann JM, Kim SG, Merkle H, Ugurbil K (1992): Intrinsic signal changes accompanying sensory stimulation: functional brain mapping with magnetic resonance imaging. Proc Natl Acad Sci USA 89: 5951–5955. [DOI] [PMC free article] [PubMed] [Google Scholar]
- Parent A (1996): Carpenter's human neuroanatomy. Baltimore: Williams and Wilkins; 1011 p. [Google Scholar]
- Paxinos G, Huang XF (1995): Atlas of the human brainstem. San Diego: Academic Press; 149 p. [Google Scholar]
- Petrovic P, Ingvar M (2002): Imaging cognitive modulation of pain processing. Pain 95: 1–5. [DOI] [PubMed] [Google Scholar]
- Peyron R, Laurent B, Garcia‐Larrea L (2000): Functional imaging of brain responses to pain. A review and meta‐ analysis. Neurophysiol Clin 30: 263–288. [DOI] [PubMed] [Google Scholar]
- Poellinger A, Thomas R, Lio P, Lee A, Makris N, Rosen BR, Kwong KK (2001): Activation and habituation in olfaction—an fMRI study. Neuroimage 13: 547–560. [DOI] [PubMed] [Google Scholar]
- Raichle ME, MacLeod AM, Snyder AZ, Powers WJ, Gusnard DA, Shulman GL (2001): A default mode of brain function. Proc Natl Acad Sci USA 98: 676–682. [DOI] [PMC free article] [PubMed] [Google Scholar]
- Saletu B, Saletu M, Brown M, Stern J, Sletten I, Ulett G (1975): Hypno‐analgesia and acupuncture analgesia: a neurophysiological reality? Neuropsychobiology 1: 218–242. [DOI] [PubMed] [Google Scholar]
- Shi CJ, Cassell MD (1998): Cortical, thalamic, and amygdaloid connections of the anterior and posterior insular cortices. J Comp Neurol 399: 440–468. [DOI] [PubMed] [Google Scholar]
- Squire L, Bloom F, McConnell S, Roberts J, Spitzer N, Zigmond M, editors (2003): Fundamental neuroscience. 2nd ed. Boston: Academic Press; 1426 p. [Google Scholar]
- Thesen S, Heid O, Mueller E, Schad LR (2000): Prospective acquisition correction for head motion with image‐based tracking for real‐time fMRI. Magn Reson Med 44: 457–465. [DOI] [PubMed] [Google Scholar]
- Tucker D, Derryberry D, Luu P (2000): Anatomy and physiology of human emotion: vertical integration of brainstem, limbic, and cortical systems In: Borod J, editor. The neuropsychology of emotion. New York: Oxford University Press; p 56–79. [Google Scholar]
- Ulett G, Han S, Han JS (1998): Electroacupuncture: mechanisms and clinical application. Biol Psychiatry 44: 129–138. [DOI] [PubMed] [Google Scholar]
- Wang KM, Yao SM, Xian YL, Hou ZL (1985): A study on the receptive field of acupoints and the relationship between characteristics of needling sensation and groups of afferent fibres. Sci Sin [B] 28: 963–971. [PubMed] [Google Scholar]
- Wang YQ, Cao XD, Wu GC (1999): Role of dopamine receptors and the changes of the tyrosine hydroxylase mRNA in acupuncture analgesia in rats. Acupunct Electrother Res 24: 81–88. [DOI] [PubMed] [Google Scholar]
- Wu MT, Hsieh JC, Xiong J, Yang CF, Pan HB, Chen YC, Tsai G, Rosen BR, Kwong KK (1999): Central nervous pathway for acupuncture stimulation: localization of processing with functional MR imaging of the brain—preliminary experience. Radiology 212: 133–141. [DOI] [PubMed] [Google Scholar]
- Wu MT, Sheen JM, Chuang KH, Yang P, Chin SL, Tsai CY, Chen CJ, Liao JR, Lai PH, Chu KA, Pan HB, Yang CF (2002): Neuronal specificity of acupuncture response: a fMRI study with electroacupuncture. Neuroimage 16: 1028–1037. [DOI] [PubMed] [Google Scholar]
- Yang G, Huang ZN, Cheung JS (2000): Anticonvulsion effect of acupuncture might be related to the decrease of neuronal and inducible synthase. Acupunct Electrother Res 25: 137–143. [DOI] [PubMed] [Google Scholar]
- Yuan Y, Yan S, Chen X, Han JS (1993): The effect and mechanism of electroacupuncture in treating spinal spasticity: a clinical study. Nat Med J Chin [chin] 73: 5932. [Google Scholar]
- Yun SJ, Park HJ, Yeom HJ, Hahm DH, Lee HJ, Lee EH (2002): Effect of acupuncture on the stress‐induced changes in brain‐derived neurotrophic factor expression in rat hippocampus. Neurosci Lett 318: 85–88. [DOI] [PubMed] [Google Scholar]
- Zald DH (2003): The human amygdala and the emotional evaluation of sensory stimuli. Brian Res Rev 41: 88–123. [DOI] [PubMed] [Google Scholar]
- Zhang WT, Jin Z, Cui GH, Zhang KL, Zhang L, Zeng YW, Luo F, Chen AC, Han JS (2003): Relations between brain network activation and analgesic effect induced by low vs. high frequency electrical acupoint stimulation in different subjects: a functional magnetic resonance imaging study. Brain Res 982: 168–178. [DOI] [PubMed] [Google Scholar]
- Zhang LX, Li XL, Wang L, Han JS (1997): Rats with decreased brain cholecystokinin levels show increased responsiveness to peripheral electrical stimulation‐induced analgesia. Brain Res 745: 158–164. [DOI] [PubMed] [Google Scholar]
- Zubieta JK, Heitzeg MM, Smith YR, Bueller JA, Xu K, Xu Y, Koeppe RA, Stohler CS, Goldman D (2003): COMT val158met genotype affects mu‐opioid neurotransmitter responses to a pain stressor. Science 299: 1240–1243. [DOI] [PubMed] [Google Scholar]