

Abstract
Response to a stimulus is faster when a subject is attending and knows beforehand how to respond. It has been suggested recently that this occurs because ongoing neuronal activity is spatially and temporally structured during states of expectancy preceding a stimulus. This mechanism is believed to mediate top‐down processing, facilitating the early grouping and selection of distributed neuronal ensembles implicated in ensuing sensory–motor processing. To validate this model, it must be shown that some features of this early ongoing neural activity are correlated with subsequent perceptual decisions or behavioral events. We investigated this hypothesis in an electrophysiologic study in 12 subjects carrying out a simple visuomotor reaction‐time task. Local field potentials (LFP) at each brain voxel were estimated using a linear distributed inverse solution termed “ELECTRA” for each single trial of each subject. The energy of oscillations for different frequency bands was computed for the period between the warning cue and visual stimuli by applying a time–frequency decomposition to the estimated LFP. A nonparametric correlation coefficient was then calculated between energy of oscillations and reaction times for each single sweep. Gamma band oscillatory activity in a frontoparietal network before stimulus onset significantly correlated with reaction time for a significant amount of subjects. These results provide direct evidence for the role of neural oscillations as a top‐down attentional control mechanism that mediates the speed of motor actions. Hum. Brain Mapping 24:50–58, 2005. © 2004 Wiley‐Liss, Inc.
INTRODUCTION
A dynamic view of brain function predicts that attention induces oscillatory phenomena at specific brain areas at a very early processing stage that precedes perceptual processing [Engel et al., 2001]. In this dynamicist idea of top‐down, neurons on the network already synchronized by attentional state might enslave other neurons to become part of the same overall assembly after some point. The mechanism employed by the brain to enslave other neurons is the synchronized neural firing at specific frequency bands.
Primate intracellular recordings [Fries et al., 2001; Liang et al., 2003; Steinmetz et al., 2000] and electroencephalographic recordings in humans [Foxe et al., 1998; Harter et al., 1989; Hopf and Mangun, 2000; Yamaguchi et al., 1994] support the hypothesis that attention modulates neuronal firing. Functional imaging studies also indicate that attention can modulate the driving effect that neuronal populations in one cortical area exert on cells in another area [Kanwisher and Wojciulik, 2000; Kastner and Ungerleider, 2000]. However, many aspects of how attention or arousal influences later behavior and the brain areas implicated in early stages of attentional processing are poorly understood. Although the steadily increasing spatial resolution of functional neuroimaging has allowed for a more or less fine identification of different attentional networks [Posner and Dahaene, 1994], its temporal resolution does not approach levels required to study oscillations and synchrony. The use of noninvasive high temporal‐resolution recording techniques seems to be a prerequisite for understanding the neural mechanisms underlying attention and its influence on behavior in the normal human brain.
To validate the dynamicist hypothesis that top‐down attentional control in humans is mediated by neural oscillations and synchrony, it must be shown that such features, if present in ongoing brain electrical activity, are correlated with subsequent perceptual decisions or behavioral events. We were interested in experimentally evaluating this prediction by addressing the following questions in healthy human subjects: (1) whether early oscillatory activity emerges as a consequence of attention; (2) if early oscillations are relevant for subsequent behavior; and (3) the frequency bands and brain areas that are involved. We were interested particularly in studying this effect in what is known as alerting attention, i.e., the mechanisms involved in establishing a vigilant state and maintaining readiness to react.
We performed a high‐density electrophysiologic study using electroencephalography (EEG) in 12 healthy subjects carrying out a simple cued visuomotor reaction time task. Several primate studies suggest that attentional effects are reflected mainly in the fast frequency bands [Bressler et al., 2001; Liang et al., 2002], a fact that precludes averaging even over a small number of trials. We therefore adopted a trial‐by‐trial‐based study of ongoing activity during the period when we expected attentional effects to be preponderant, i.e., after presentation of the initial visual cue and before presentation of a visual stimulus to which subjects reacted by pressing a button. Animal and humans results support the view that top‐down effects can operate before stimulus appearance or during states of expectancy or anticipation that precede it [Chawla et al., 1999; Corbetta et al., 2000; de Oliveira et al., 1997; Hopfinger et al., 2000; Kastner et al., 1999; Luck et al., 1997; Monsell and Driver, 2000].
Scalp‐recorded data were transformed into estimates of intracranial local field potentials (LFPs) using a recently developed linear inverse solution to the bioelectric inverse problem termed “ELECTRA” [Grave de Peralta Menendez et al., 2000]. The use of this inverse method allows determination of the brain regions where specific oscillations correlate with the speed of motor reaction. Amplitudes of LFP oscillations at all brain sites were correlated with reaction times to evaluate their possible relation with behavior. Amplitudes of frequency oscillations were computed from a time‐frequency representation of the LFP estimated for each pixel at each single trial. For a significant number of subjects, gamma band oscillatory activity in a frontoparietal network before stimulus onset was correlated significantly with reaction time. These results provide direct evidence for the role of neural oscillations as a top‐down attentional control mechanism that mediates the speed of motor actions.
SUBJECTS AND METHODS
Subjects and Task
Twelve healthy, right‐handed subjects (6 women, age = 21–27 years) were tested. All subjects gave their written informed consent. The local ethical committee of the Geneva University Hospital approved the experiment. Subjects were asked to fixate on a central cross that also served as a warning cue and to respond as fast as possible with the right index finger to visual targets appearing 3–4 s after cue onset (see Fig. 1). The cross remained visible until the end of the response. Targets were presented for 60 ms in random order in either the left visual field (LVF) or the right visual field (RVF) (4‐degree horizontal eccentricity) to avoid spatial attention effects. Reaction times (RT) to targets were measured using an external device (mean RT, 268 ± 40 ms). Epochs associated with RTs lower than 100 ms or higher than 500 ms were excluded. Each subject was tested in 80 trials per condition and carried out a training session before the experiment. The position of the head was stabilized using a head and chin rest.
Figure 1.
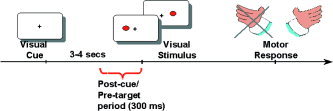
Subjects were instructed to attend to a central fixation cross (warning cue) that preceded by 3–4 s a visual target (black dot) randomly presented to the left or right of the fixation cross. Subjects were instructed to respond as fast as possible to the targets by pressing a button with the right index finger.
Data Recording
EEG was monitored continuously at 500 Hz during the whole experiment from 125 electrodes (Electric Geodesic System). Impedances were kept below 5 kΩ. Offline processing of scalp data consisted of visual rejection of trials contaminated by artefacts and removal of bad channels.
Artefact‐free EEG epochs consisting of 300 ms before target onset (termed hereafter post‐cue/pre‐target period) were selected for analysis. During this period, sensory analysis of the preceding visual cue should have finished and we expected only alertness effects to be present.
Data Analysis
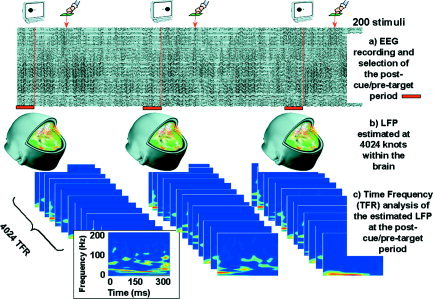
We tested the hypothesis that LFP oscillations play a role in anticipatory processes that in turn facilitate behavioral responses. Because attention‐related effects during this post‐cue/pre‐target period are not time‐locked to a stimulus, averaging even over small samples will eliminate all high‐frequency oscillations that may be present. We consequently selected a trial‐by‐trial–based analysis of our data (single trial analysis). A diagram of the whole analysis procedure is depicted in Figure 2.
Figure 2.
Analysis Procedure
To isolate the contribution of neural oscillations on different brain areas to the reaction time, we estimated the LFPs within the whole brain using a distributed inverse solution (ELECTRA) [Grave de Peralta Menendez et al., 2000] particularly suited to estimation of temporal behavior of activity in different regions. This distributed source localization procedure selects a unique solution to the bioelectromagnetic inverse problem based on physical laws governing propagation of potential fields in biological media [Grave de Peralta Menendez et al., 2004]. ELECTRA provides estimates of the 3D distribution of LFPs within the whole brain, which facilitates its direct comparison with recordings from intracranial electrodes. The advantages and limitations of ELECTRA have been explored using simulations [Grave de Peralta Menendez et al., 2000], comparisons with intracranial recordings in a task similar to the one reported here [Thut et al., 2000], and localization of epileptic activity [Michel et al., 1999]. These studies have shown that a scale‐independent waveshape analysis circumvents one basic limitation of distributed inverse solutions, i.e., the uncertainty estimating source amplitudes [Grave de Peralta Menendez and Gonzalez Andino, 1998].
ELECTRA was calculated for a solution space of 4,024 nodes distributed homogeneously within the inner compartment of a realistic head model derived from the Montreal Neurological Institute (MNI) average brain used by the Human Brain Mapping Consortium. The pixels were restricted to the grey matter of this inner compartment and formed a regular grid of 6‐mm resolution.
In the last step, we searched for significant correlations between the energy at specific frequencies in the ongoing activity during the post‐cue/pre‐target period and behavioral events (reaction times). To avoid arbitrary restrictions to particular frequency bands and undesirable filter effects, we computed for each grey matter pixel and epoch the wavelet energy associated with each frequency in the 1 to 100‐Hz range. This means that for each trial and pixel, we computed a joint time‐frequency decomposition of estimated LFPs using a particular type of wavelet (the S‐transform) [Stockwell et al., 1996].
The S transform (ST) was developed in 1996 for analyzing geophysics data. It is a generalization of the short‐time Fourier transform (STFT) and an extension of the wavelet transform (WT). The window width of the ST is adjusted automatically according to local frequency content, which is an advantage over the STFT with constant window width. In contrast to the WT, which describes signals in terms of scales, the ST uses the concept of Fourier frequencies, which facilitates interpretation of results and comparisons with studies based on standard Fourier spectral analysis.
The energy for each frequency was computed as the sum over the preparatory period of the squared ST coefficients. Rather than quantifying neural response synchronization, our approach quantifies the oscillation strength over time in particular frequencies, and its relationship with reaction time.
To avoid normality assumptions, we computed correlations between LFP energy and reaction times using the nonparametric Spearman rank correlation coefficient (SCC). To evaluate the statistical significance of computed correlations, we adopted an analysis approach that at first glance might seem unconventional. This approach, however, was justified by our data. As described above, we carried out careful artefact rejection on recorded single trials to eliminate those contaminated by artefacts before applying the inverse solution to estimate the LFP. This step leads to a very unequal number of repetitions for each individual subject even if the original number of trials was identical (160 trials). After the rejection process, 82 trials remained for the worst subject and 142 for the best one. A more classical analysis would have been one in which correlations are evaluated for each frequency and pixel and their significance evaluated over all subjects. This analysis would have missed that the statistical significance of correlations depends on the number of samples (which in our case was rather different between subjects). For this reason, we adopted an approach based on evaluating the significance of the SCC between reaction times and the wavelet energy for each pixel/subject considering the individual number of accepted trials. The statistical analysis over subjects described below was then applied to the adjusted P values (the significance), instead of applying it to the correlations.
The resultant P values for each subject were adjusted to consider the problem of multiple tests (number of solution points) using the Sidak single‐step method [Sidak, 1967]. The Sidak method is less conservative than is the Bonferroni method and the adjusted P‐values are easy to compute. In the particular case of inverse solutions, the actual number of independent tests is not equal to the number of solution points but instead to the number of sensors [see Appendix 2 in Grave de Peralta Menendez et al., 2004]. The adjustment for multiple tests carried out can still be considered highly conservative.
The whole procedure results in a probabilistic brain image for each single subject and frequency in the range 1–100 Hz (Δf = 1 Hz). This brain image quantifies the significance of the correlation between pre‐cue/post‐target neural oscillation and the speed of motor responses (RT) for each pixel. Consequently, we obtain for each subject a set of 100 three‐dimensional images (one per frequency) wherein each image depicts the statistical significance of the correlation between pre‐cue/post‐target neural oscillation and the speed of motor responses (RT).
We describe the procedure used to summarize this information. The significance of correlations over the sample of subjects was evaluated using a population proportion test also known as the binomial distribution test [Koopmans, 1981]. The test is used to consider the proportion of a sample for which a particular observation has been made. We set the significance level to 0.05, which implies that correlation values should have been significant for a given frequency and pixel in 10 of 12 subjects to accept the proportion as significantly different from chance.
RESULTS
In the individual subject analysis, we observed the existence of both negative and positive significant correlations (P < 0.05) at different areas and frequency bands. The existence of a negative correlation indicates that faster responses are associated with stronger oscillations whereas a positive correlation indicates that stronger oscillations are associated with slower responses.
Figure 3a shows the percentage of subjects with significant negative SCC (P < 0.05) for each pixel and each frequency. The goal of this figure is to illustrate the relationship between frequencies and speed of responses; no inferences can be extracted about brain structures involved. Although for less than half of the subjects, some clusters of significantly correlated pixels appeared for theta (4–8 Hz), and beta (13–30 Hz) frequency bands, more than 85% of the subjects (P < 0.05, proportion test) show significant negative correlation between energy in the gamma band (above 30 Hz) and reaction time. This effect is illustrated clearly in Figure 3b, which shows a view of Figure 3a already thresholded at the 0.05 significance level.
Figure 3.
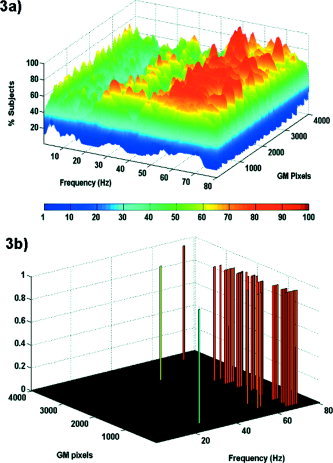
Contribution of each frequency band in the post‐cue/pre‐target period to reaction time. Vertical axis depicts percentage of subjects with significant linear correlation between energy at that frequency and reaction time. a: Percentage of subjects with significant negative correlation between oscillations and reaction times. Note the large number of subjects where the strength of gamma oscillations at the post‐cue/pre‐target period results in faster responses. b: Significant pixels at P < 0.05 in the population proportion test. Note that pixels statistically significant at the population level are confined to the gamma band.
Figure 4 depicts the percentage of subjects for which a significant positive correlation between energy and reaction time appeared at each pixel and frequency. It thus expresses frequencies whose decrease is associated with faster responses. More than half of the subjects showed faster motor reaction for decreased alpha rhythm in the post‐cue/pre‐target period. No flat version of the figure is provided because the amount of subjects did not reach the required significance value in the proportion test. Although this effect cannot be considered significant from a statistical point of view, because it appears in 7 of 12 subjects nearly at the chance level, it is interesting because the alpha frequency band has been associated quite often to inattentive states.
Figure 4.
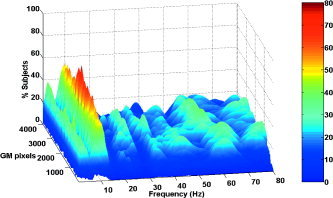
Percentage of subjects with significant positive correlations, i.e., frequencies whose increase results slower responses. A peak is seen on the alpha band although for a number of subjects smaller than the effect observed for the gamma band.
To investigate spatial distribution of pixels (brain locations) where oscillations were correlated significantly with reaction time, we subdivided the whole range of frequencies into the classic EEG frequency bands, i.e., delta (1–4 Hz), theta (4–8 Hz), alpha (8–12 Hz), beta (13–30 Hz), and gamma (30–100 Hz). We then summed over all frequencies that belong to the specified band a flag that indicates if the pixel has significant correlation for a significant number of subjects in the proportion test (P < 0.05). The spatial distribution of pixels fulfilling this criterion for the gamma band is depicted in Figure 5a, where color codes the amount of frequency bins of the band where the observed effect was significant. It shows that pixels correlated significantly with fast responses are not distributed globally in the whole brain but form a clearly defined frontoparietal network that also includes middle temporal areas of both hemispheres and supplementary motor areas of the left hemisphere. Table I gives the anatomic details of the areas.
Figure 5.
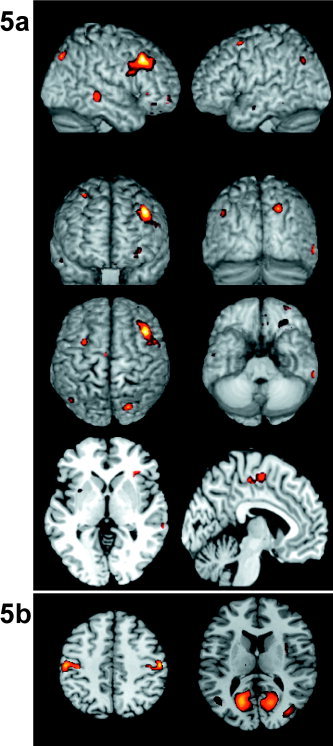
Brain areas where gamma band (a) and alpha band (b) in the post‐cue/pre‐target period contribute to reaction time in more than the 85% of the subjects (a) or more that 50% of the subjects (b). Left part of the picture indicates left except for the second inset showing a frontal view. Color is proportional to the amount of frequency bins within the particular band where the effect appears.
Table I.
Summary of loci with significant correlation between gamma band oscillations and reaction time
| Hemisphere | Anatomy | x, y, z | BA |
|---|---|---|---|
| Left | Middle frontal gyrus | −33, 5, 53 | 8 |
| Left | Supplementary motor area | −3, −12, 56 | 6 |
| Left | Middle temporal gyrus | −51, −57, 18 | 39 |
| Left | Insula/putamen | −29, 3, 1 | — |
| Right | Cuneus (SPL) | 22, −70, 35 | 7 |
| Right | Middle frontal gyrus | 37, 4, 57 | 46 |
| Right | Middle temporal gyrus | 60, −32, −8 | 21 |
| Right | Inferior orbitofrontal cortex | 35, 29, −13 | 47 |
| Right | Insula/putamen | 33, 17, −13 | — |
Summary of loci where the 85% (10/12) subjects showed significant correlation between gamma band oscillations and reaction time. MNI coordinates x, y, z given in mm. BA, Brodmann area.
Figure 5b depicts brain pixels where more than the 50% of subjects showed a significant positive correlation between reaction time and alpha band energy. Although not significant in terms of the number of subjects where this effect appeared (proportion test), these pixels form well‐defined clusters over visual and motor areas.
DISCUSSION
The results of our analysis indicate that in more than the 80% of the subjects, gamma band oscillatory activity arising before stimulus onset in a frontoparietal network was correlated significantly with reaction time. Our finding of a close correlation between reaction time and increased gamma oscillations in the period between an attentional cue and a visual target is fully consistent with the hypothesized role of gamma in top‐down attentional processing [e.g., Debener et al., 2003; Fell et al., 2003 and references therein; Keil et al., 1999]. Studies using event‐related functional magnetic resonance imaging (fMRI) have shown that a frontoparietal network is involved in the top‐down control of spatial attention [Corbetta et al., 2000; Hopfinger et al., 2000; Kastner et al., 1999]. These studies relied on measurement of the event‐related hemodynamic responses to attention‐directing cues in covert‐orienting paradigms where the cues precede task‐relevant targets in each experimental trial. A similar rationale was used in our study by selecting an analysis period between the warning cue and visual stimuli to assess areas and mechanisms involved in top‐down control of attention. From our study, we can conclude that many of the brain areas identified by functional neuroimaging studies as part of the brain attentional network are engaged in gamma band oscillations at a very early period that precedes perceptual processing of visual stimuli.
According to our results, alertness‐related modulation in the gamma frequency band emerges from a cortical network comprising the right superior parietal lobe and regions of the medial and lateral superior frontal lobes bilaterally. Gamma band modulation also involved basal ganglia structures of both hemispheres in the regions of the insula/putamen. In addition, these oscillations implicated the middle temporal gyrus bilaterally. Although several previous neuroimaging studies have implicated areas of a frontoparietal network in generation of a top‐down signal during spatial orienting [e.g., Corbetta et al., 2000; Hopfinger et al., 2000; Kastner et al., 1999], studies that investigated the neuroanatomic underpinning of alertness, constituting a nonspatial attentional operation, provided contradictory results [e.g., Coull et al., 2001; Sturm and Willmes, 2001; Thiel et al., 2004]. Although some findings point toward a right‐sided frontoparietal alerting network, in line with our results [Sturm and Willmes, 2001], others suggest left lateralization [Coull et al., 2001] or absence of activation of these regions [Thiel et al., 2004]. The right lateralization of activation detected in our study is consistent with lesion studies in stroke patients that have demonstrated an important role of the right hemisphere for alertness [Howes and Boller, 1975; Posner et al., 1987] by observing significant increases in reaction times to visual and auditory stimuli after right hemisphere lesions. Involvement of the right orbitofrontal cortex in this gamma band network might be explained by the link existing between attention and motivation [see Schultz, 2000]. The orbitofrontal cortex (OFC) has been implicated in motivational aspects of action and response inhibition. In particular, lesions to the right OFC impair the capacity of patients to assess and use advice to make predictive judgments [Gomez‐Beldarrain et al., 2004]. Eye movements could be also hypothesized as being at the origin of the detected OFC activation given the closeness of the OFC to the eyeballs. The fact, however, that this activity was right lateralized, confined to the gamma band, and only in such cases related to the reaction time makes this hypothesis very unlikely.
Some additional cortical areas such as supplementary motor areas (SMA) and anterior cingulate cortex have been hypothesized to be part of the attentional control network [Posner and Dahaene, 1994; Sturm and Willmes, 2001]. Our results suggest that anterior cingulate cortex was not part of the gamma band network at this very early period. We found that for some subjects (less than the 50%), however, theta oscillations in the anterior cingulate cortex correlated with faster responses. Although the number of subjects where we observe this effect was not high enough to reach significance in the proportion test, the values of the correlation were highly significant in those subjects where this effect appeared.
We found the left SMA to be involved in high‐frequency oscillations. Because subjects always responded with the right hand, the left lateralization found for SMA activation suggests that participation of this area is more related to motor preparation. In fact, gamma band oscillations have been reported to arise in monkeys carrying out paw movements in a period that precedes the actual movement [Lee, 2003; Sanes and Donoghue, 1993]. In addition, in humans, the power of the EEG activity recorded over the SMA has been shown to decrease (event‐related desynchronization) for the alpha frequency range but to increase (event‐related synchronization) for the gamma frequency range during several seconds before movement onset [Andrew and Pfurtscheller, 1996]. Similar results have been observed in electrocorticographic recordings [Ohara et al., 2000, 2001].
Studies of LFP in cats and monkey visual cortex have shown that gamma band oscillations can become coherent within and across cerebral hemispheres preceding visual stimulus onset depending on attention‐related mechanisms [Fries et al., 2001]. Furthermore, prediction of response latencies was only possible within the gamma band with negative LFPs associated with early responses [Fries et al., 2001]. Our results, although not directly addressing the problem of coherent oscillations, support the hypothesis stated by Fries et al. [2001] that attention and expectancy can be expressed in dynamic states and contribute to fast grouping before stimuli have actually caused responses at higher processing states. It remains an objective of future studies to see if polarity of estimated LFP influences response speed. Another early study in humans evaluating the influence of prestimulus oscillations on reaction time provided results that apparently contradict this hypothesis. Jokeit and Makeig [1994] compared slow with fast responders in an auditory reaction time task. These authors described prestimulus‐enhanced gamma band power over a central electrode for slower responders but not for fast responders. One alternative proposed by Jokeit and Makeig [1994] to explain the prestimuli gamma band difference was that such enhancement might reflect stronger anticipation of imperative stimuli by slower responders. Such anticipation in turn might require more fully elaborated stimulus processing, resulting in slower mean reaction times. In our study, subjects benefit from a warning cue known to reduce reaction time in healthy subjects and patients [Jahanshahi et al., 1992]. The warning cue produces a more homogeneous distribution of reaction times over subjects, reflected in the small standard deviation from the 40‐ms mean reaction time that we observed. Consequently, our subjects cannot be divided into groups of slow and fast responders. In our opinion, the gamma band prestimulus enhancement thus reflects in both experiments the alertness induced by proximity of the imperative stimuli. Reaction time is fastest with an intermediate level of arousal, however, and deteriorates when the subject is either too relaxed or too tense [Freeman, 1933; Broadbent, 1971; Welford, 1977]. The last situation, i.e., that the subject is either too tense or too relaxed, is more likely to occur in the case of absence of a warning cue as in the auditory reaction time design of Jokeit and Makeig [1994].
Although our results confirm a close link between neural oscillations and performance, no information arises about the role played by synchrony. The finding, however, that the increase in alpha band oscillations localized over visual and motor areas correlates with the increase in reaction times suggests that coupling/decoupling between different frequencies at different brain areas might play an important functional role. Von Stein et al. [2000] reported significant phase coupling between gamma frequencies in area 17 and alpha frequencies in area 7 of monkeys engaged in a Go/No‐go task. Based on their results, von Stein et al. [2000] proposed alpha oscillations as a functional correlate of top‐down processing and gamma oscillations as a reflection of bottom‐up processing. This is in direct contradiction with our results that suggest that gamma oscillations are a functional correlate of top‐down processing at this early attentional period. The most likely reason for this difference is the period analyzed in each study. Von Stein et al. [2000] studied the effect of oscillations in the period before the response in the Go/No‐go paradigm, whereas our study concentrated on the post‐cue/pre‐target period. Recent reviews [Fell et al., 2003] suggest that gamma oscillations might in fact act to mediate both bottom‐up and top‐down processing, depending on the functional context.
A functional hypothesis that may help to understand the relationship observed between alpha oscillations and increased reaction time proposes that alpha oscillations arise in areas not being used for processing but instead are being inhibited by other brain regions [Klimesch et al., 1999]. It means that alpha oscillations could serve as the functional marker to prevent information flow into areas retaining memory items. Increased alpha oscillations over visual areas could serve to suppress input from the visual stream that might disturb memory processes in frontal area, whereas alpha oscillations over sensory motor areas might prevent engagement of the motor system during the retention period [Jensen et al., 2002]. In this way, alpha oscillations will act as the busy tone of the brain whereas gamma oscillations will act as a ringing bell for concerted action elicited by attention.
CONCLUSIONS
Three conclusions derive from the results of this study: (1) alertness‐related modulation of ongoing neural activity before stimuli presentation influences motor performance; (2) alertness modulates neural ongoing activity by inducing high frequency (gamma band) oscillations rather than random fluctuations or baseline increases of neuronal activity; and (3) alertness‐related modulation in the gamma frequency band emerge from a localized brain network that involves neural structures identified previously by other neuroimaging studies as being responsible for top–down attentional control. The fact that areas activated in response to attentional cues determine the speed of motor responses implies that these areas are involved in top–down attentional control of attention. It therefore indicates that high‐frequency oscillations play a role in top–down processing, as suggested by the dynamicist hypothesis. This oscillatory activity might facilitate amplification of neural activity in sensory areas, observed previously in neuroimaging experiments involving attention.
To our knowledge, this is the first study in humans showing that attention drives specific brain areas to be engaged in high‐frequency oscillations whose strength is related to the speed of subsequent motor actions. The results of this study are a step forward in clarifying the functional role played by brain oscillations in humans by assessing how, when, and where in the brain oscillatory rhythms influence subsequent behavior. The methodology used in this study helps to link results from modern neuroimaging techniques (e.g., fMRI) with traditional techniques used to study oscillations in humans and animals, i.e., invasive LFP recordings in animals or humans or scalp EEG recordings.
Acknowledgements
We thank M. Murray, A. Pegna, and E. Miño for critical reading of the article and one anonymous referee for constructive suggestions.
REFERENCES
- Andrew C, Pfurtscheller G (1996): Event‐related coherence as a tool for studying dynamic interaction of brain regions. Electroencephalogr Clin Neurophysiol 98: 144–148. [DOI] [PubMed] [Google Scholar]
- Bressler SL, Liang H, Ding M (2001): Top‐down influence on early visual processing by an anticipatory large‐scale network in macaque prefrontal cortex. Soc Neurosci Abstr 27: 533.1. [Google Scholar]
- Broadbent DE (1971): Decision and stress. London: Academic Press. [Google Scholar]
- Chawla D, Rees G, Friston KJ (1999): The physiological basis of attentional modulation in extrastriate visual areas. Nat Neurosci 2: 671–676. [DOI] [PubMed] [Google Scholar]
- Corbetta M, Kincade JM, Ollinger JM, McAvoy MP, Shulman GL (2000): Voluntary orienting is dissociated from target detection in human posterior parietal cortex. Nat Neurosci 3: 292–297. [DOI] [PubMed] [Google Scholar]
- Corbetta M, Shulman GL (2002): Control of goal directed and stimulus‐driven attention in the brain. Nat Rev Neurosci 3: 215–229. [DOI] [PubMed] [Google Scholar]
- Coull JT, Nobre AC, Frith CD (2001): The noradrenergic alpha2 agonist clonidine modulates behavioural and neuroanatomical correlates of human attentional orienting and alerting. Cereb Cortex 11: 73–84. [DOI] [PubMed] [Google Scholar]
- Debener S, Herrmann CS, Kranczioch C, Gembris D, Engel AK (2003): Top‐down attentional processing enhances auditory evoked gamma band activity. Neuroreport 14: 683–686. [DOI] [PubMed] [Google Scholar]
- de Oliveira SC, Thiele A, Hoffmann KP (1997): Synchronization of neuronal activity during stimulus expectation in a direction discrimination task. J Neurosci 17: 9248–9260. [DOI] [PMC free article] [PubMed] [Google Scholar]
- Engel AK, Fries P, Singer W (2001): Dynamic predictions: oscillations and synchrony in top‐down processing. Nat Rev Neurosci 2: 704–716. [DOI] [PubMed] [Google Scholar]
- Fell J, Fernandez G, Klaver P, Elger CE, Fries P (2003): Is synchronized neuronal gamma activity relevant for selective attention? Brain Res Brain Res Rev 42: 265–272. [DOI] [PubMed] [Google Scholar]
- Foxe JJ, Simpson GV, Ahlfors SP (1998): Parieto‐occipital approximately 10 Hz activity reflects anticipatory state of visual attention mechanisms. Neuroreport 9: 3929–3933. [DOI] [PubMed] [Google Scholar]
- Freeman GL (1933): The facilitative and inhibitory effects of muscular tension upon performance. Am J Psychol 26: 602–608. [Google Scholar]
- Fries P, Reynolds JH, Rorie AE, Desimone R (2001): Modulation of oscillatory neuronal synchronization by selective visual attention. Science 291: 1560–1563. [DOI] [PubMed] [Google Scholar]
- Gomez‐Beldarrain M, Harries C, Garcia‐Monco JC, Ballus E, Grafman J (2004): Patients with right frontal lesions are unable to assess and use advice to make predictive judgments. J Cogn Neurosci 16: 74–89. [DOI] [PubMed] [Google Scholar]
- Grave de Peralta Menendez R, Gonzalez Andino SL (1998): A critical analysis of linear inverse solutions. IEEE Trans Biomed Eng 45: 440–448. [DOI] [PubMed] [Google Scholar]
- Grave de Peralta Menendez R, Gonzalez Andino SL, Morand S, Michel CM, Landis T (2000): Imaging the electrical activity of the brain: ELECTRA. Hum Brain Mapp 9: 1–12. [DOI] [PMC free article] [PubMed] [Google Scholar]
- Grave de Peralta Menendez R, Murray MM, Michel CM, Martuzzi R, Gonzalez Andino SL (2004): Electrical neuroimaging based on biophysical constraints. Neuroimage 21: 527–539. [DOI] [PubMed] [Google Scholar]
- Harter M, Miller S, Price N, Lalonde M, Keyes A (1989): Neural processes involved in directing attention. J Cogn Neurosci 3: 223–237. [DOI] [PubMed] [Google Scholar]
- Hopf JM, Mangun GR (2000): Shifting visual attention in space: an electrophysiological analysis using high spatial resolution mapping. Clin Neurophysiol 111: 1241–1257. [DOI] [PubMed] [Google Scholar]
- Hopfinger JB, Buonovore MH, Mangun GR (2000): The neural mechanisms of top‐down attentional control. Nat Neurosci 3: 284–291. [DOI] [PubMed] [Google Scholar]
- Howes D, Boller F (1975): Simple reaction time: evidence for focal impairments from lesions of the right hemisphere. Brain 98: 317–332. [DOI] [PubMed] [Google Scholar]
- Jahanshahi M, Brown RG, Marsden CD (1992): Simple and choice reaction time and the use of advance information for motor preparation in Parkinson's disease. Brain 115: 539–564. [DOI] [PubMed] [Google Scholar]
- Jensen O, Gelfand J, Kounios J, Lisman JE (2002): Oscillations in the alpha band (9–12 Hz) increase with memory load during retention in a short‐term memory task. Cereb Cortex 12: 877–882. [DOI] [PubMed] [Google Scholar]
- Jokeit H, Makeig S (1994): Different event‐related patterns of gamma‐band power in brain waves of fast‐ and slow‐reacting subjects. Proc Natl Acad Sci USA 91: 6339–6343. [DOI] [PMC free article] [PubMed] [Google Scholar]
- Kanwisher N, Wojciulik E (2000): Visual attention: insights from brain imaging. Nat Rev Neurosci 1: 91–100. [DOI] [PubMed] [Google Scholar]
- Kastner S, Pinsk MA, De Weerd P, Desimone R, Ungerleider LG (1999): Increased activity in human visual cortex during directed attention in the absence of visual stimulation. Neuron 22: 751–761. [DOI] [PubMed] [Google Scholar]
- Kastner S, Ungerleider LG (2000): Mechanisms of visual attention in the human cortex. Annu Rev Neurosci 23: 315–341. [DOI] [PubMed] [Google Scholar]
- Keil A, Muller MM, Ray WJ, Gruber T, Elbert T (1999): Human gamma band activity and perception of a gestalt. J Neurosci 19: 7152–7161. [DOI] [PMC free article] [PubMed] [Google Scholar]
- Klimesch W, Doppelmayr M, Schwaiger J, Auinger P, Winkler T (1999): “Paradoxical” alpha synchronization in a memory task. Brain Res Cogn Brain Res 7: 493–501. [DOI] [PubMed] [Google Scholar]
- Koopmans LH (1981): An introduction to contemporary statistics. Boston, MA: Duxbury Press. [Google Scholar]
- Lee D (2003): Coherent oscillations in neuronal activity of the supplementary motor area during a visuomotor task. J Neurosci 23: 6798–6809. [DOI] [PMC free article] [PubMed] [Google Scholar]
- Liang H, Bressler SL, Ding M, Truccolo WA, Nakamura R (2002): Synchronized activity in prefrontal cortex during anticipation of visuomotor processing. Neuroreport 13: 2011–2016. [DOI] [PubMed] [Google Scholar]
- Luck SJ, Chelazzi L, Hillyard SA, Desimone R (1997): Neural mechanisms of spatial selective attention in areas V1, V2, and V4 of macaque visual cortex. J Neurophysiol 77: 24–42. [DOI] [PubMed] [Google Scholar]
- Michel CM, Grave de Peralta R, Lantz G, Gonzalez Andino S, Spinelli L, Blanke O, Landis T, Seeck M (1999): Spatio‐temporal EEG analysis and distributed source estimation in presurgical epilepsy evaluation. J Clin Neurophysiol 16: 239–266. [DOI] [PubMed] [Google Scholar]
- Monsell S, Driver J (2000): Control of cognitive processes. Cambridge, MA: MIT Press. [Google Scholar]
- Ohara S, Ikega A, Kunieda T, Yazawa S, Baba K, Nagamine T, Taki W, Hashimoto N, Mihara T, Shibasaki H (2000): Movement‐related changes of electrocorticographic activity in human supplementary motor area proper. Brain 123: 1203–1215. [DOI] [PubMed] [Google Scholar]
- Ohara S, Mima T, Baba K, Ikeda A, Kunieda T, Matsumoto R, Yamamoto J, Matsuhashi M, Nagamine T, Hirasawa K, Hori T, Mihara T, Hashimoto N, Salenius S, Shibasaki H (2001): Increased synchronization of cortical oscillatory activities between human supplementary motor and primary sensorimotor areas during voluntary movements. J Neurosci 21: 9377–9386. [DOI] [PMC free article] [PubMed] [Google Scholar]
- Posner MI, Dahaene S (1994): Attentional networks. Trends Neurosci 17: 75–79. [DOI] [PubMed] [Google Scholar]
- Posner M, Inhoff AW, Friedrich FJ, Cohen A (1987): Isolating attentional systems: a cognitive‐anatomical analysis. Psychobiology 15: 107–121. [Google Scholar]
- Sanes JN, Donoghue JP (1993): Oscillations in local field potentials of the primate motor cortex during voluntary movement. Proc Natl Acad Sci USA 90: 4470–4474. [DOI] [PMC free article] [PubMed] [Google Scholar]
- Schultz W (2000): Multiple reward signals in the brain. Nat Rev Neurosci 1: 199–207. [DOI] [PubMed] [Google Scholar]
- Steinmetz PN, Roy A, Fitzgerald PJ, Hsiao SS, Johnson KO, Niebur E (2000): Attention modulates synchronized neuronal firing in primate somatosensory cortex. Nature 404: 187–190. [DOI] [PubMed] [Google Scholar]
- Sidak Z (1967): Rectangular confidence regions for the means of multivariate normal distributions. J Am Stat Assoc 62: 626–633. [Google Scholar]
- Stockwell RG, Mansinha L, Lowe RP (1996): Localization of the complex spectrum: the S transform. IEEE Trans Signal Process 44: 998–1001. [Google Scholar]
- Sturm W, Willmes K (2001): On the functional neuroanatomy of intrinsic and phasic alertness. Neuroimage 14: 76–84. [DOI] [PubMed] [Google Scholar]
- Thiel CM, Zilles K, Fink GR (2004): Cerebral correlates of alerting, orienting and reorienting of visuospatial attention: an event‐related fMRI study. Neuroimage 21: 318–328. [DOI] [PubMed] [Google Scholar]
- Thut G, Hauert CA, Blanke O, Morand S, Seeck M, Gonzalez SL, Grave de Peralta R, Spinelli L, Khateb A, Landis T, Michel CM (2000): Visually induced activity in human frontal motor areas during simple visuomotor performance. Neuroreport 11: 2843–2848. [DOI] [PubMed] [Google Scholar]
- von Stein A, Chiang C, König P (2000): Top‐down processing mediated by interareal synchronization. Proc Natl Acad Sci USA 97: 14748–14753. [DOI] [PMC free article] [PubMed] [Google Scholar]
- Yamaguchi S, Tsuchiya H, Kobayashi S (1994): Electroencephalographic activity associated with shifts of visuospatial attention. Brain 117: 553–562. [DOI] [PubMed] [Google Scholar]
- Welford AT (1977): Motor performance In: Birren JE, Schaie KW, editors. Handbook of the psychology of aging. New York: Van Nostrand Reinhold; p 450–496. [Google Scholar]